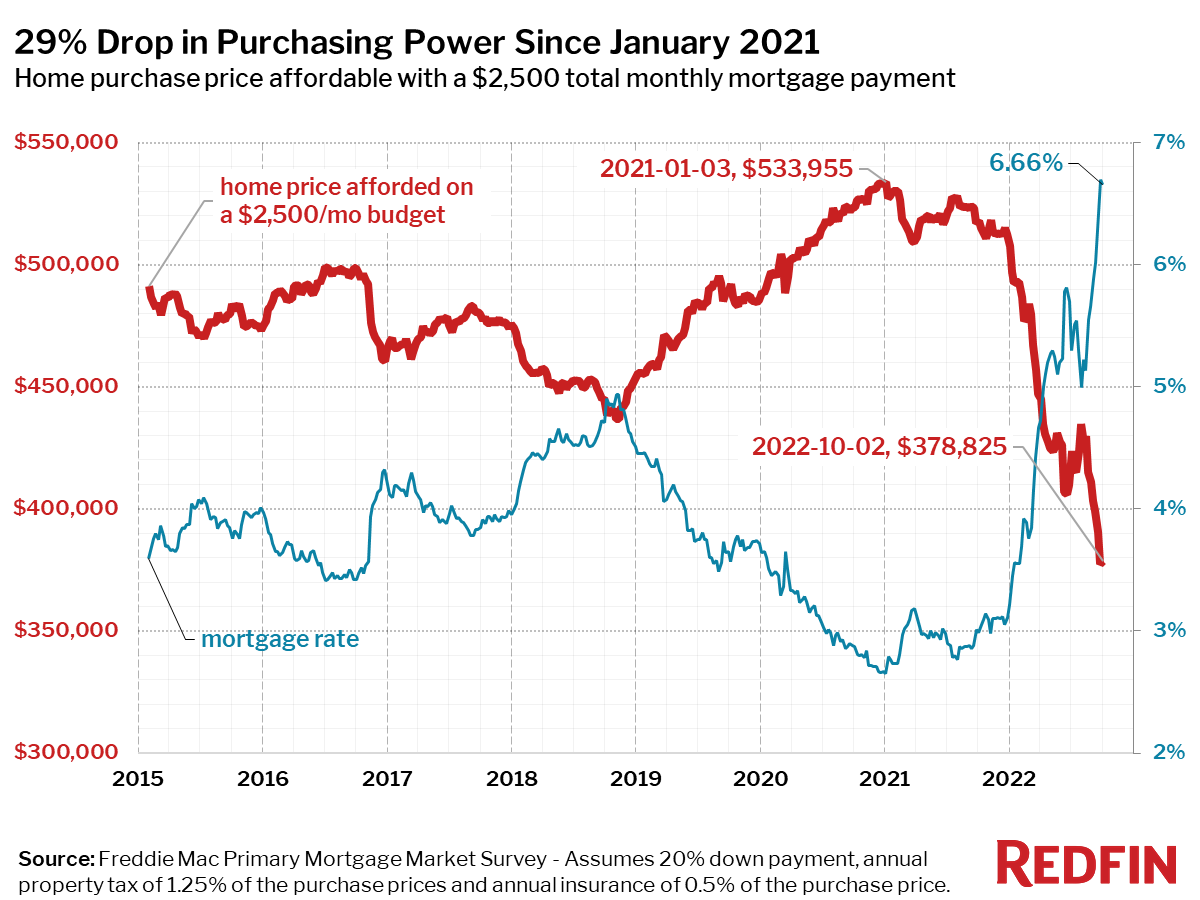
Homebuyers have lost 29% of their purchasing power since rates bottomed out in early 2021. Home prices remain elevated due to low supply, but early demand signals weakened sharply last week.
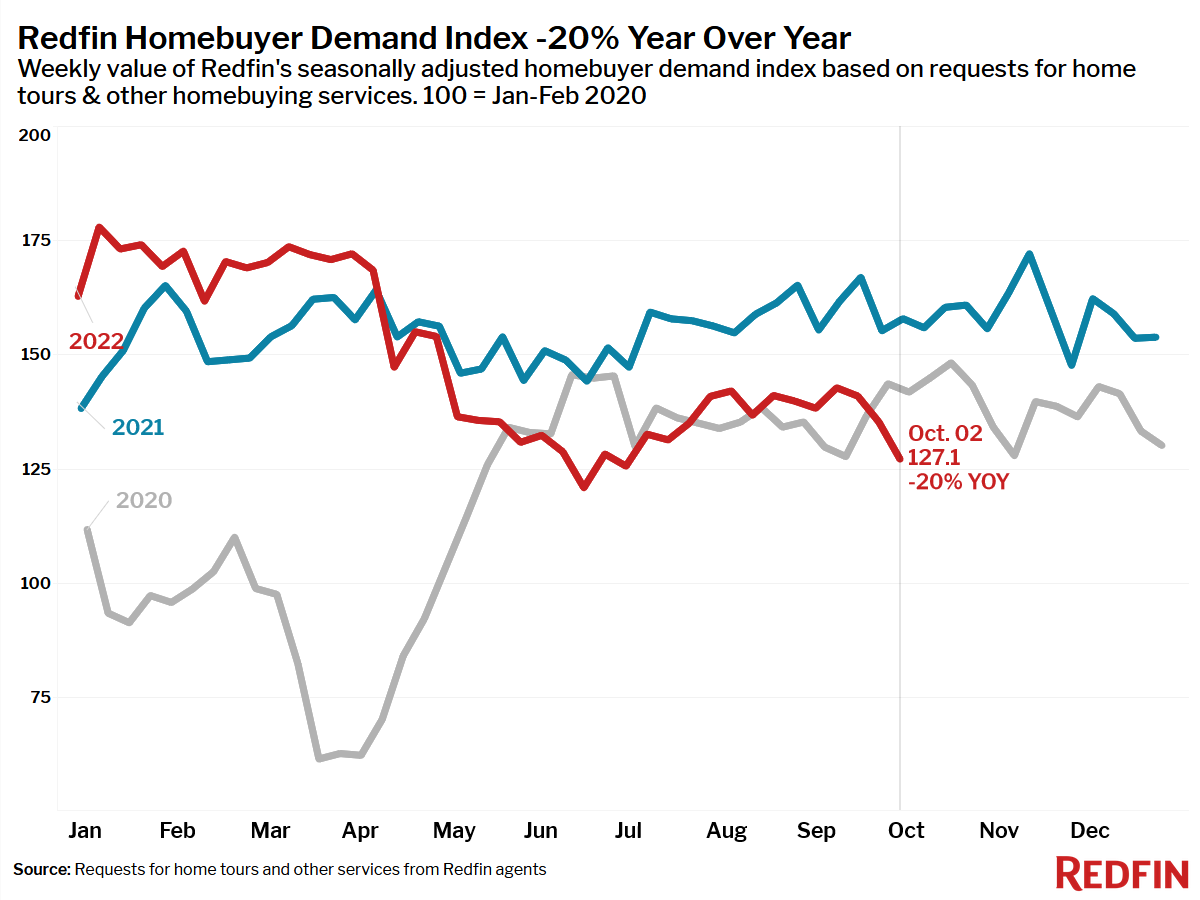
Early indicators of homebuying demand show an accelerated pullback last week as mortgage rates shot up to a 15-year high. Home tours fell 7% and mortgage purchase applications declined 13%. Redfin’s Homebuyer Demand Index, a measure of requests for home tours and other home-buying services, fell 6% last week to its lowest level since mid-June, when mortgage rates first jumped toward 6%.
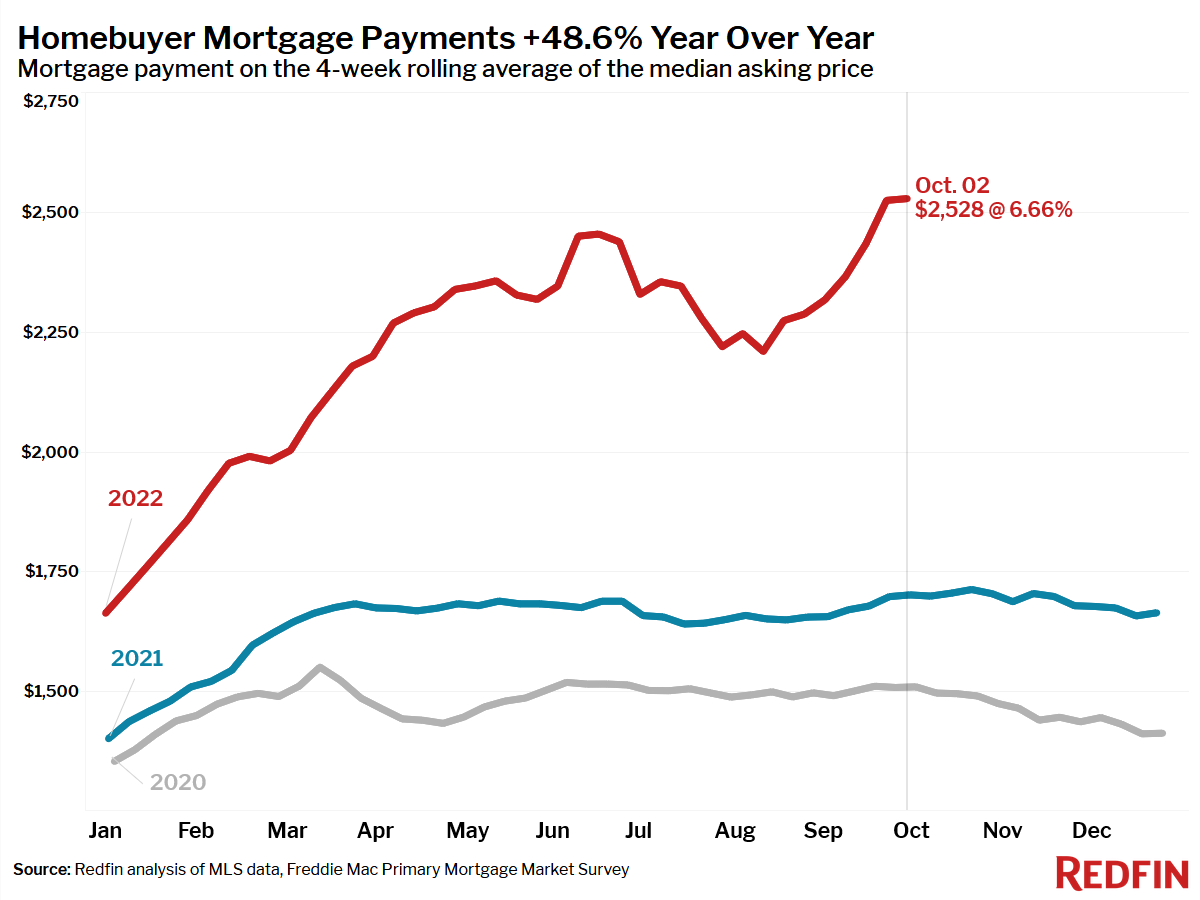
Homebuyers have lost 29% of their purchasing power as the average 30-year-fixed mortgage rate climbed from 2.65% at the start of 2021 to 6.66% today.
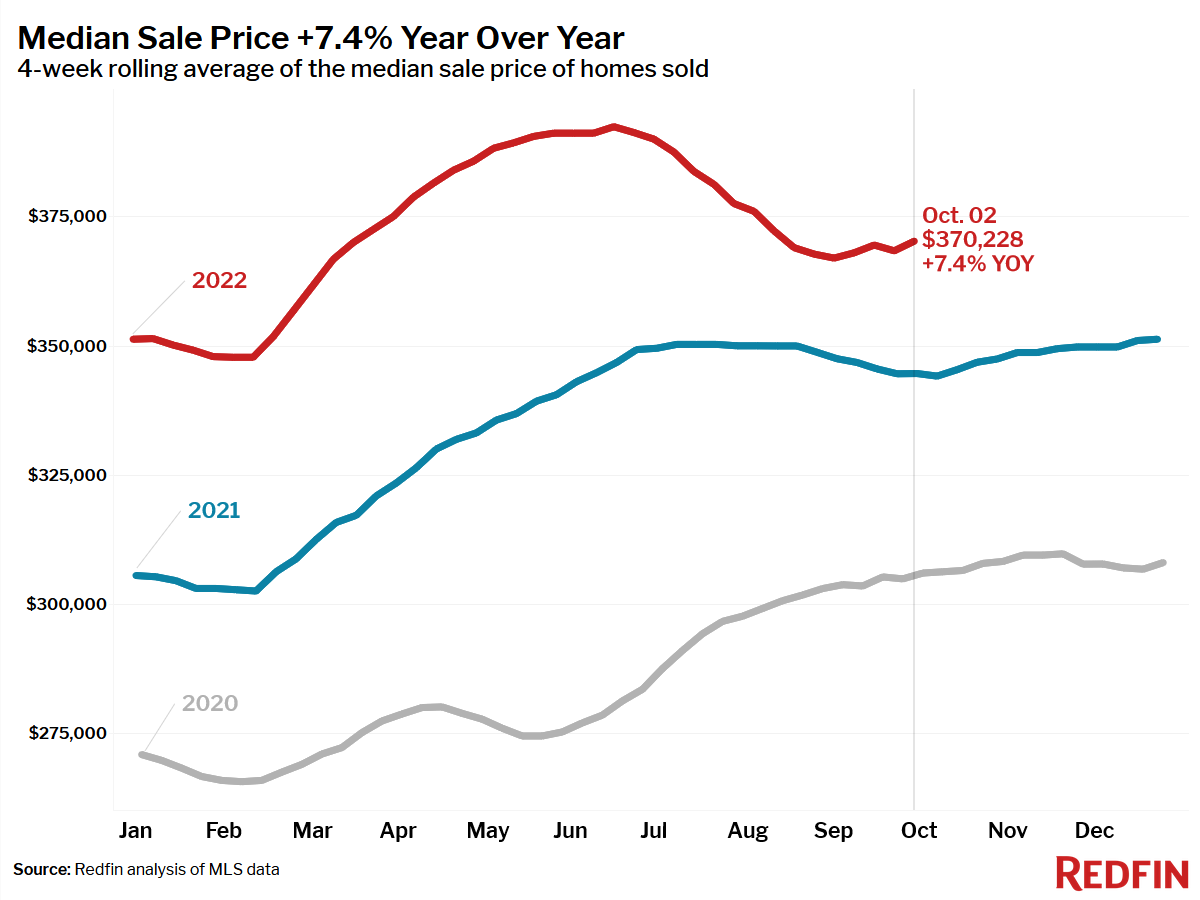
“Mortgage rates well over 6% are spooking homebuyers,” said Redfin Deputy Chief Economist Taylor Marr. “Sellers are pulling back in this market, but buyers are pulling back even more. Home prices are holding steady for now. It will take a few months before the prices of closed sales start to reflect this shock to the market. However, there is evidence of sizable price declines in parts of the market that aren’t accounted for by MLS data, such as home builders offloading homes in bulk at a 20% discount.”
Leading indicators of homebuying activity:
- For the week ending October 6, 30-year mortgage rates declined slightly to 6.66%.
- Fewer people searched for “homes for sale” on Google. Searches during the week ending October 1 were down 33% from a year earlier.
- The seasonally adjusted Redfin Homebuyer Demand Index—a measure of requests for home tours and other home-buying services from Redfin agents—declined 10% in the past three weeks to its lowest point since the week ending June 19. The index was down 26% year over year, and fell below the level at the same time in 2020.
- Touring activity as of October 2 was down 26% from the start of the year, compared to an 8% increase at the same time last year, according to home tour technology company ShowingTime.
- Mortgage purchase applications during the week ending September 30 were down 13% week over week, seasonally adjusted, to the lowest level since October 2015. Purchase applications were down 37% from a year earlier.
Key housing market takeaways for 400+ U.S. metro areas:
Unless otherwise noted, the data in this report covers the four-week period ending October 2. Redfin’s housing market data goes back through 2012.
Data based on homes listed and/or sold during the period:
- The median home sale price was $367,652, up 7% year over year.
- Home sale prices in San Francisco fell 1.4% year over year. Neighboring Oakland, CA, where prices fell 3.4% and New Orleans (-9%) were the only other metro areas that saw year-over-year median-sale-price declines.
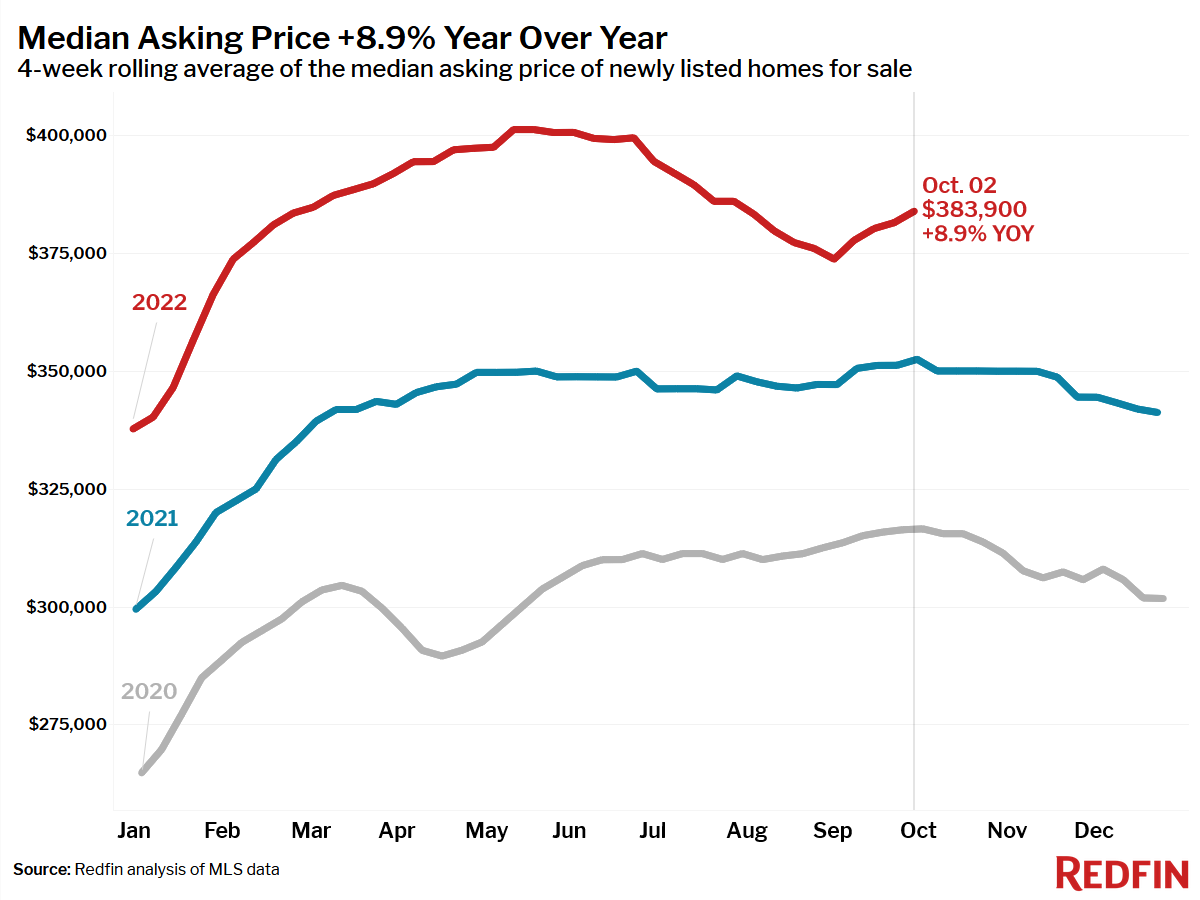
- The median asking price of newly listed homes increased 9% year over year to $383,000.
- The monthly mortgage payment on the median-asking-price home climbed to a record $2,528 at the current 6.66% mortgage rate, up 49% from $1,701 a year earlier, when mortgage rates were 2.99% and up from a recent low of $2,209 during the four-week period ending August 14.
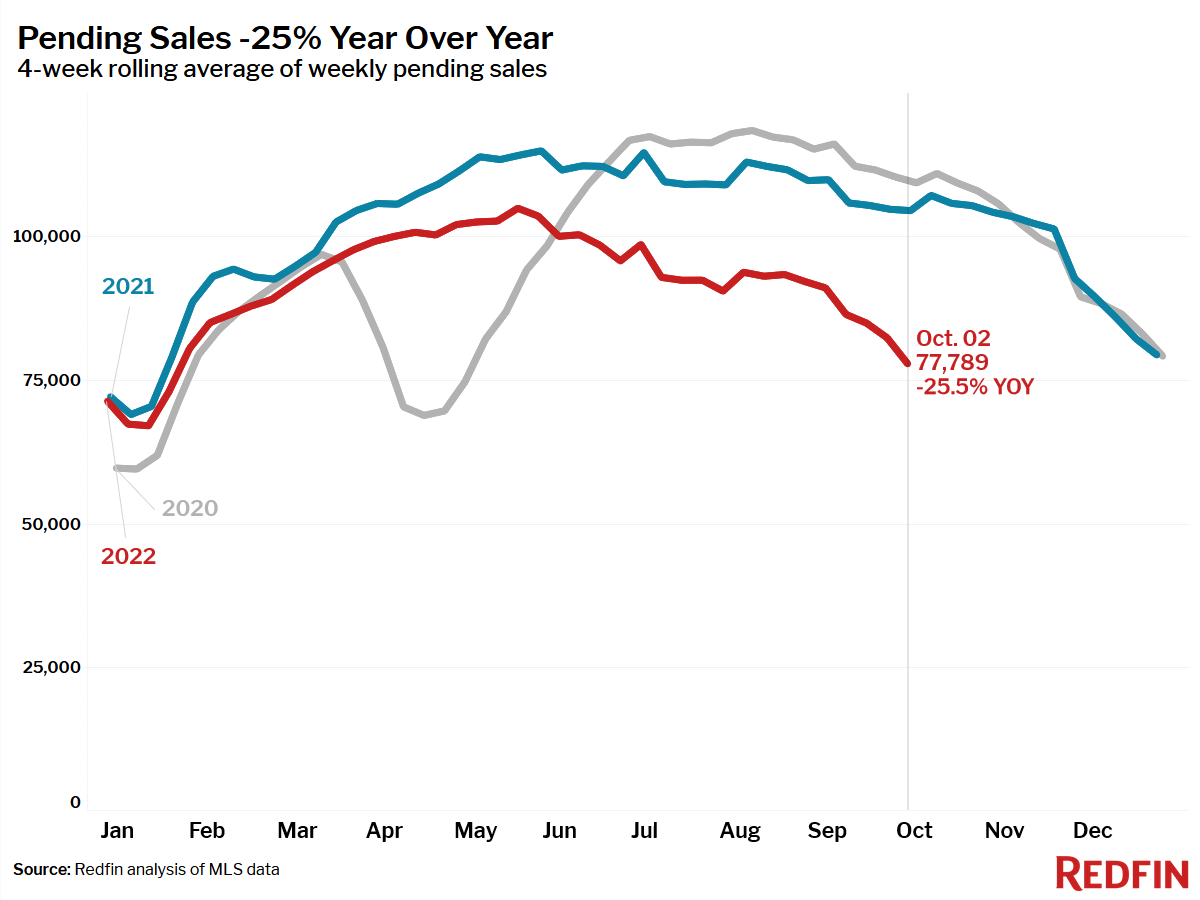
- Pending home sales were down 25% year over year, the largest decline since May 2020.
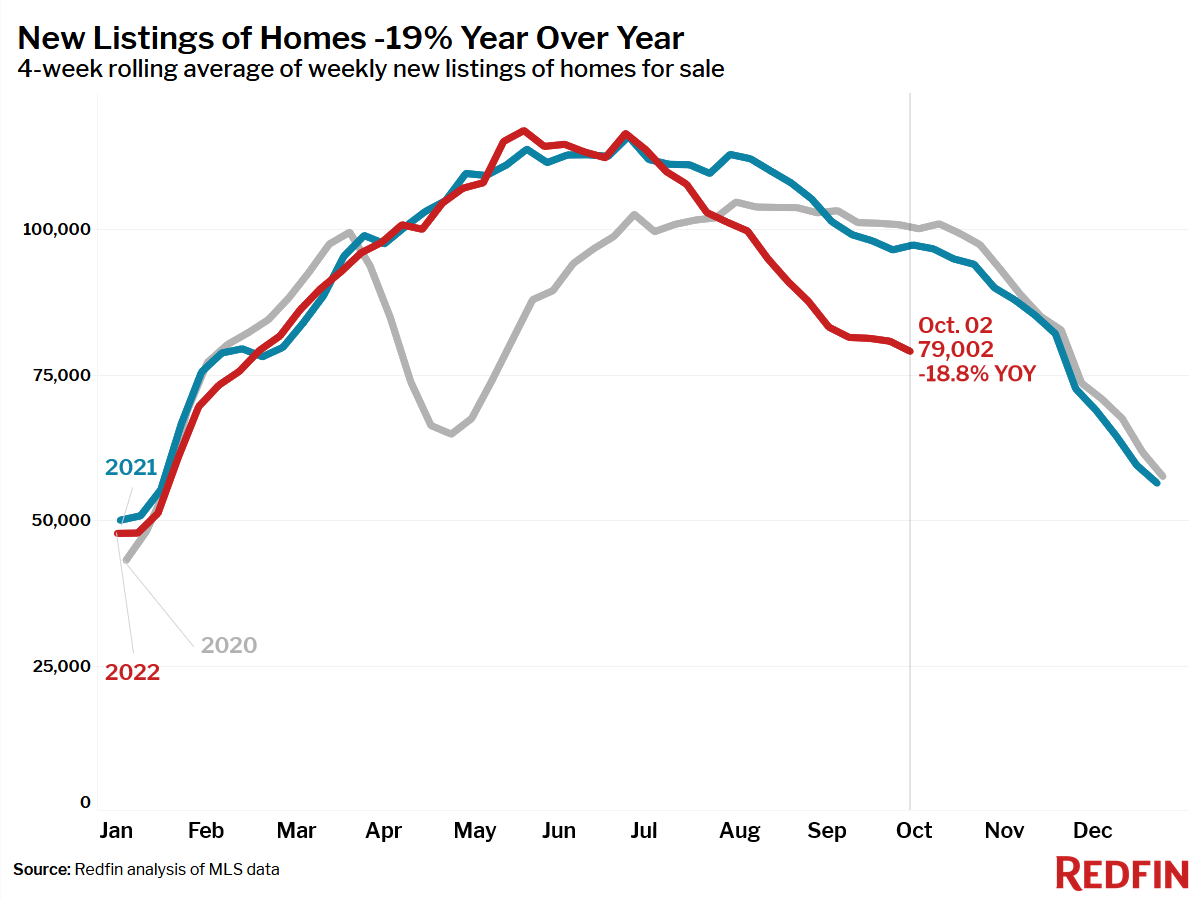
- New listings of homes for sale were down 18% from a year earlier.
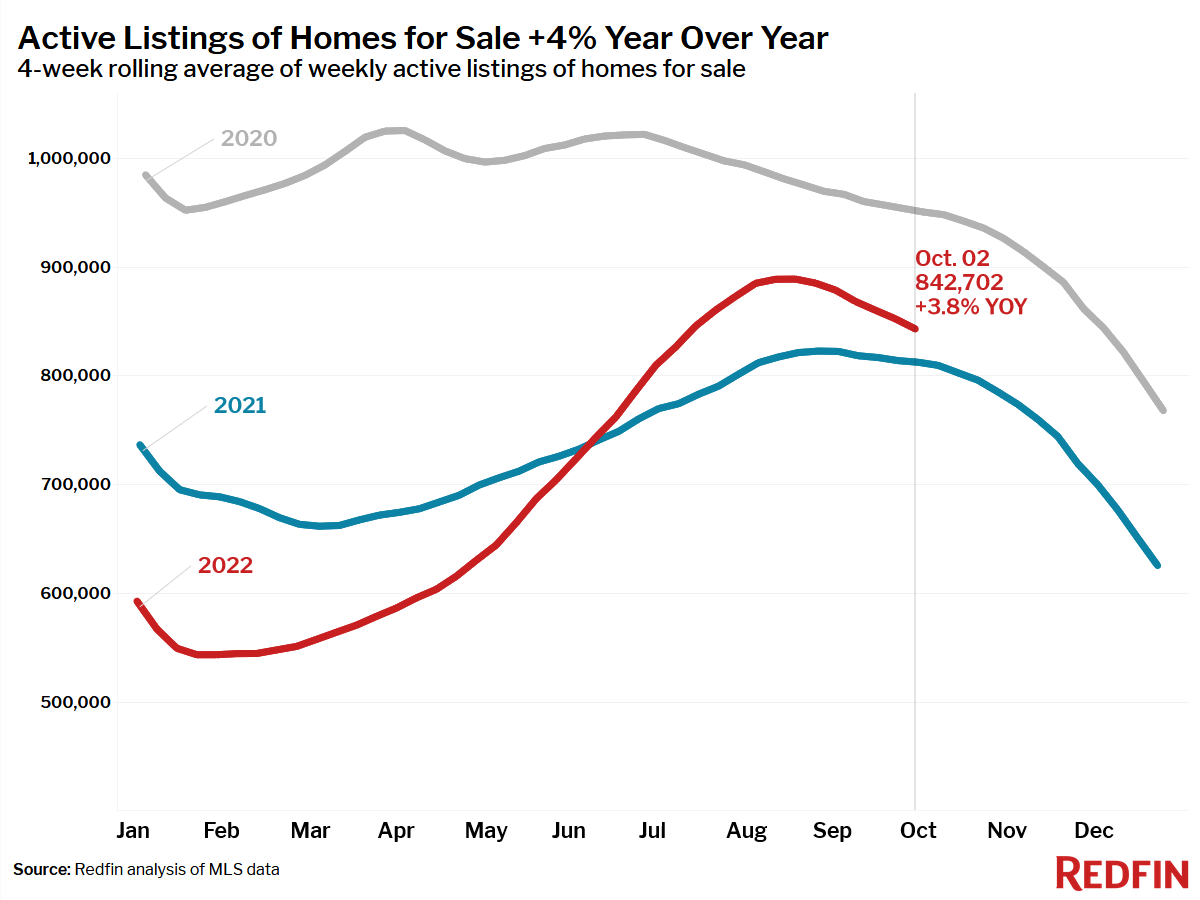
- Active listings (the number of homes listed for sale at any point during the period) fell 1% from the prior four-week period. On a year-over-year basis, they rose 3%.
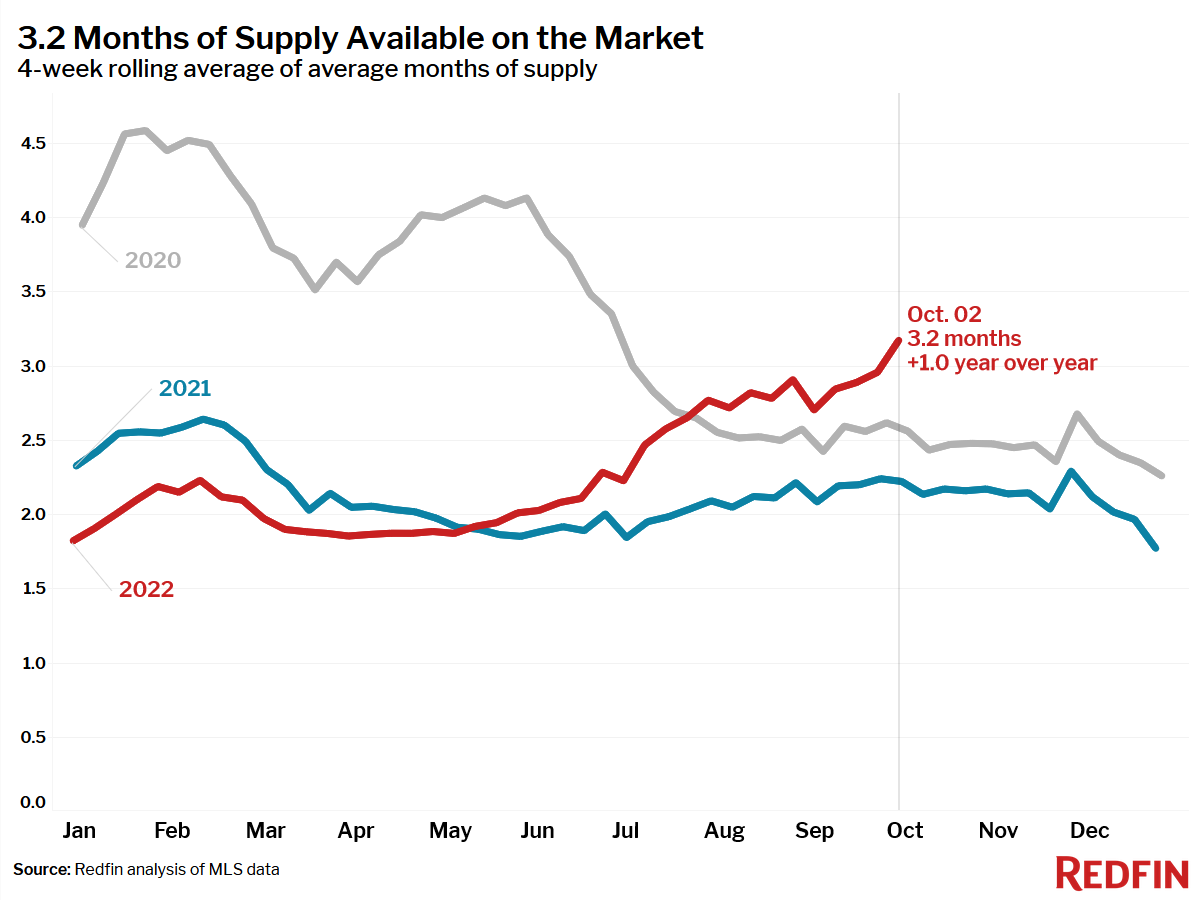
- Months of supply—a measure of the balance between supply and demand, calculated by dividing the number of active listings by closed sales—increased to 3.0 months, the highest level since July 2020.
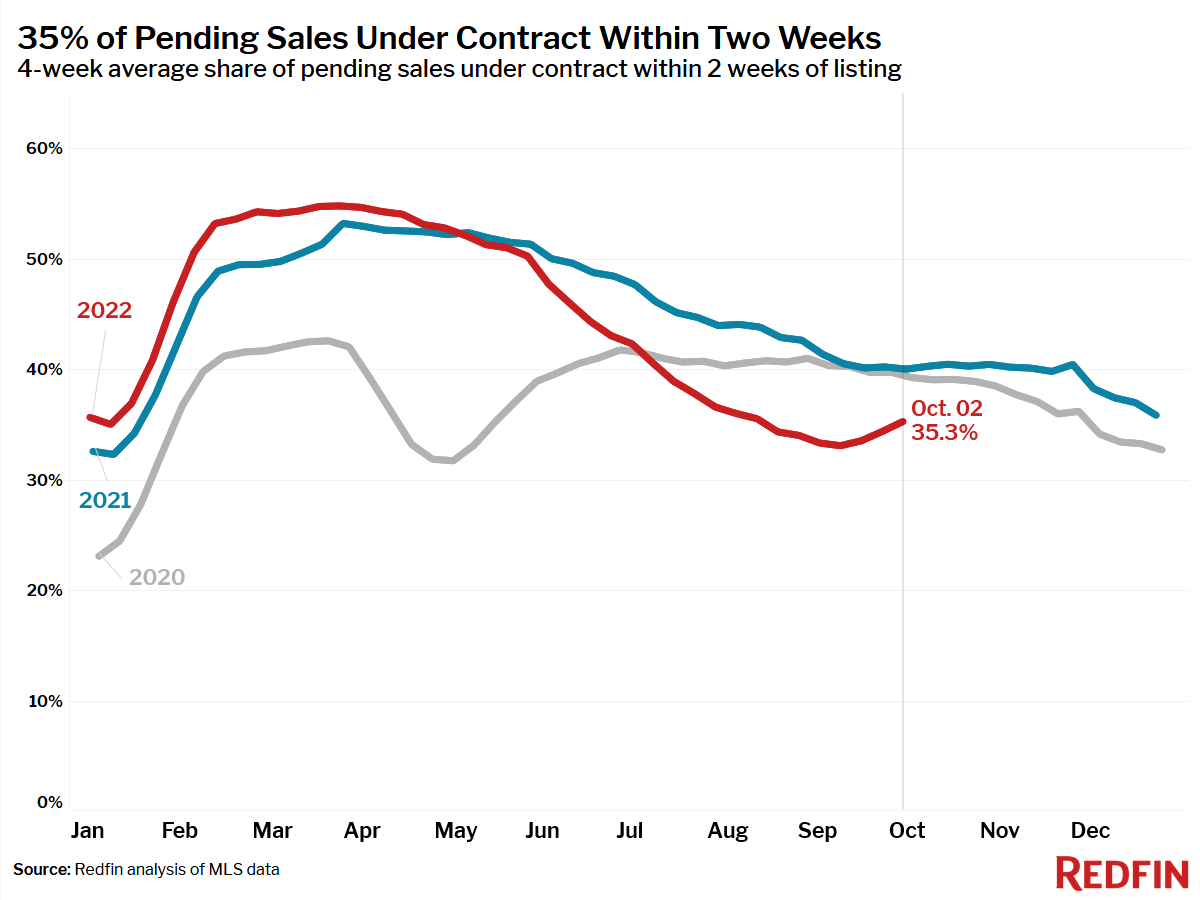
- 35% of homes that went under contract had an accepted offer within the first two weeks on the market, little changed from the prior four-week period but down from 40% a year earlier.
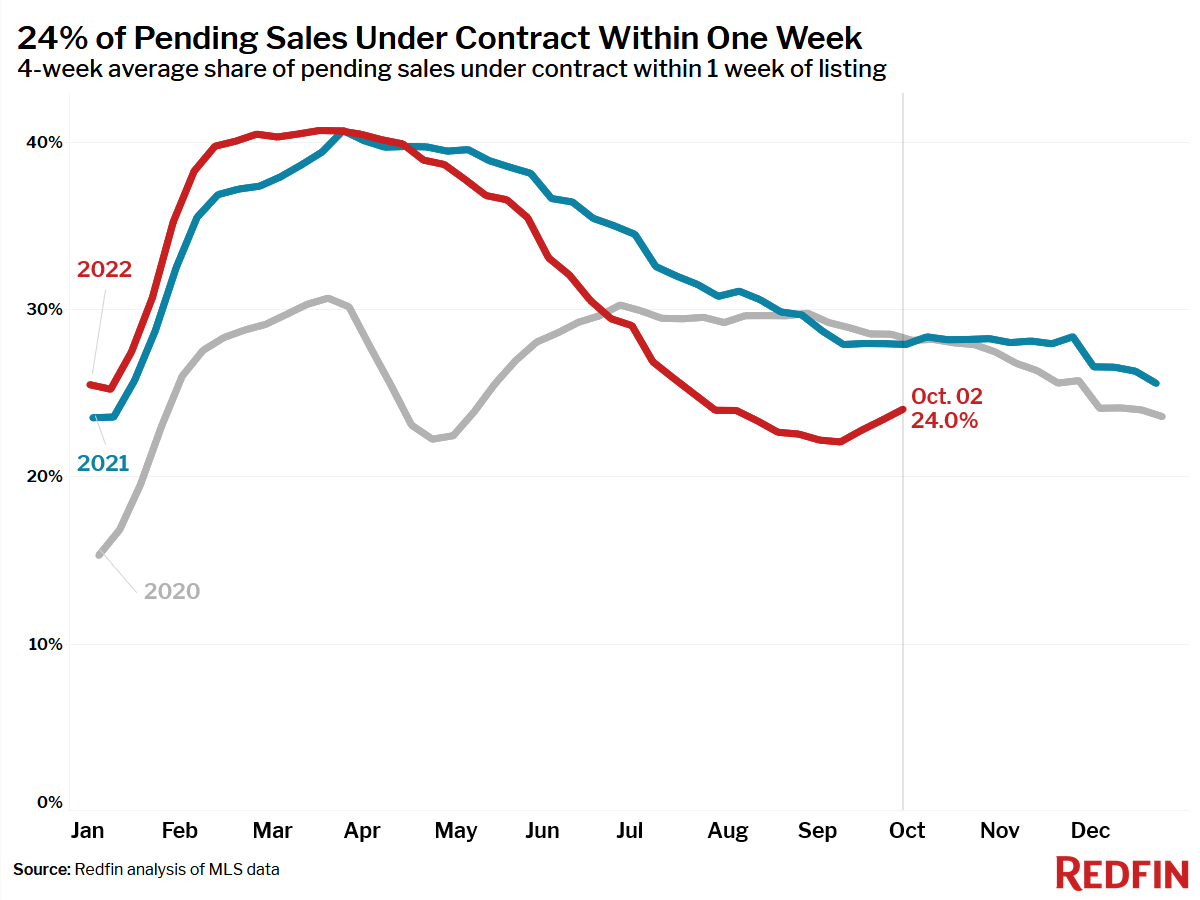
- 24% of homes that went under contract had an accepted offer within one week of hitting the market, little changed from the prior four-week period but down from 28% a year earlier.
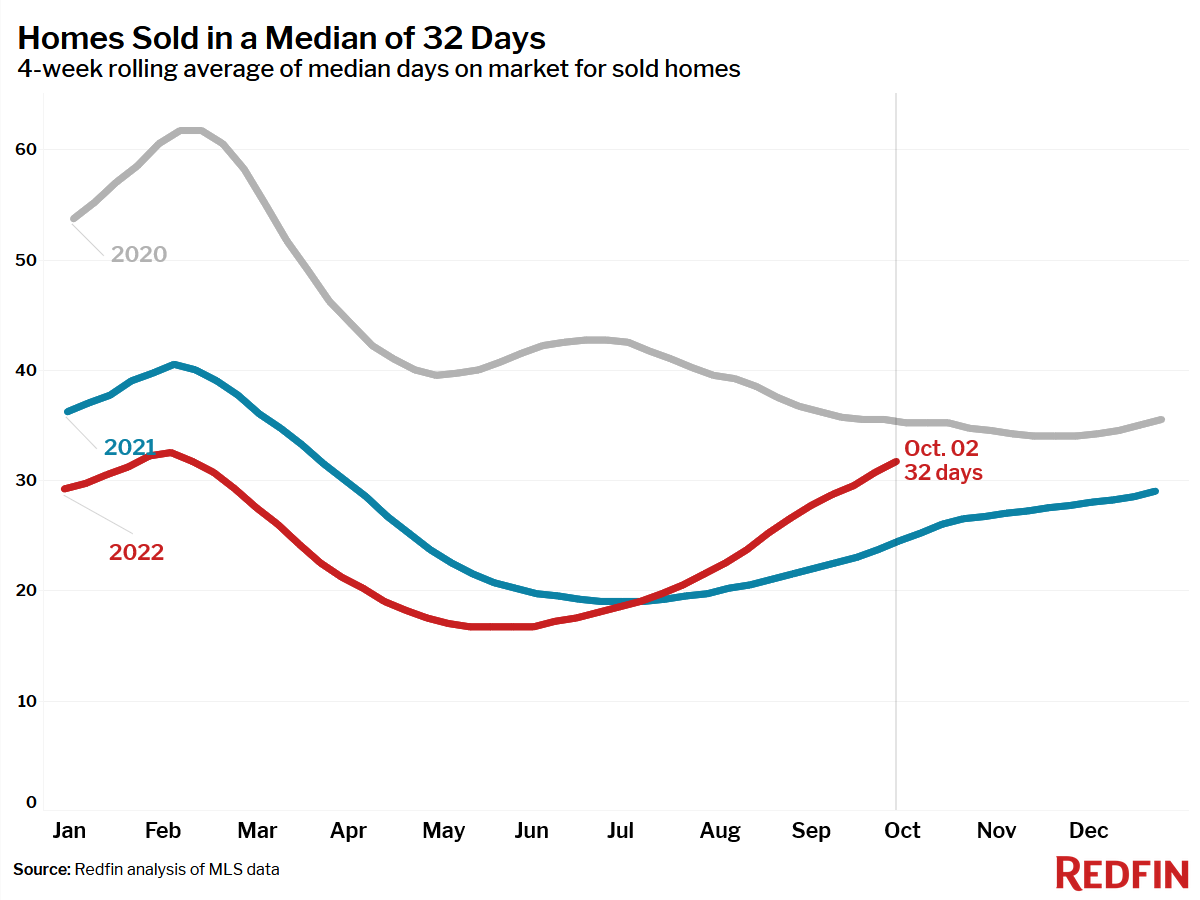
- Homes that sold were on the market for a median of 32 days, up a full week from 25 days a year earlier and the record low of 17 days set in May and early June.
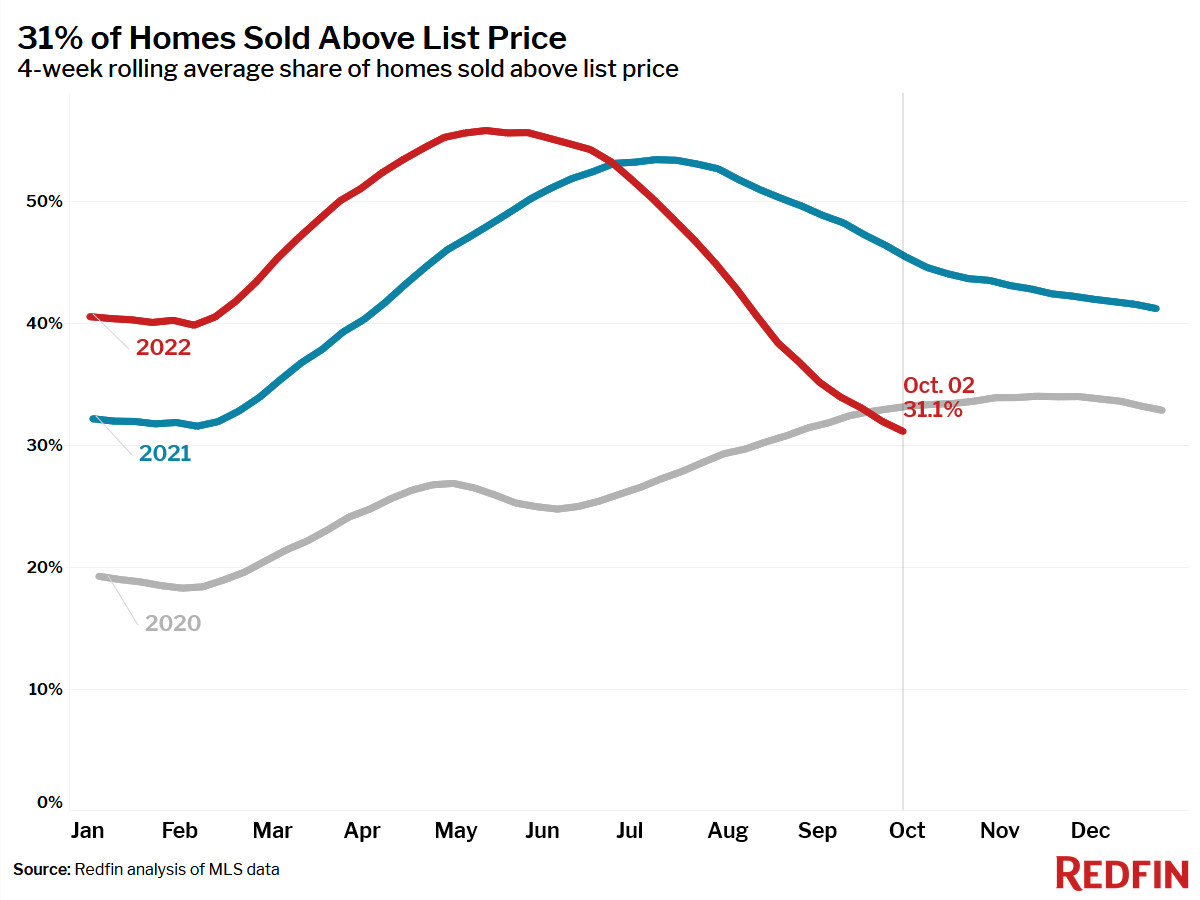
- 31% of homes sold above list price, down from 45% a year earlier and the lowest level since February 2021.
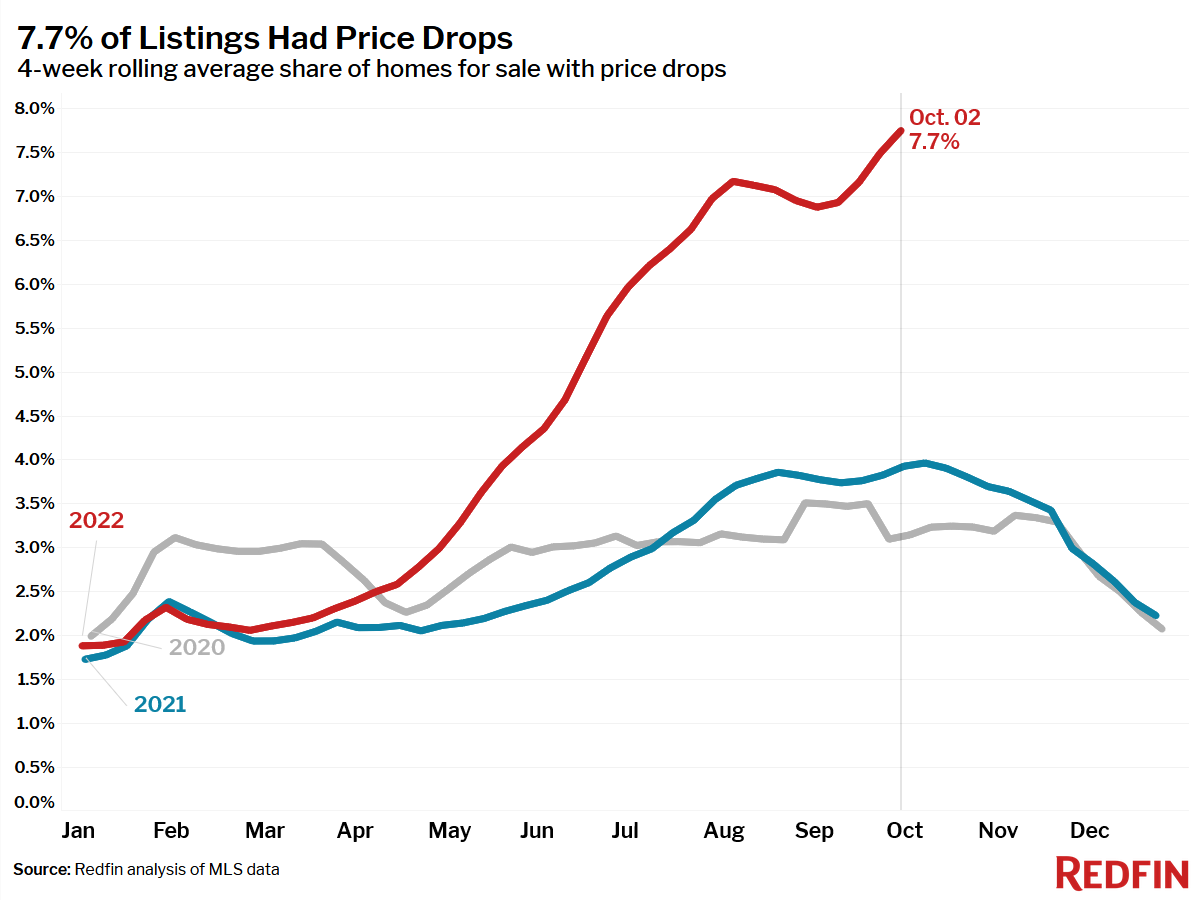
- On average, 7.7% of homes for sale each week had a price drop, a record high, up from 3.9% a year earlier.
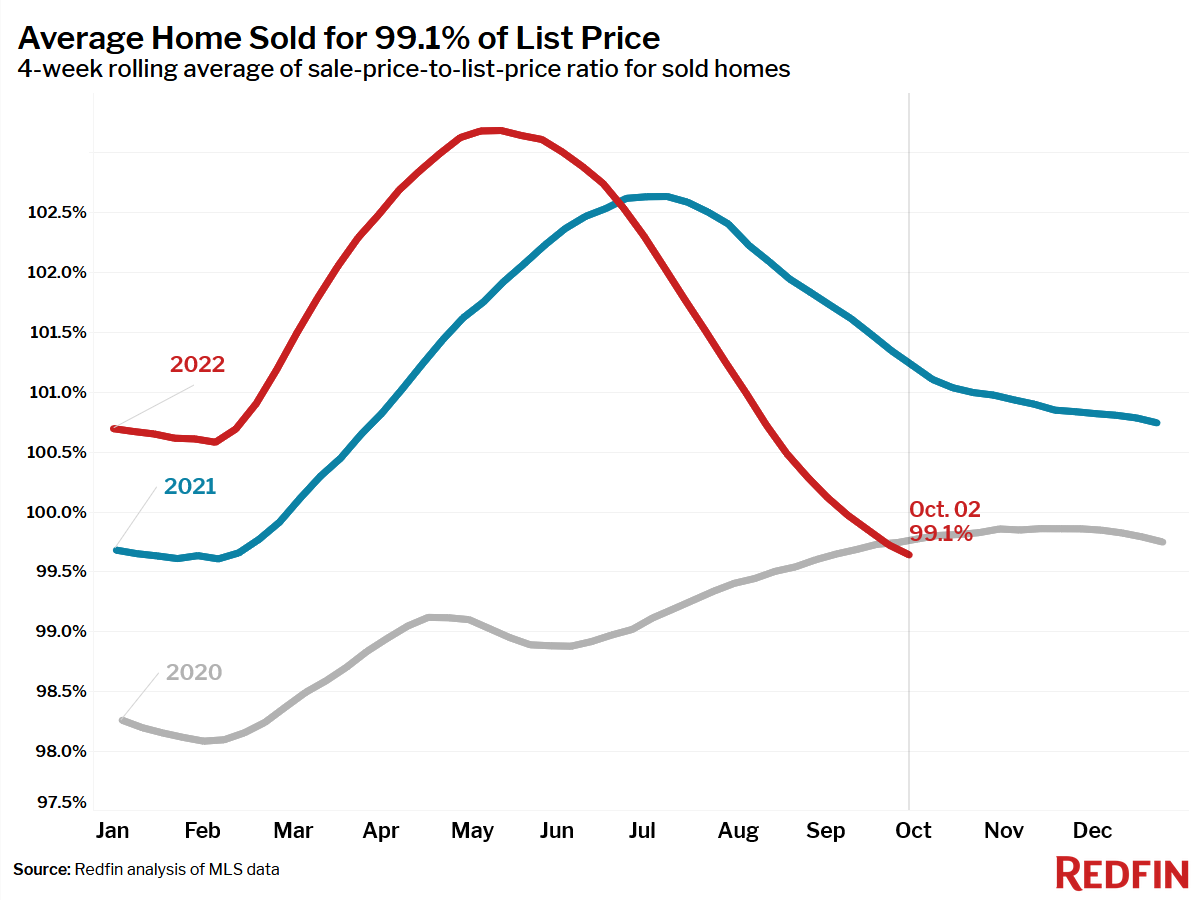
- The average sale-to-list price ratio, which measures how close homes are selling to their asking prices, fell to 99.1% from 100.7% a year earlier. This was the lowest level since August 2020.
Refer to our metrics definition page for explanations of all the metrics used in this report.