Some buyers have hit their limit on record-high prices, but others may return to the market with more homes to choose from and less competition.
The U.S. housing market lost more steam as summer began, with pending sales continuing their slide and the number of homes for sale slowly growing. Google trends also revealed a continued decline in online house hunting, with searches for “Real Estate” dipping below 2019 levels (-4.5%) for the first time this year. Mortgage purchase applications fell dramatically week over week (-5%) to their lowest level since May 2020, according to the Mortgage Bankers Association home purchase index.
Home prices are still climbing, posting their highest year-over-year gain on record, but the share of homes for sale with price drops inched above 2020 levels for the first time this year. Most measures of early-stage homebuying demand point to further cooling in the housing market over the summer, but Redfin’s Homebuyer Demand Index—a measure of requests for home tours and other home-buying services from Redfin agents—rose slightly from the prior week. This may be a reflection of the fact that there was a small increase in the number of homes available to tour.
Unless otherwise noted, the data in this report covers the four-week period ending June 27. Redfin’s housing market data goes back through 2012.
“The month of June was a clear turning point in the ultra-hot housing market of 2021,” said Redfin Lead Economist Taylor Marr. “As home prices continue to set records, some buyers have hit their limit and are stepping back. At the same time, homes are hitting the market at pre-pandemic levels again, which may finally ease competition and bring some sense of balance to the market. The upshot is that fewer bidding wars could actually keep some on-the-fence buyers in the market and lure back some of the homebuying dropouts.”
Key housing market takeaways for 400+ U.S. metro areas:
Data based on homes listed and/or sold during the period:
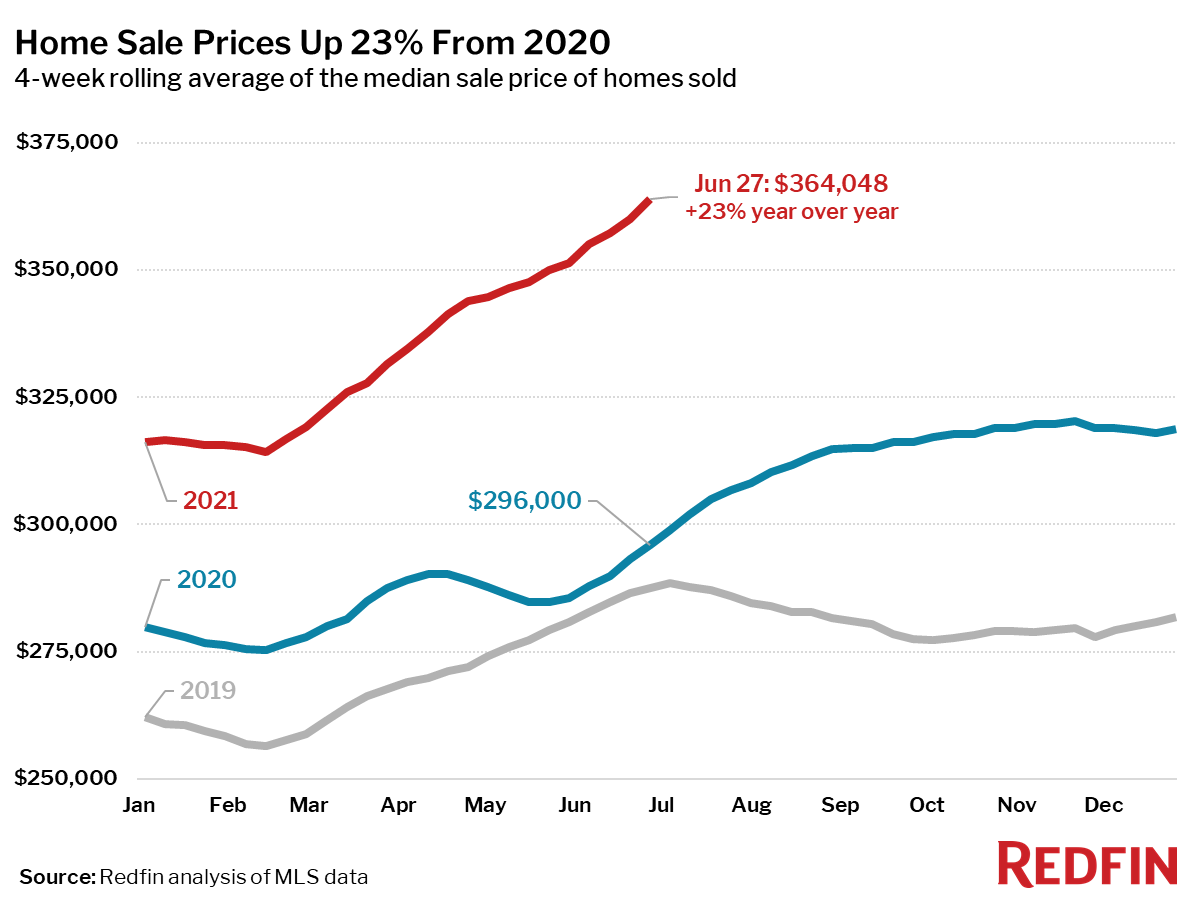
- The median home-sale price increased 23% year over year to $364,048, a record high.
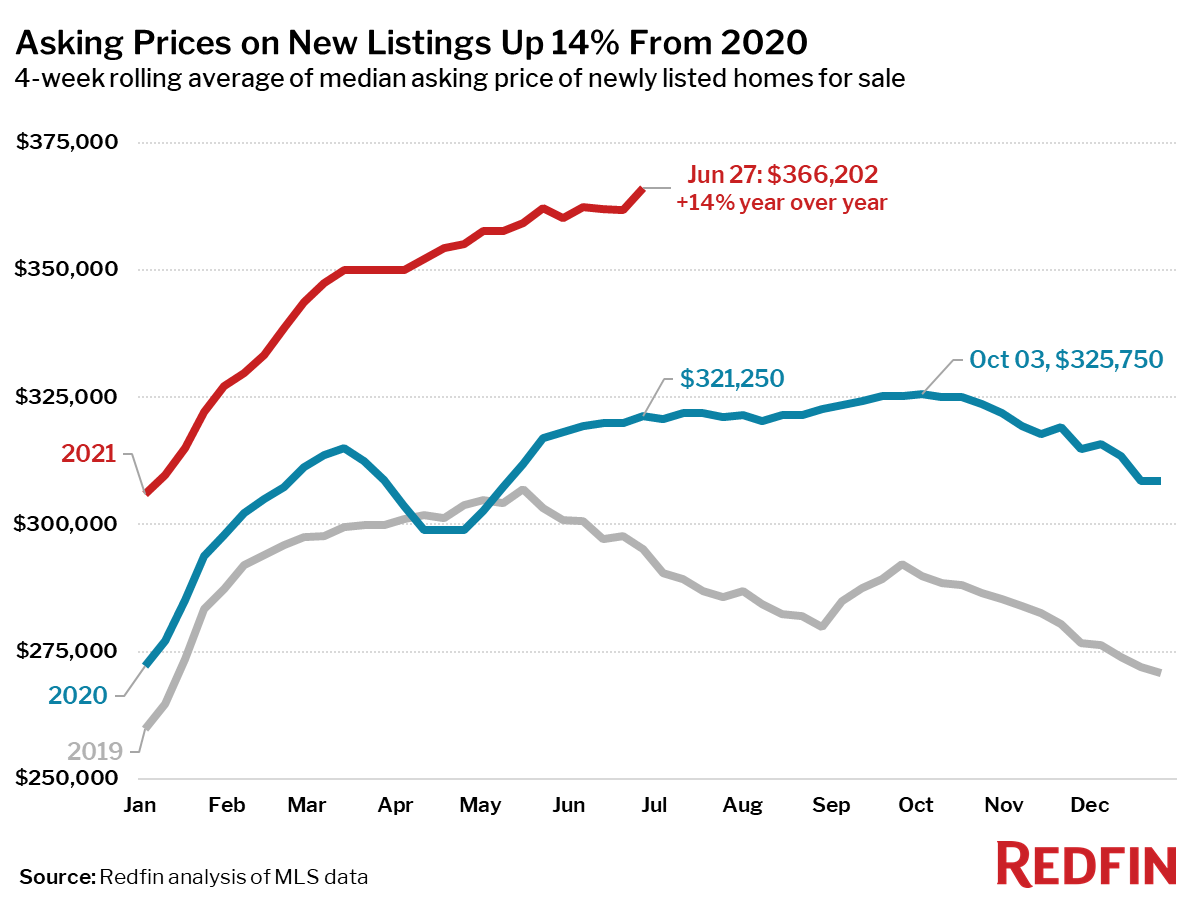
- Asking prices of newly listed homes were up 14% from the same time a year ago to a median of $366,202, also a record high.
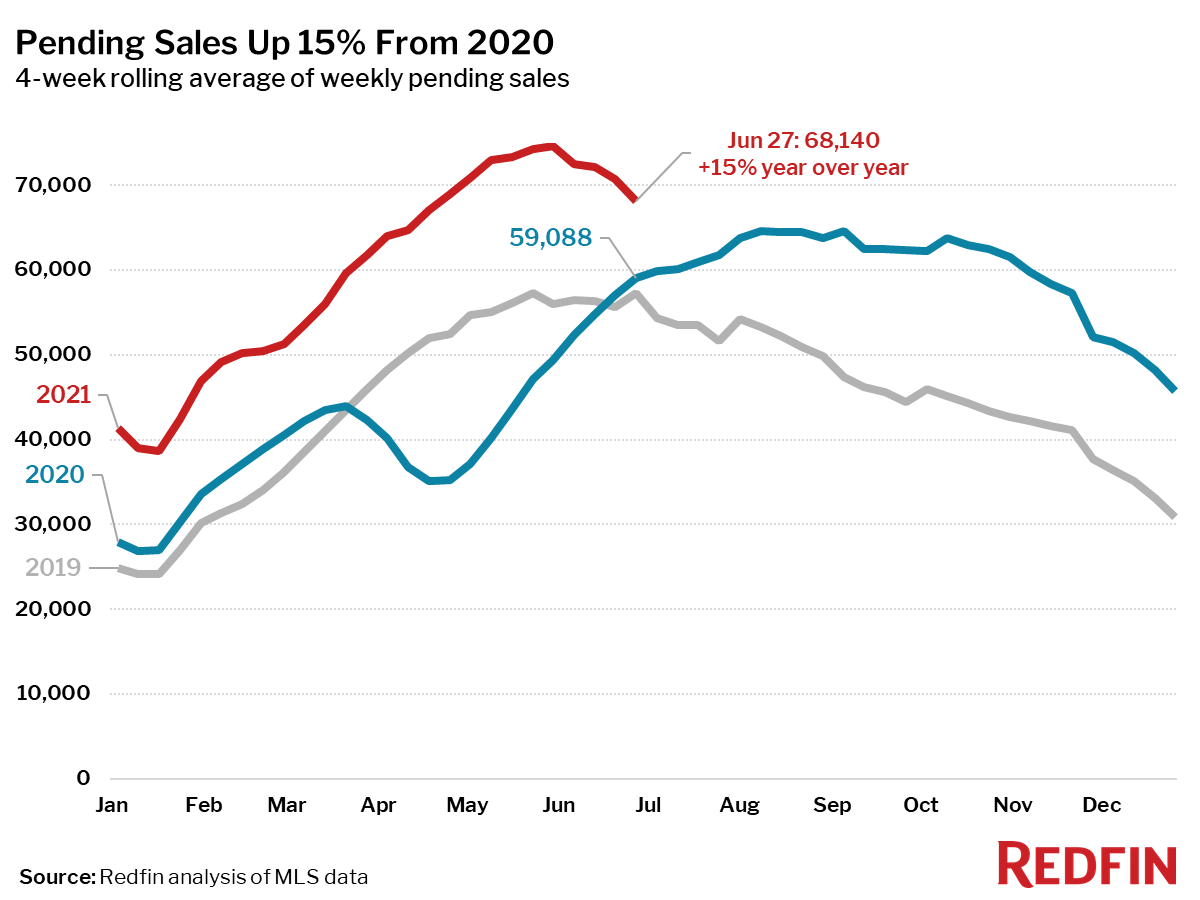
- Pending home sales were up 15% year over year, the smallest increase since the four-week period ending July 19, 2020. Pending sales were down 9% from the four-week period ending May 30, compared to a 2% increase over the same period in 2019.
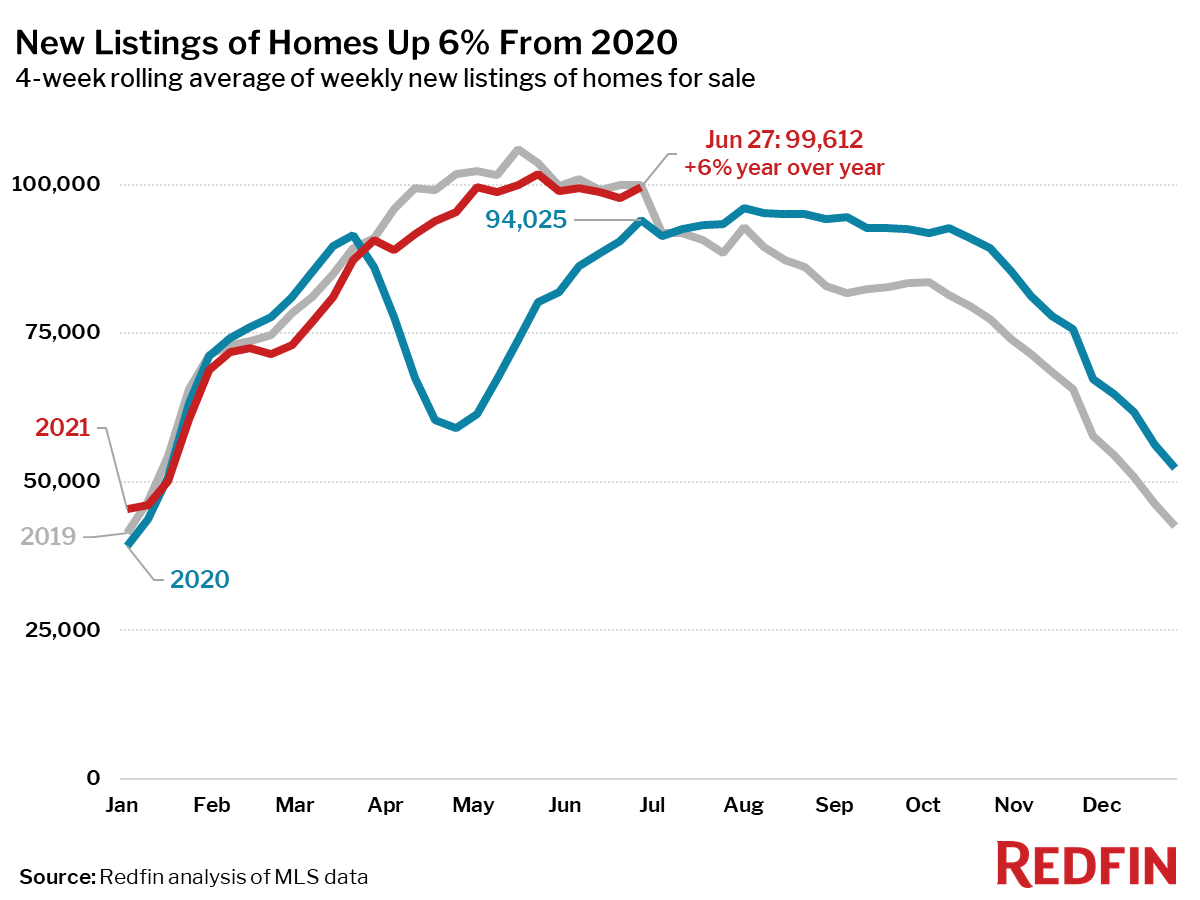
- New listings of homes for sale were up 6% from a year earlier, and have been mostly flat since the beginning of May. New listings had been below 2019 levels since late March, but reached parity with 2019 during the most recent period.
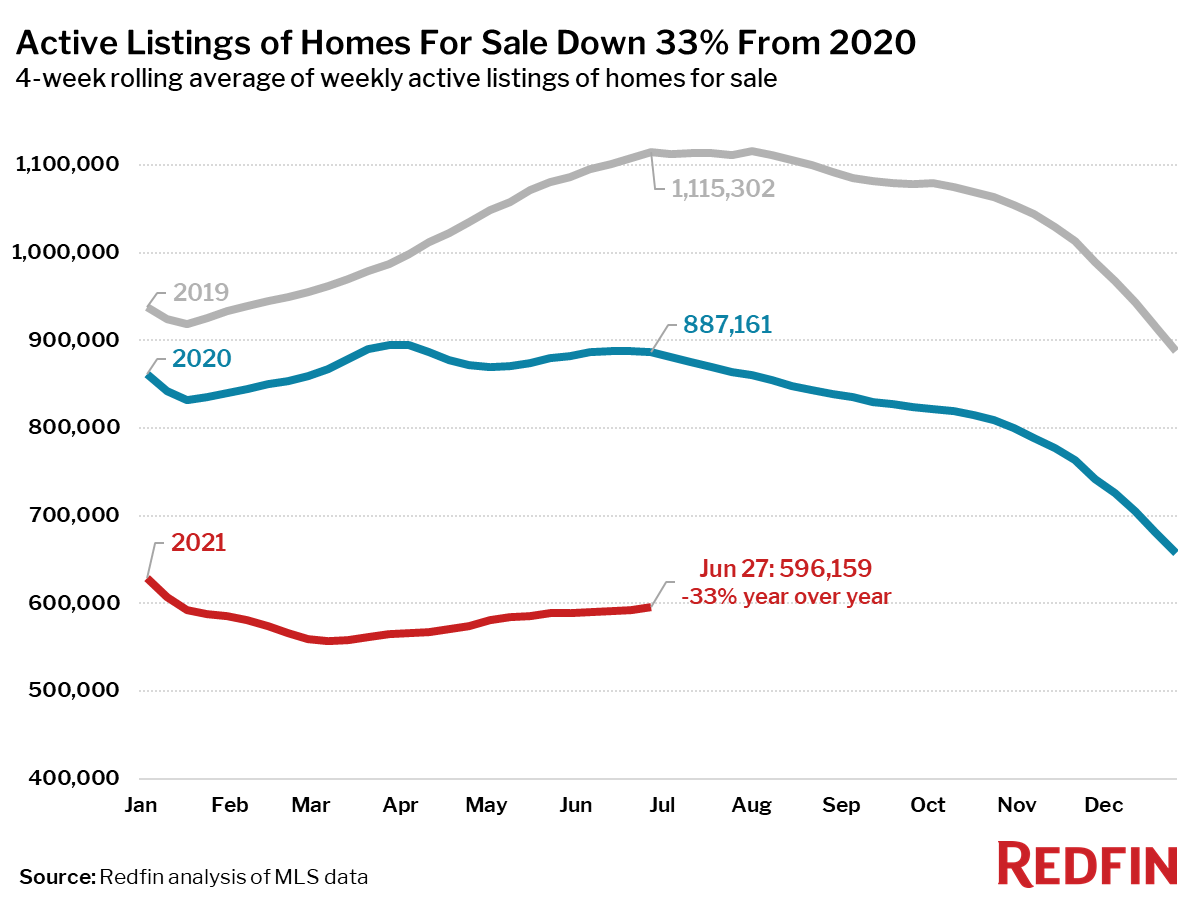
- Active listings (the number of homes listed for sale at any point during the period) fell 33% from 2020—the smallest decline since the four-week period ending February 14—but have climbed 7% since their 2021 low during the four week period ending March 7.
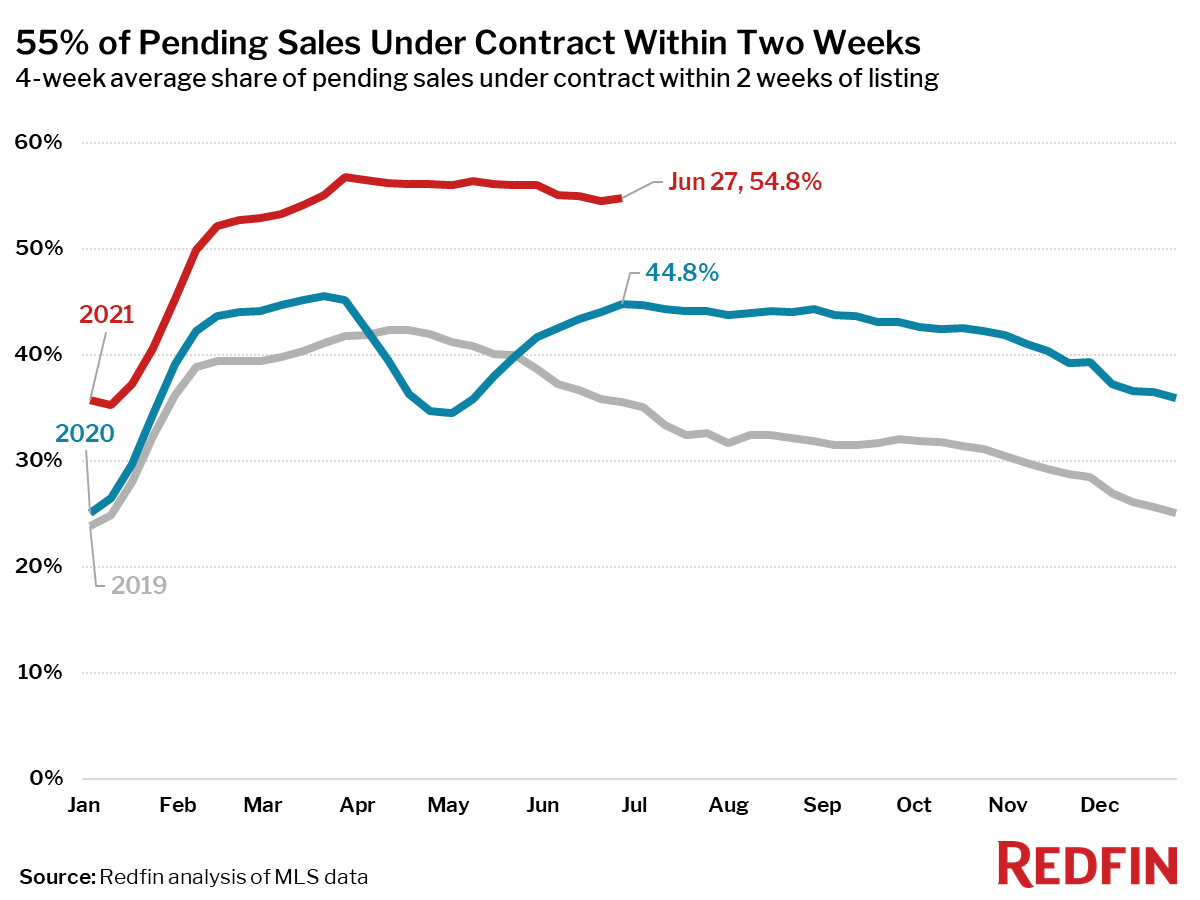
- 55% of homes that went under contract had an accepted offer within the first two weeks on the market, well above the 45% rate during the same period a year ago, but down 2 percentage points from the high point of the year, set during the four-week period ending March 28.
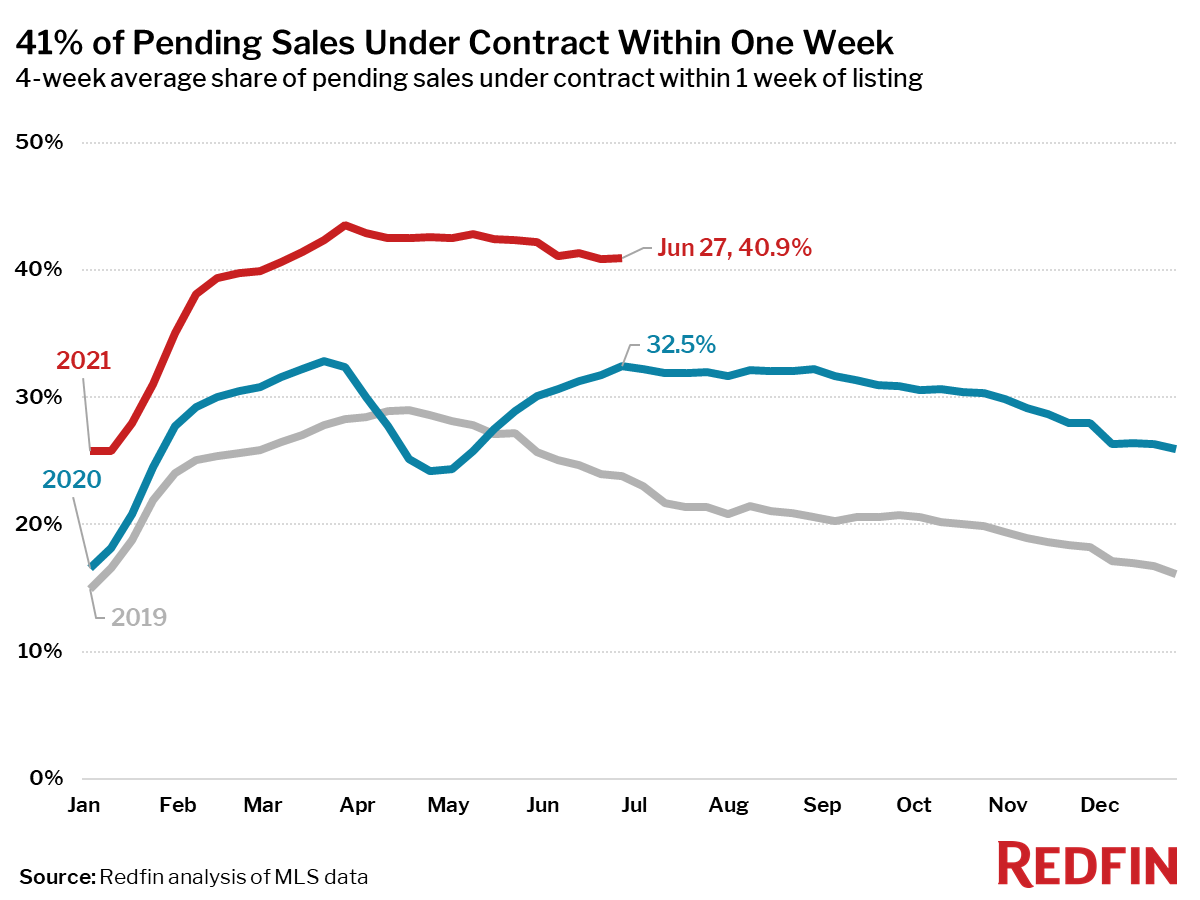
- 41% of homes that went under contract had an accepted offer within one week of hitting the market, up from 32% during the same period a year earlier, but down 2.6 percentage points from the high point of the year, set during the four-week period ending March 28.
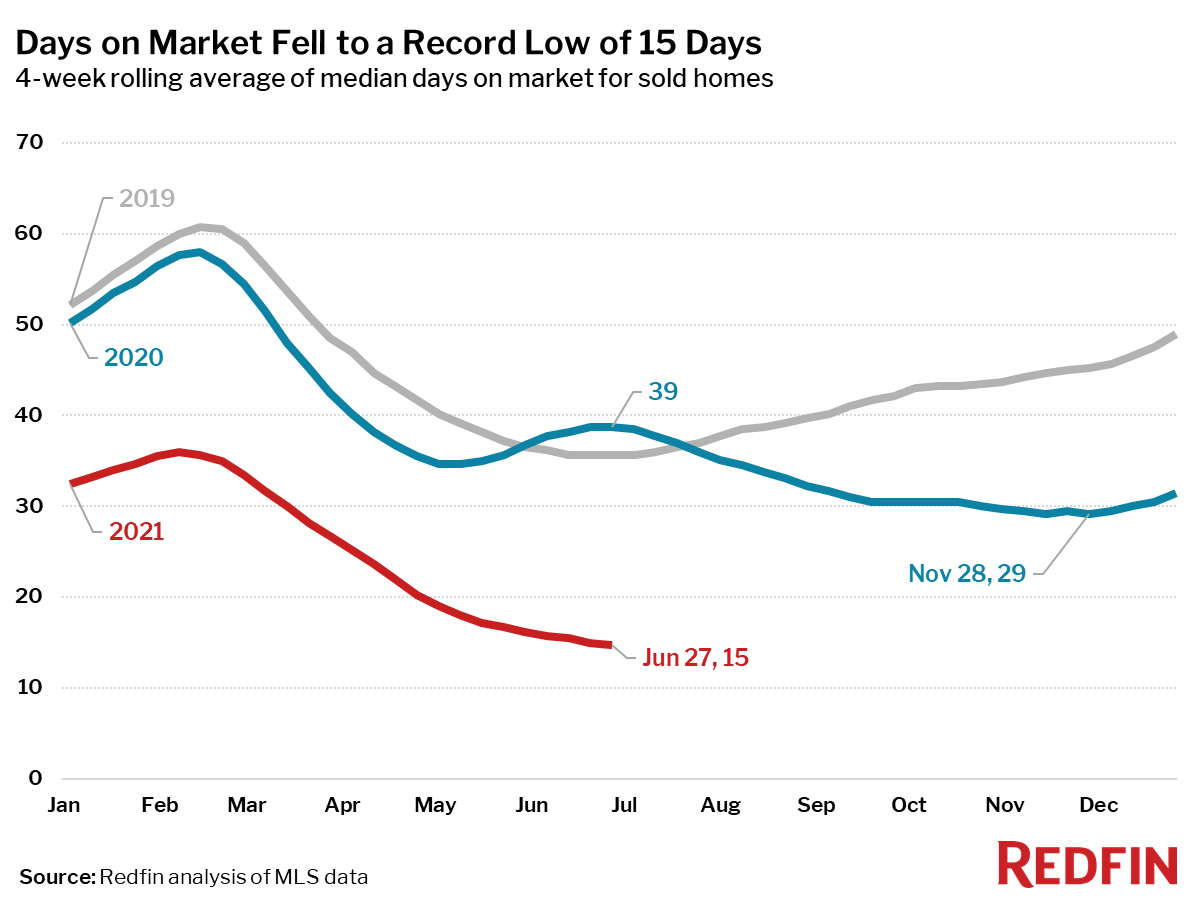
- Homes that sold were on the market for a median of 15 days, a new all-time low and down from 39 days a year earlier.
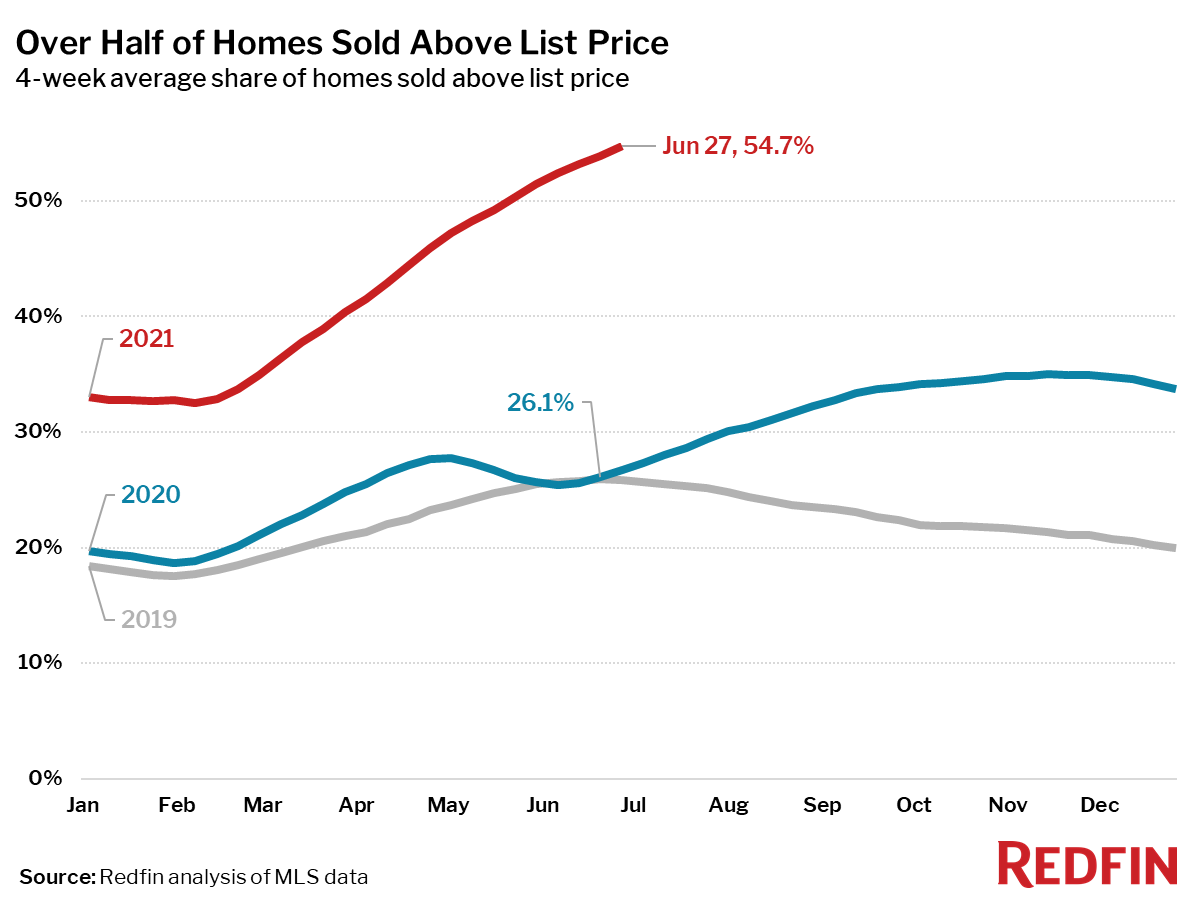
- A record 55% of homes sold above list price, up from 26% a year earlier.
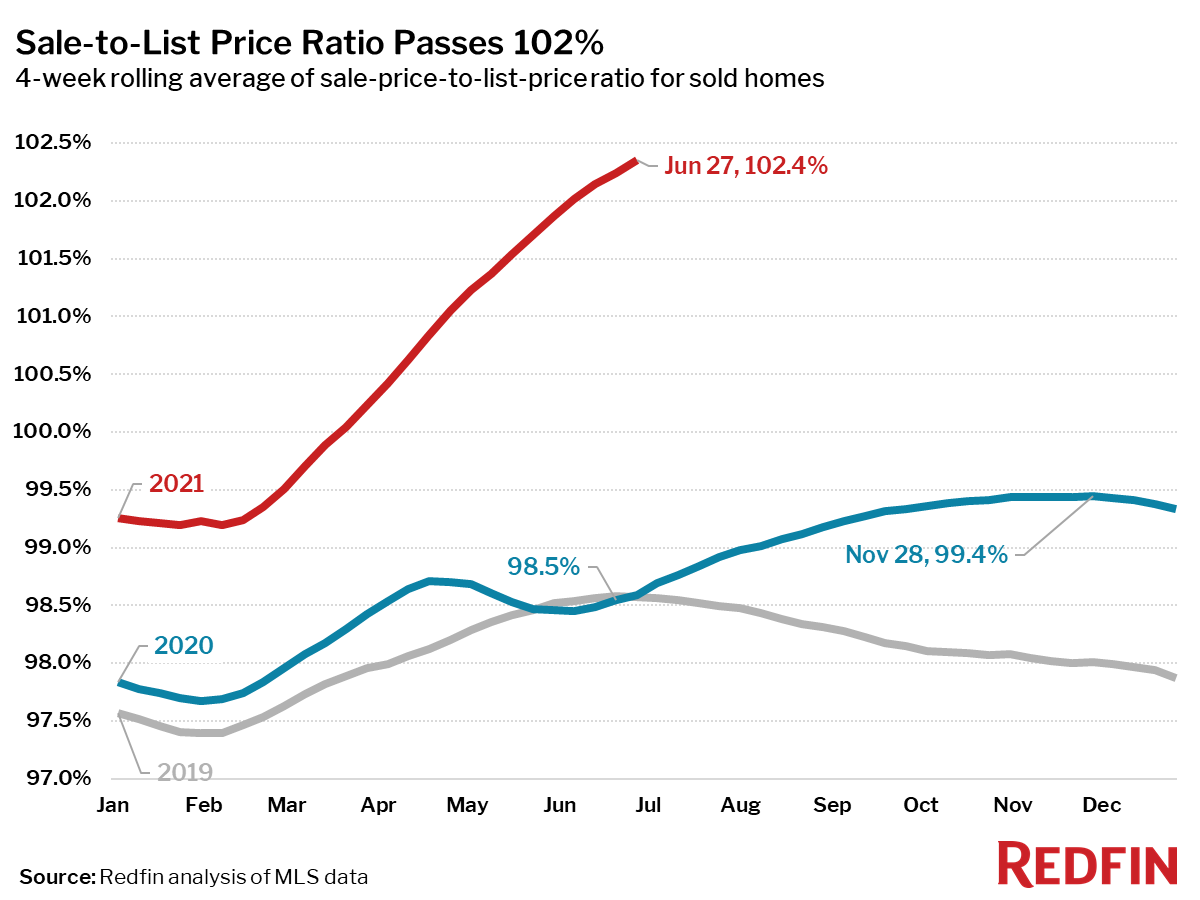
- The average sale-to-list price ratio, which measures how close homes are selling to their asking prices, increased to 102.4%. In other words, the average home sold for 2.4% above its asking price. This measure is an all-time high and 3.8 percentage points higher than a year earlier.
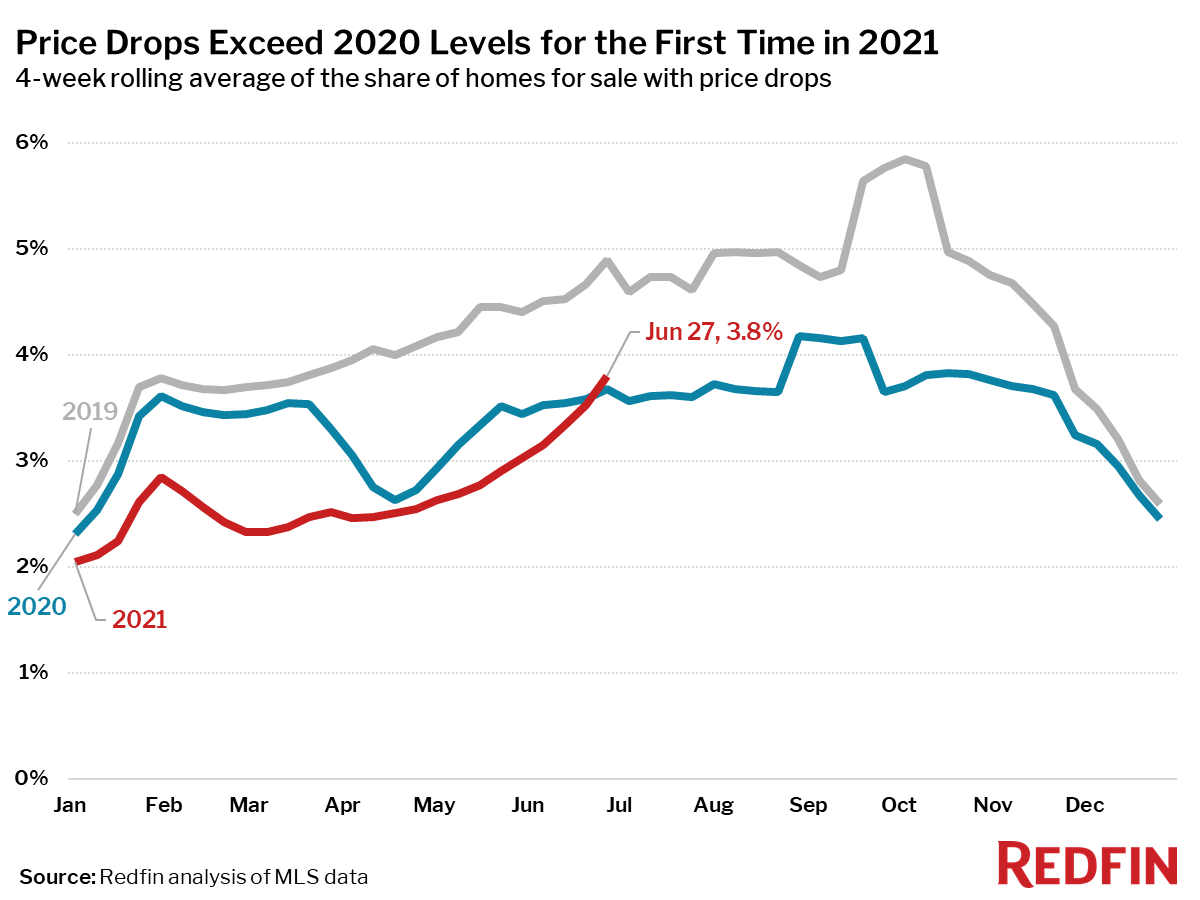
- The share of homes for sale with price drops rose to 3.8%, surpassing 2020 levels for the first time this year. A few large markets–New York, Washington, D.C., and Chicago drove this trend, posting the most sizeable increases in their price-drop rates.
Other other leading indicators of homebuying activity:
- Mortgage purchase applications decreased 5% week over week (seasonally adjusted) during the week ending June 25. For the week ending July 1 30-year mortgage rates fell back below 3% to 2.98%.
- From January 1 to June 27, home tours went up 26%, compared to a 47% increase over the same period last year according to home tour technology company ShowingTime.
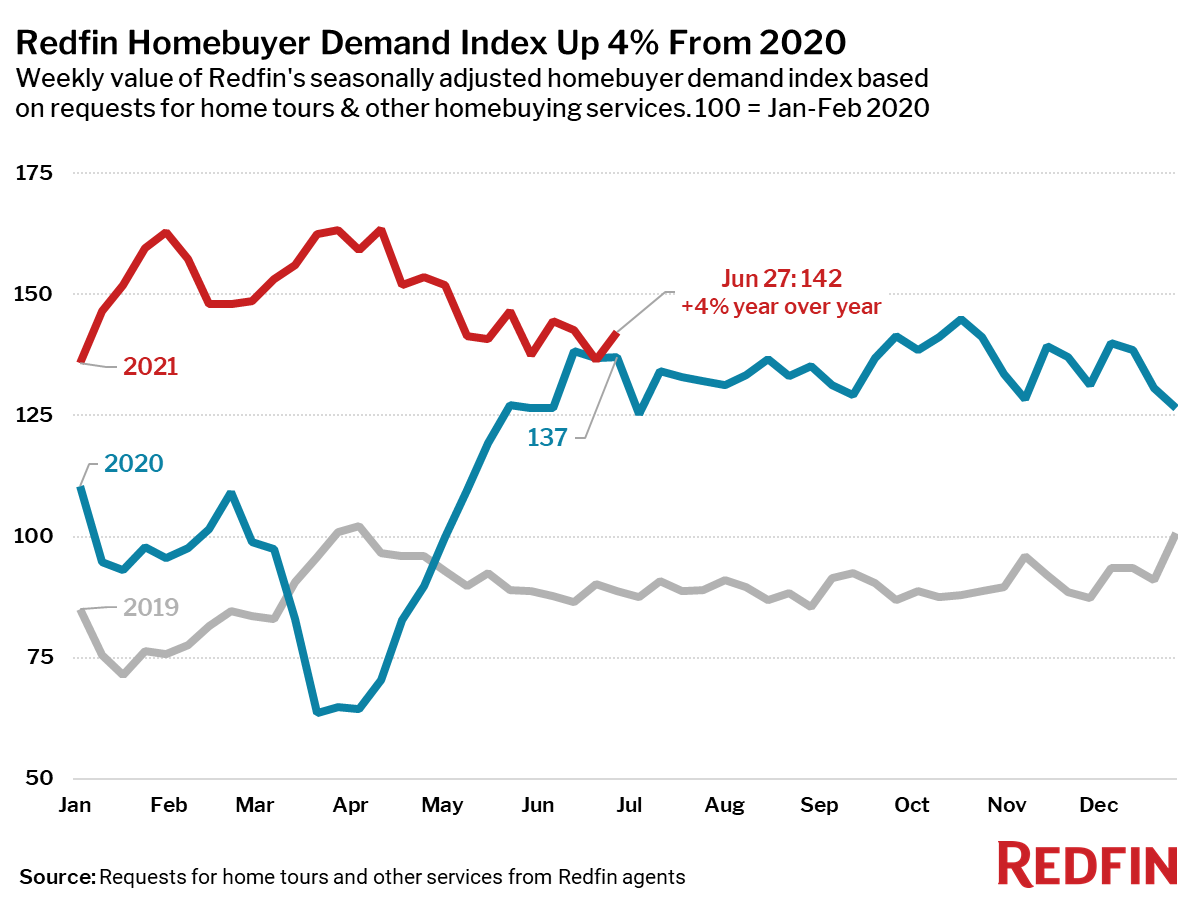
- The seasonally adjusted Redfin Homebuyer Demand Index—a measure of requests for home tours and other services from Redfin agents—ticked up slightly during the week ending June 27, and is up 4% from a year earlier.
Refer to our metrics definition page for explanations of all the metrics used in this report.