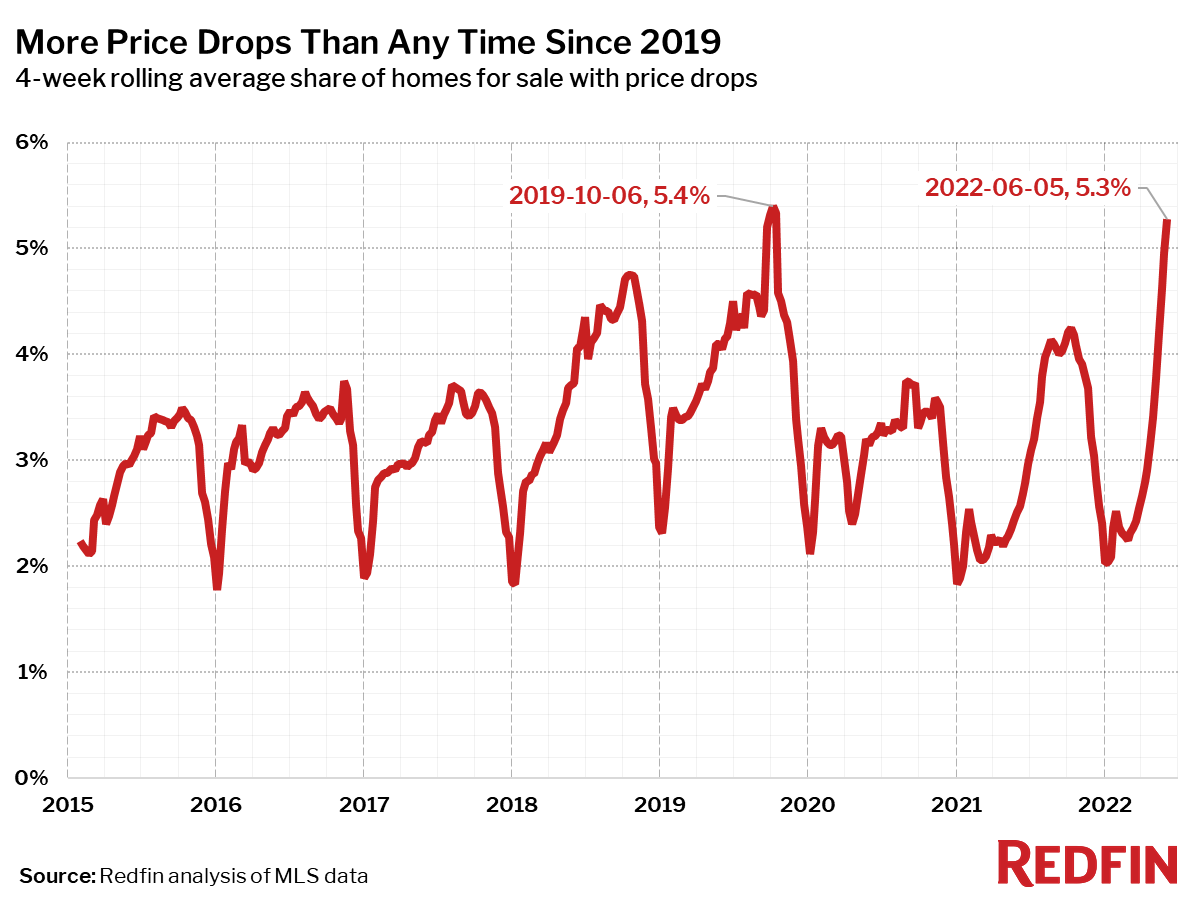
Inventory climbs as buyers back off. More sellers are dropping their price in response. The share of listings with a price reduction is approaching a record high.
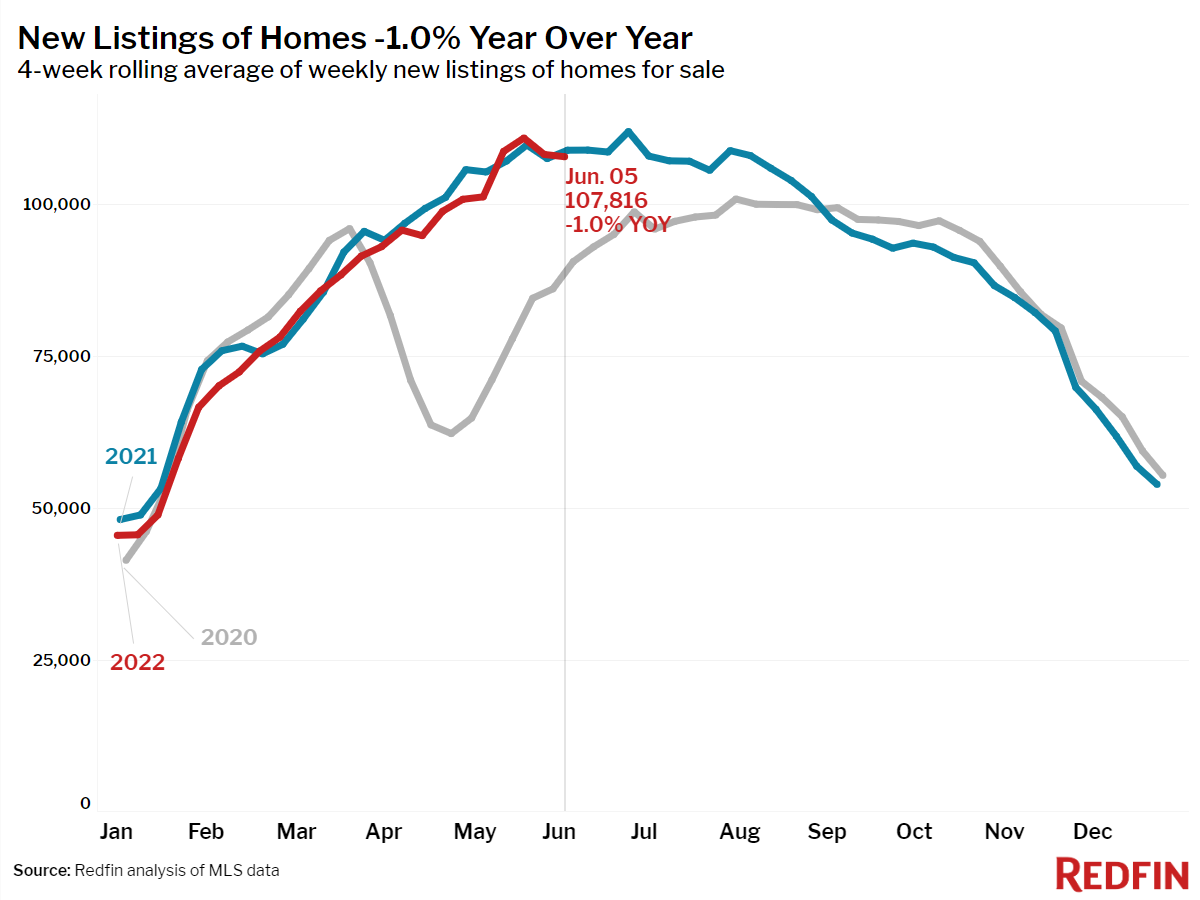
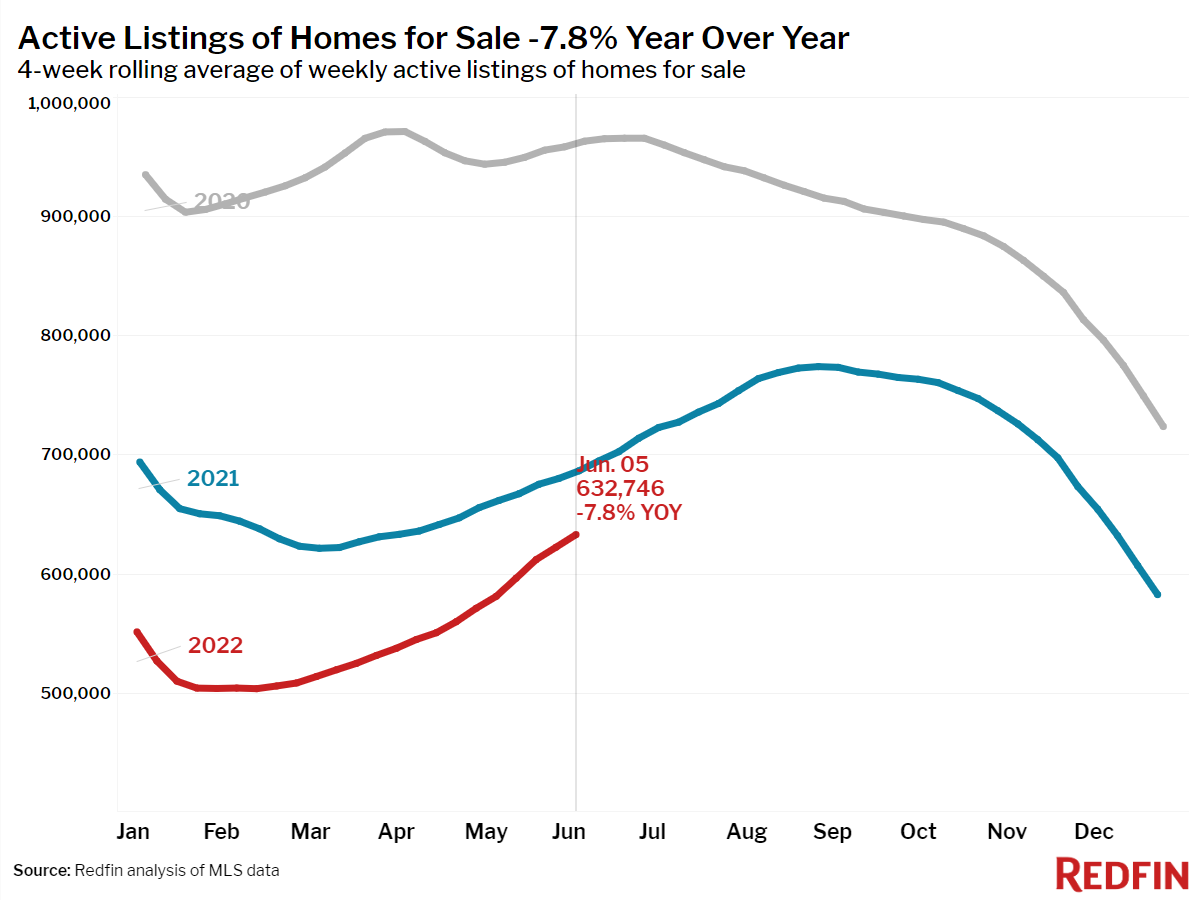
The number of homes for sale fell 8% during the four weeks ending June 5, the smallest year-over-year decline since January 2020. This was more a reflection of declining homebuyer demand than of more homes being listed for sale. Tours, offers and other requests for help with homebuying, as measured by the Redfin Homebuyer Demand Index, fell 12% last week, and new listings fell 2% during the four-week period, while 21% of sellers dropped their list price, the second-highest share on record, going back through 2015.
“Sellers are losing control of the housing market as homes that are overpriced and/or less desirable are increasingly having price reductions and taking longer to sell,” said Redfin deputy chief economist Taylor Marr. “Although demand is easing, some homebuyers may jump back into the market when price growth loses steam and interest rates continue to stabilize. A strong labor market will continue to be a driving force for the bulk homebuying demand this year.“
Leading indicators of homebuying activity:
- Fewer people searched for “homes for sale” on Google—searches during the week ending June 4 were down 10% from a year earlier.
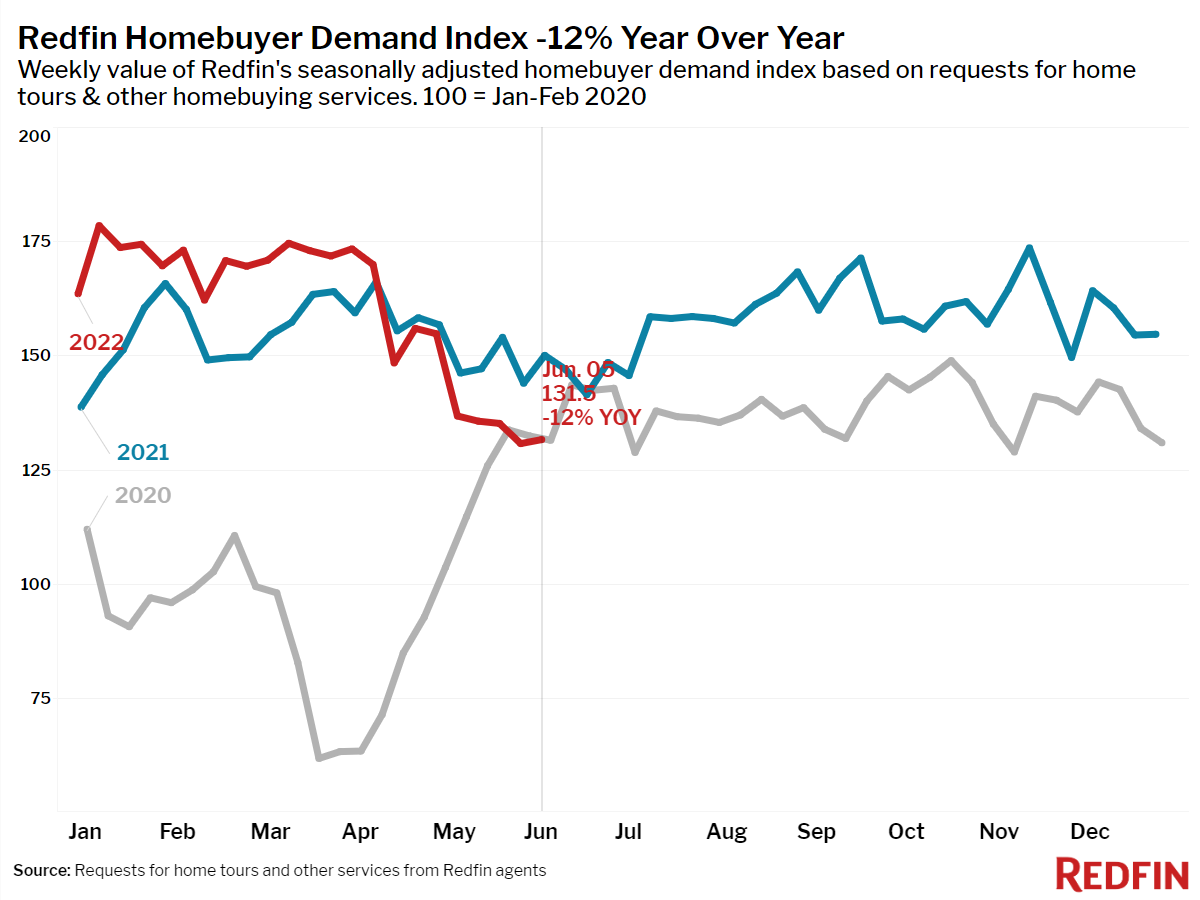
- The seasonally-adjusted Redfin Homebuyer Demand Index—a measure of requests for home tours and other home-buying services from Redfin agents—was down 12% year over year during the week ending June 5. This was the eighth consecutive week of declines in the index.
- Touring activity as of June 5 was only 0.1% above the start of the year compared to 25.1% at this time last year, according to home tour technology company ShowingTime.
- Mortgage purchase applications were down 21% from a year earlier, while the seasonally-adjusted index was down 7% week over week during the week ending June 3.
- For the week ending June 9, 30-year mortgage rates rose to 5.23%.
Key housing market takeaways for 400+ U.S. metro areas:
Unless otherwise noted, the data in this report covers the four-week period ending June 5. Redfin’s housing market data goes back through 2012.
Data based on homes listed and/or sold during the period:
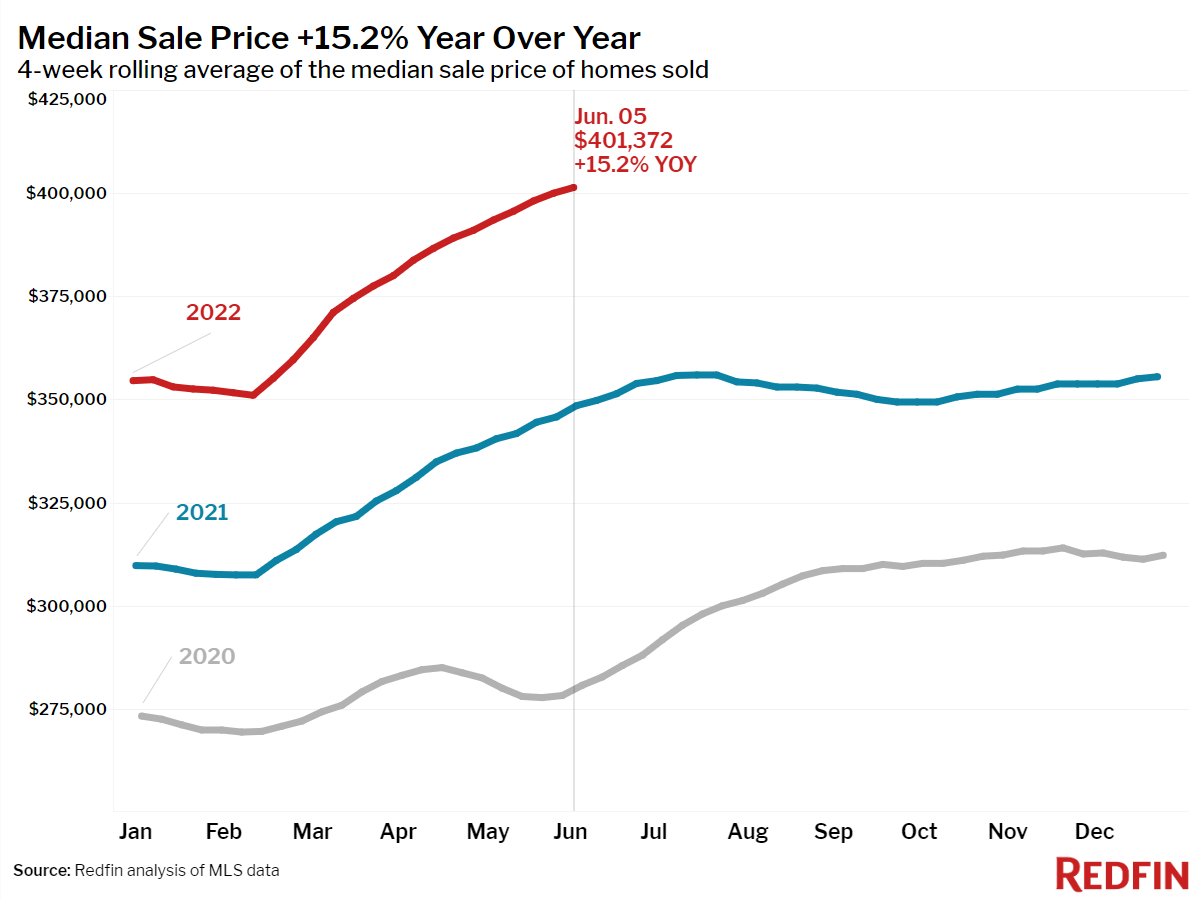
- The median home sale price was up 15% year over year to a record $401,372.
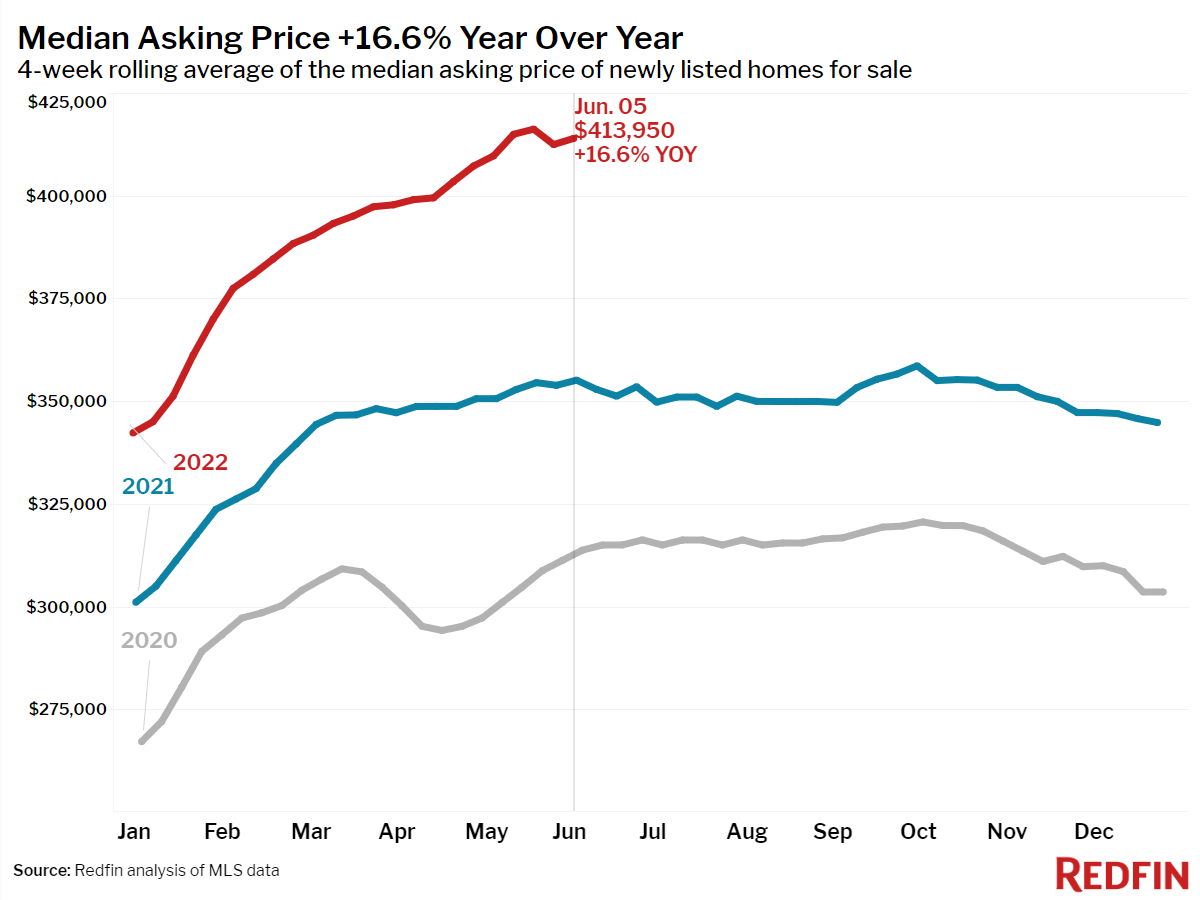
- The median asking price of newly listed homes increased 17% year over year to $413,950.
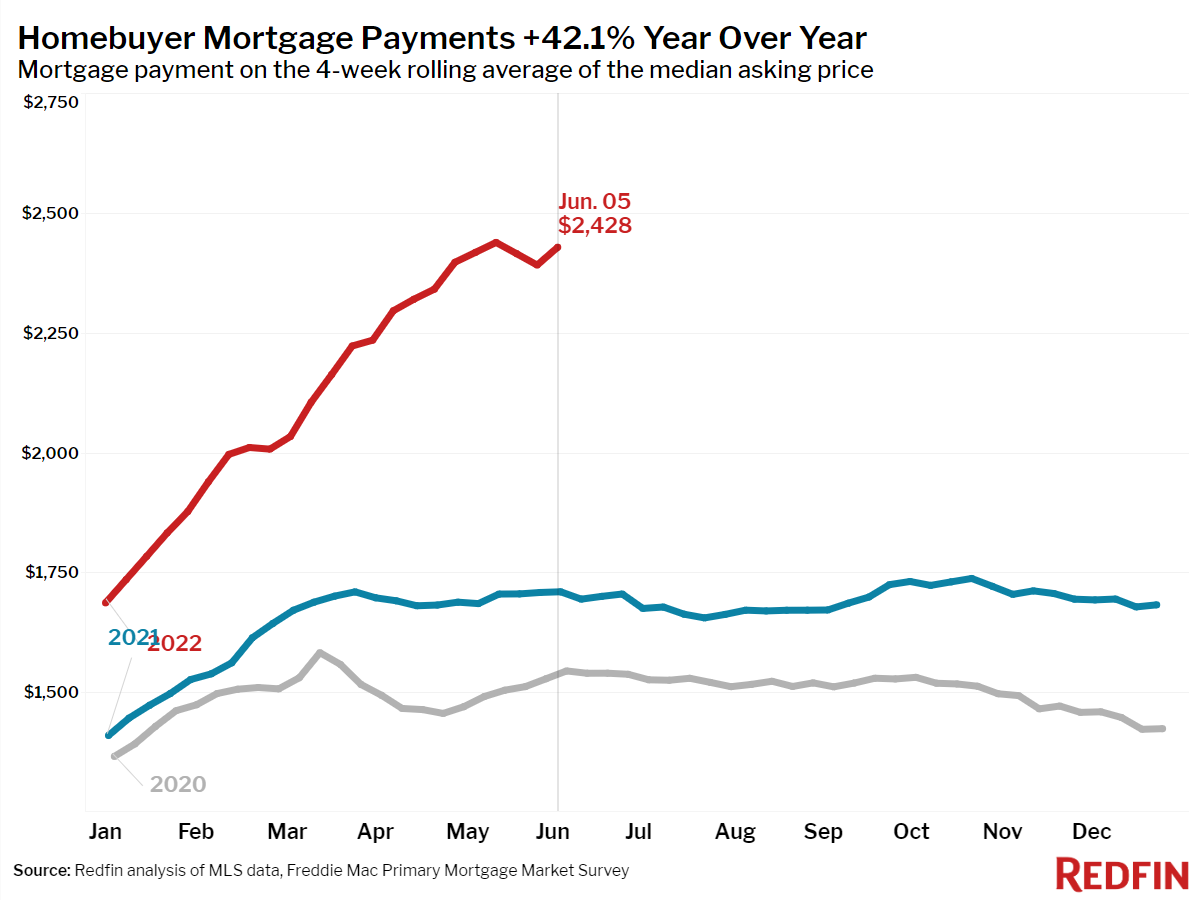
- The monthly mortgage payment on the median asking price home increased to $2,428 at the current 5.23% mortgage rate. This was up 42% from $1,710 a year earlier, when mortgage rates were 2.96%.
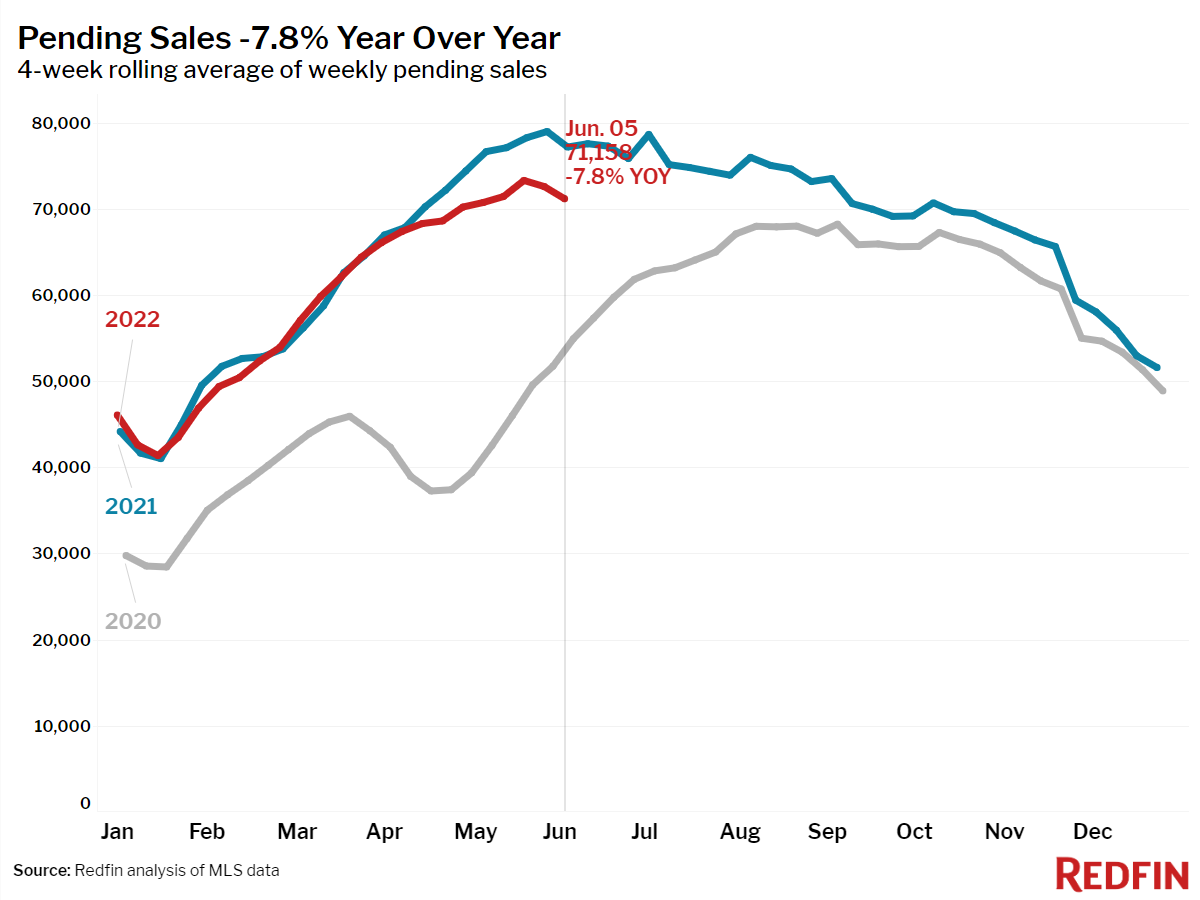
- Pending home sales were down 8% year over year, on par with the decrease seen in May 2020.
- New listings of homes for sale were down 1% a year earlier.
- Active listings (the number of homes listed for sale at any point during the period) fell 8% year over year—the smallest decline since January 2020.
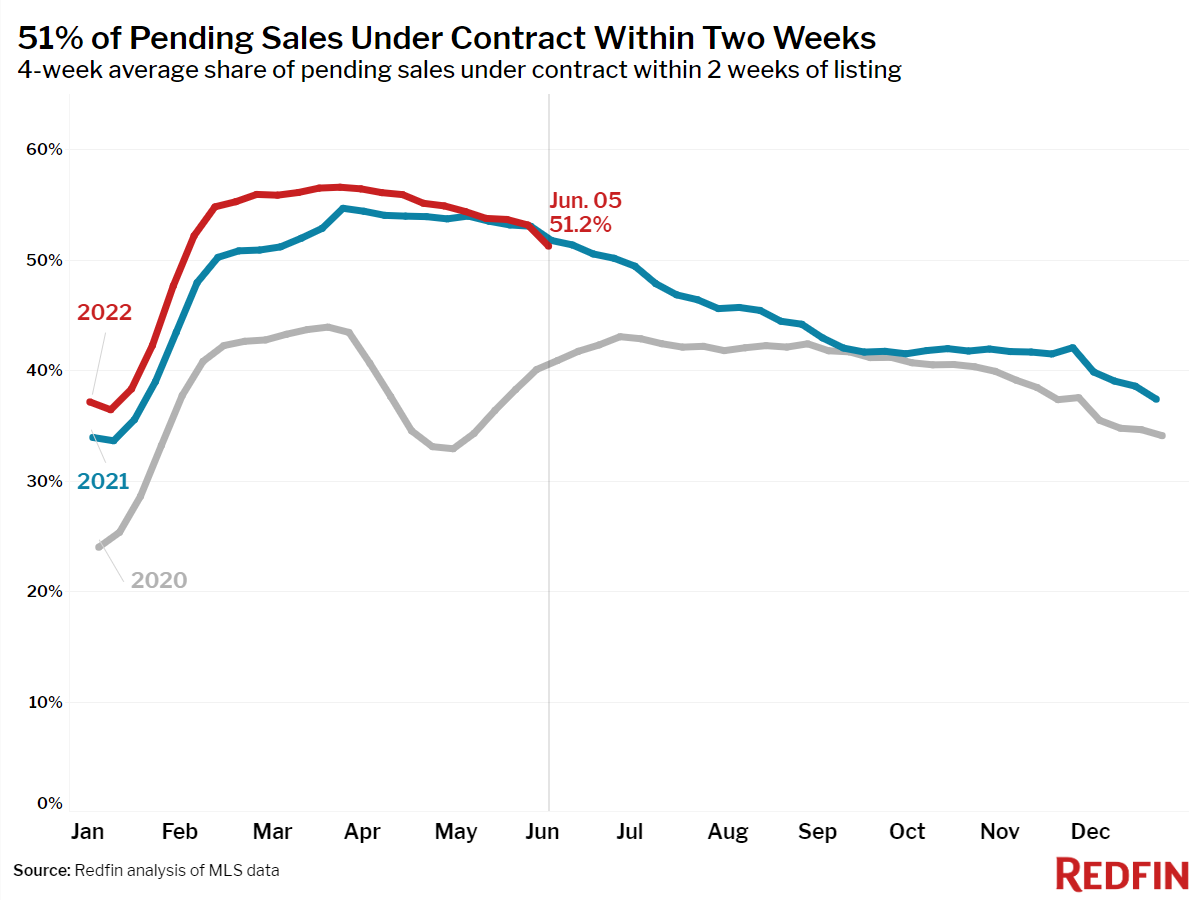
- 51% of homes that went under contract had an accepted offer within the first two weeks on the market, flat from a year earlier.
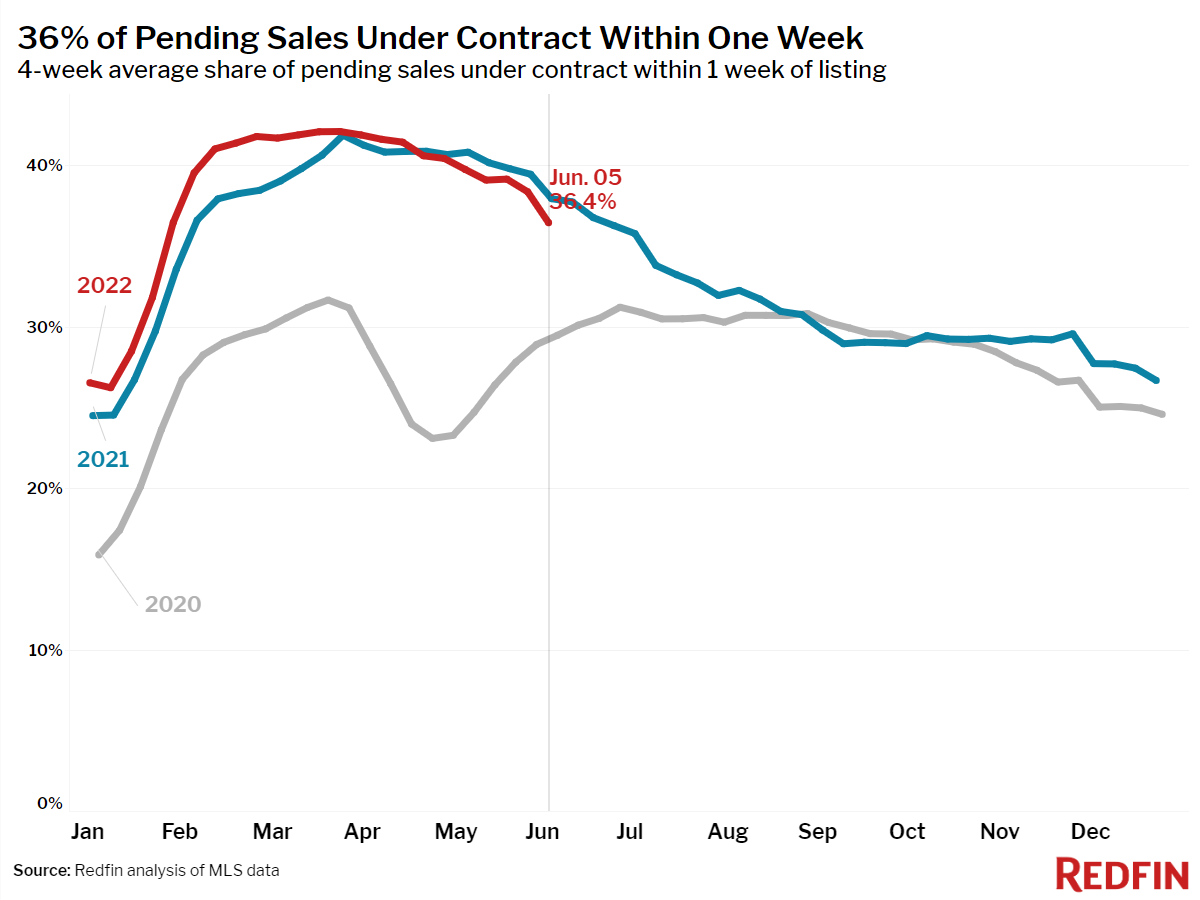
- 36% of homes that went under contract had an accepted offer within one week of hitting the market, down from 38% a year earlier.
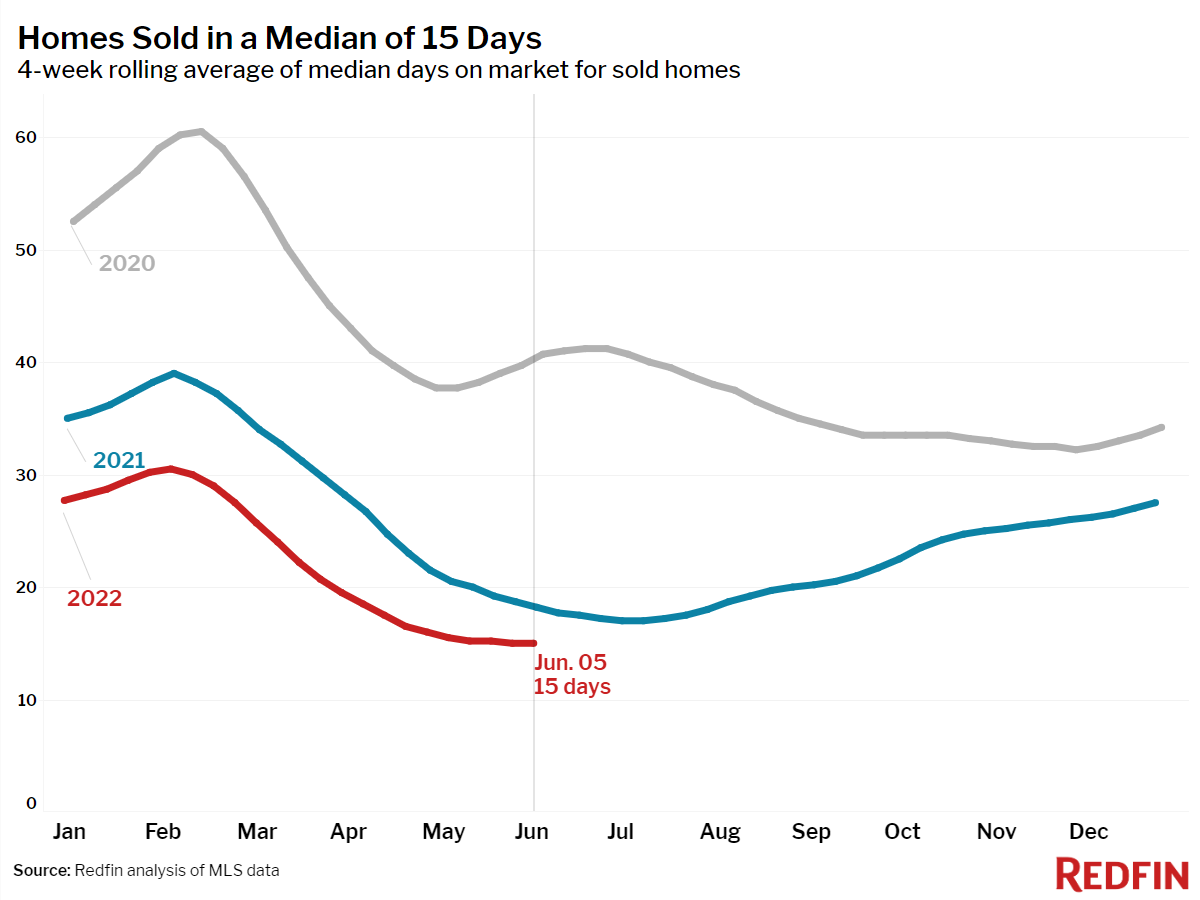
- Homes that sold were on the market for a record-low median of 15 days, down from 18 days a year earlier.
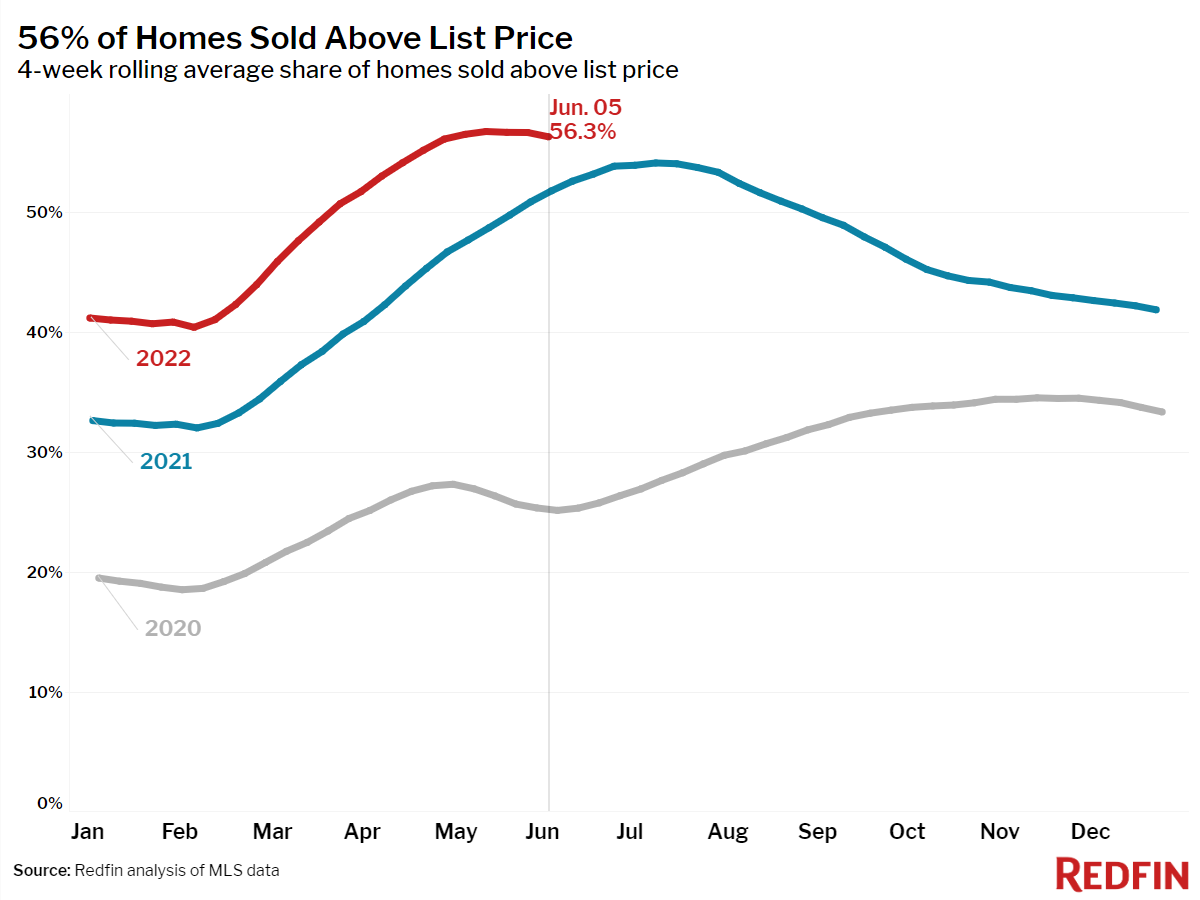
- 56% of homes sold above list price, up from 52% a year earlier.
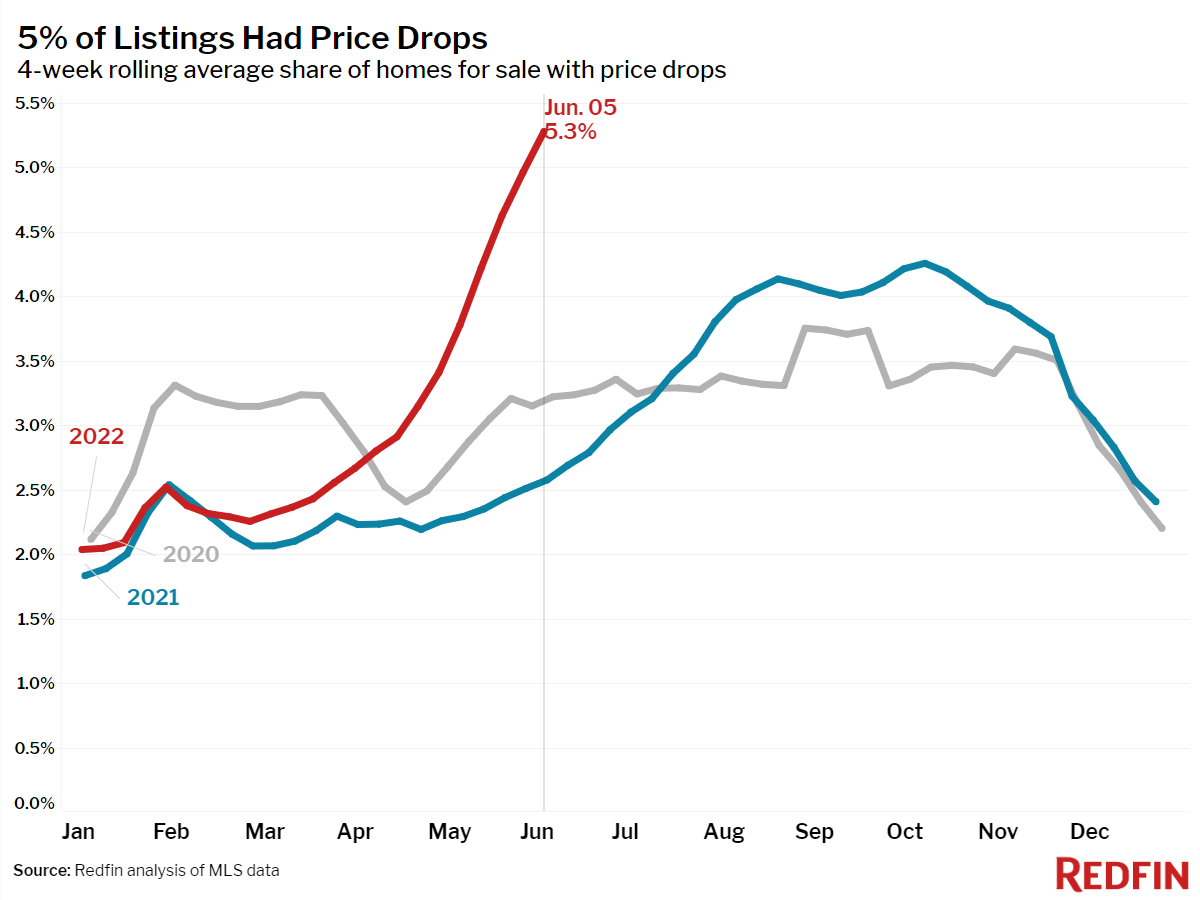
- On average, 5.3% of homes for sale each week had a price drop. Overall, 21.2% dropped their price in the past four weeks, up from 15.2% a month earlier and 10.3% a year ago. This was the highest share since October 2019.
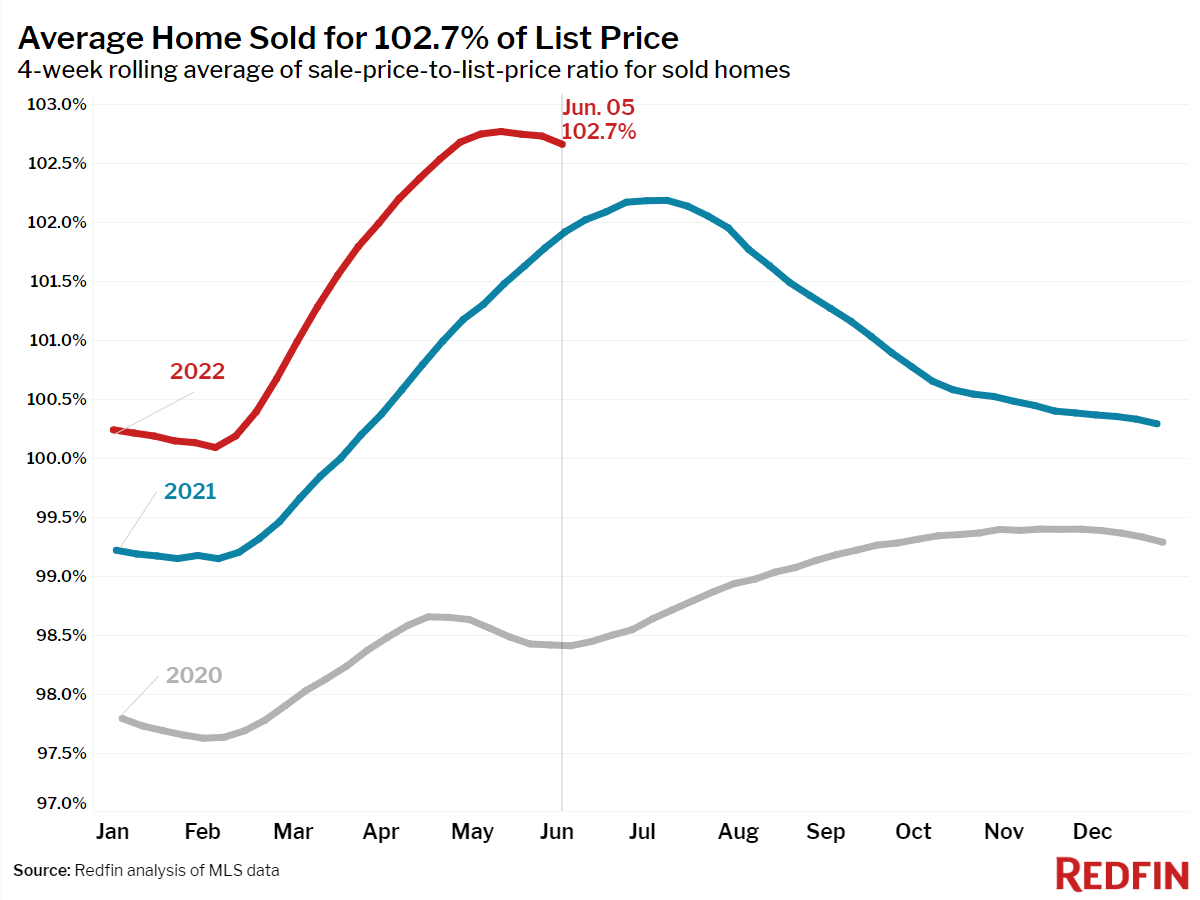
- The average sale-to-list price ratio, which measures how close homes are selling to their asking prices, declined just slightly to 102.7%. In other words, the average home sold for 2.7% above its asking price. This was up from 101.9% a year earlier.
Refer to our metrics definition page for explanations of all the metrics used in this report.