A dip in new listings contributed to the ongoing supply shortage as home prices hit another all-time high.
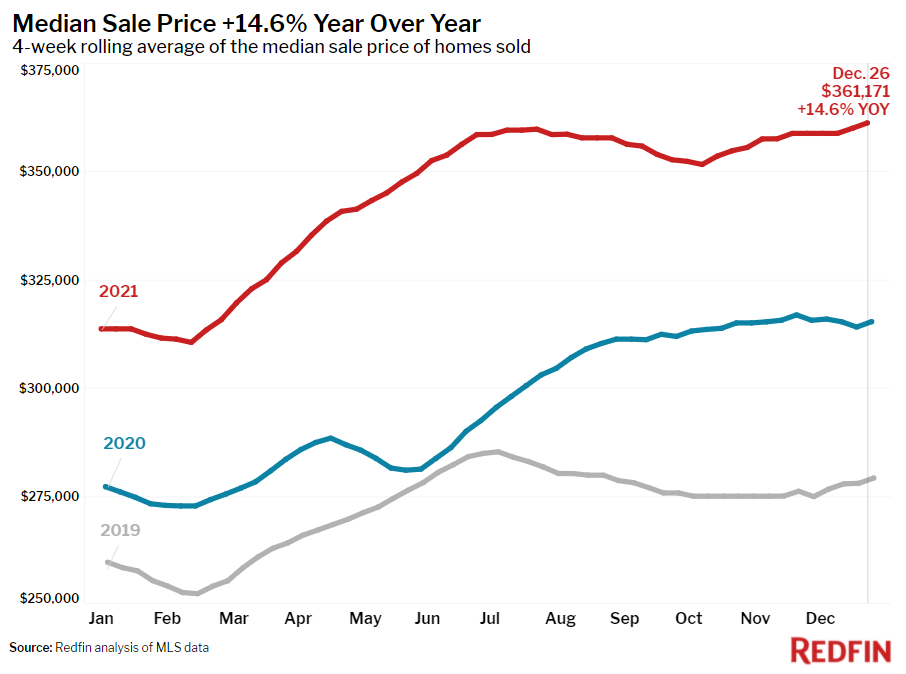
The median home sale price rose 14.6% year over year to a new all-time high of $361,171 during the four-week period ending December 26 as the number of homes for sale fell to a record low. New listings and pending sales both dropped to their lowest levels since January and touring activity was down compared with the same period in 2019 and 2020.
“The holiday effect of homebuyers and sellers diverting their time and attention toward travel and celebrations was even more extreme than during the pre-pandemic Christmas week of 2019,” said Redfin Deputy Chief Economist Taylor Marr. “We see this slowdown as a temporary consequence of the holidays, and not as an indication that homebuyer demand is backing off. Those who did purchase homes over the holidays paid high prices due to the ongoing supply shortage.”
Key housing market takeaways for 400+ U.S. metro areas:
Unless otherwise noted, the data in this report covers the four-week period ending December 26. Redfin’s housing market data goes back through 2012. Comparing today’s market with the pre-pandemic fall market of 2019 highlights how hot the market remains, even as most measures are settling into typical seasonal patterns.
Data based on homes listed and/or sold during the period:
- The median home-sale price increased 14.6% year over year to an all-time high of $361,171, up 29.4% from the same period in 2019.
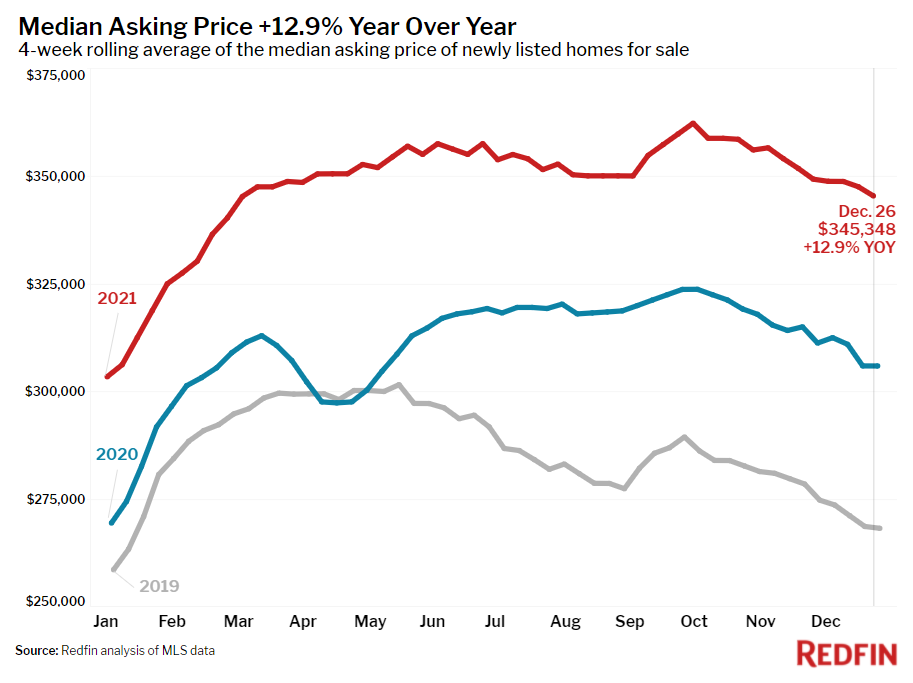
- The median asking price of newly listed homes increased 12.9% year over year to $345,348, up 28.7% from 2019.
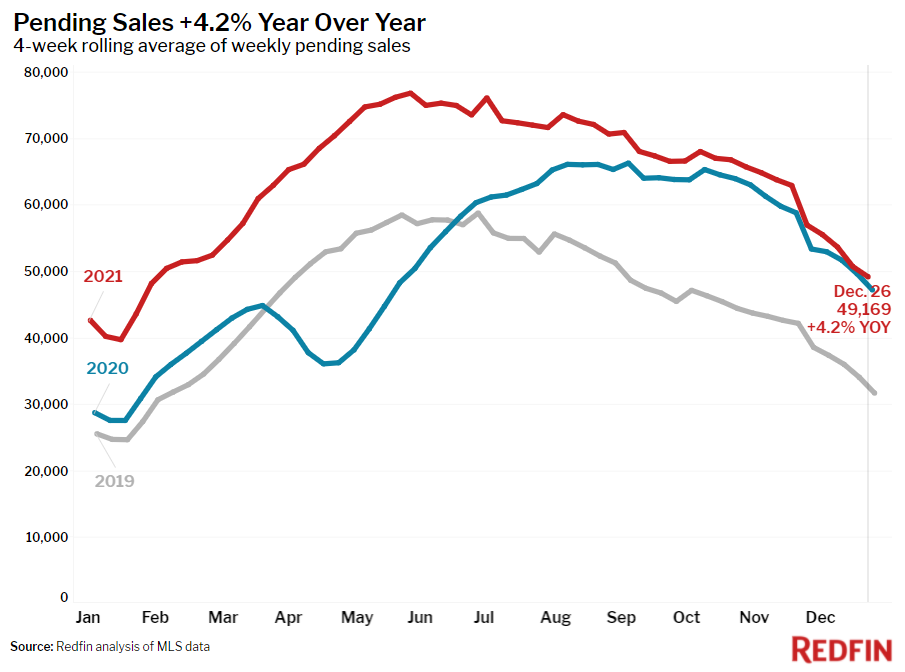
- Pending home sales were up 4.2% year over year, and up 55.2% compared to the same period in 2019.
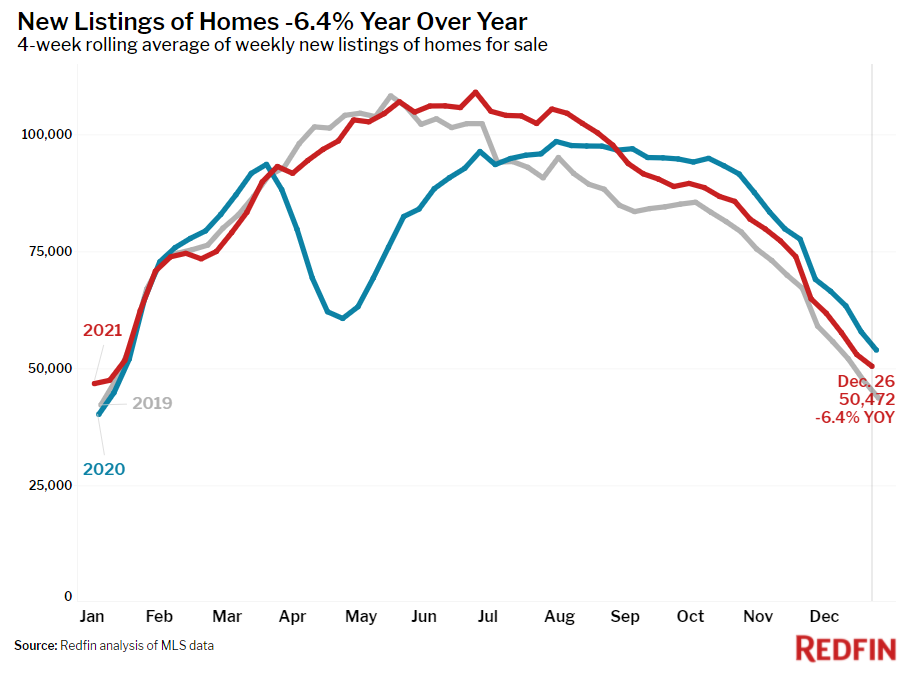
- New listings of homes for sale were down 6.4% from a year earlier, but up 15.6% from 2019.
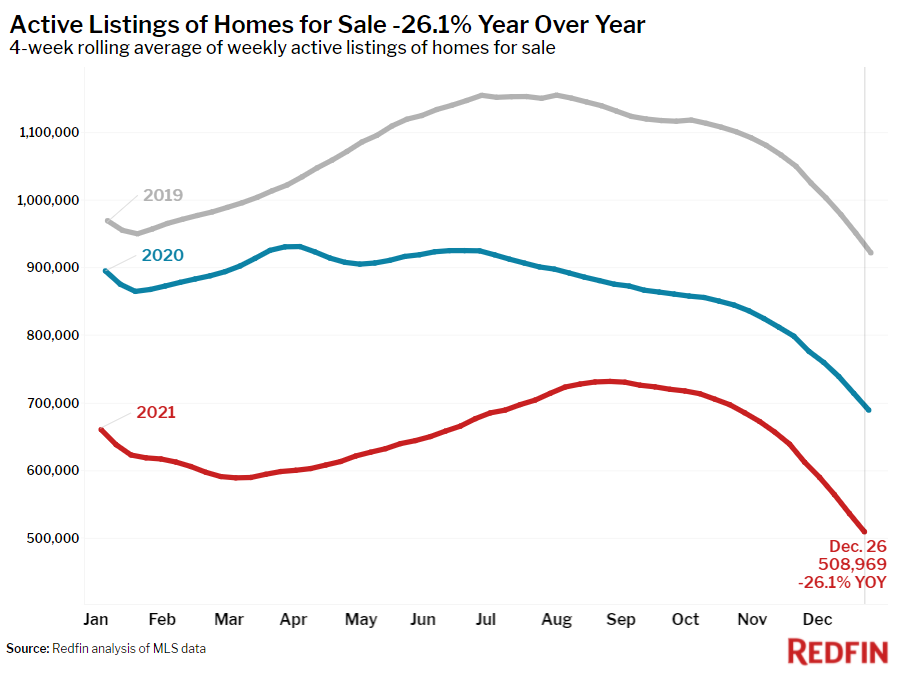
- Active listings (the number of homes listed for sale at any point during the period) fell 26.1% year over year to an all-time low, and were down 44.8% from 2019.
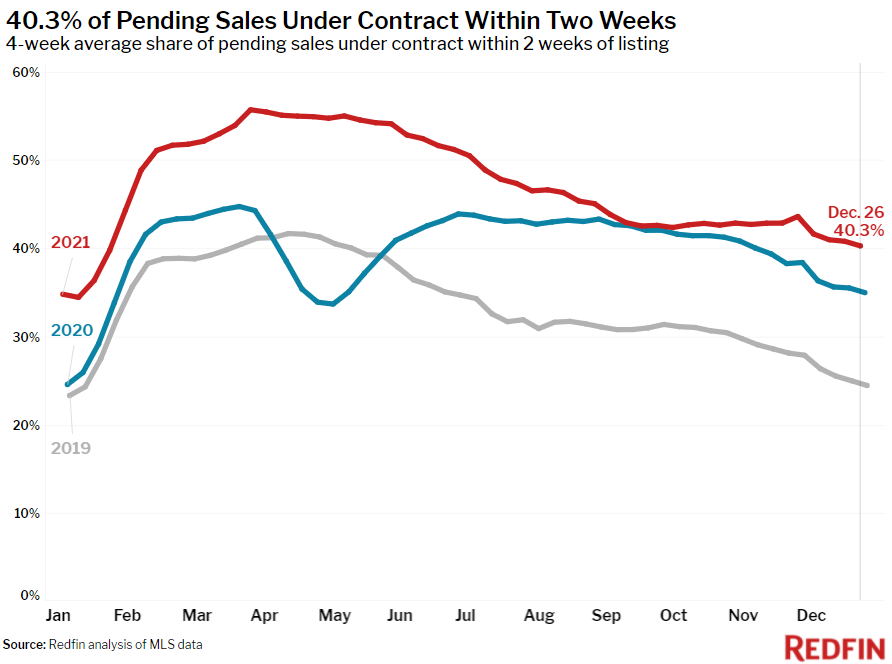
- The share of homes that went under contract that had an accepted offer within the first two weeks on the market was 40.3%, above the 35% rate of a year earlier and the 24.5% rate in 2019.
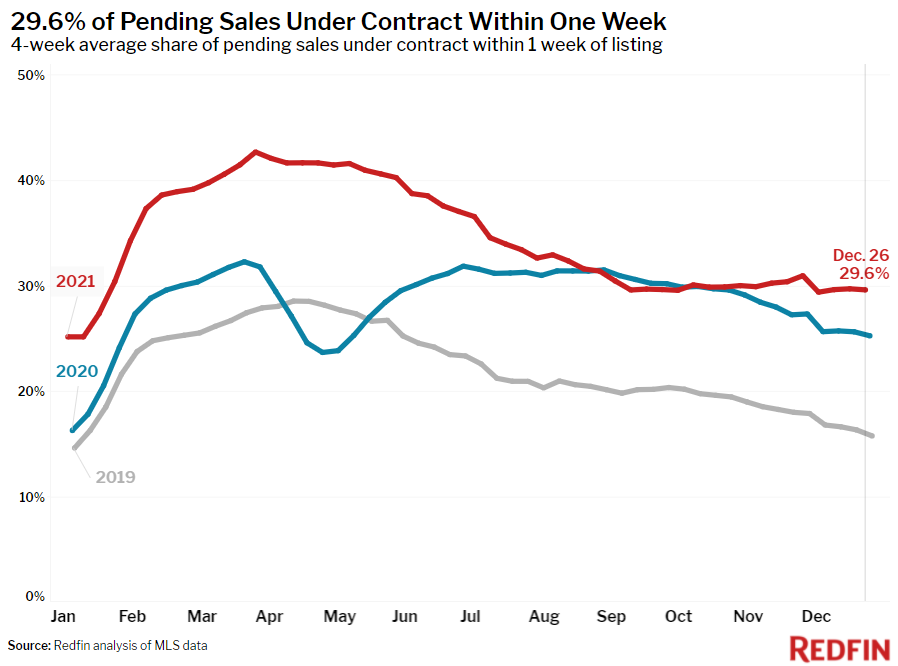
- 29.6% of homes that went under contract had an accepted offer within one week of hitting the market, up from 25.3% during the same period a year earlier and 15.8% in 2019.
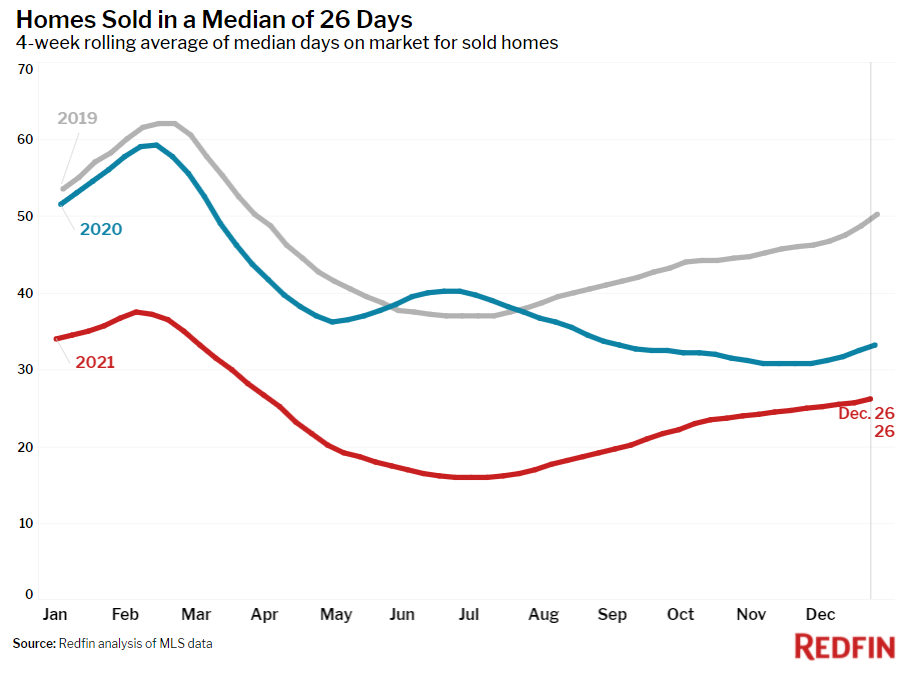
- Homes that sold were on the market for a median of 26 days, down from 33 days a year earlier and 50 days in 2019.
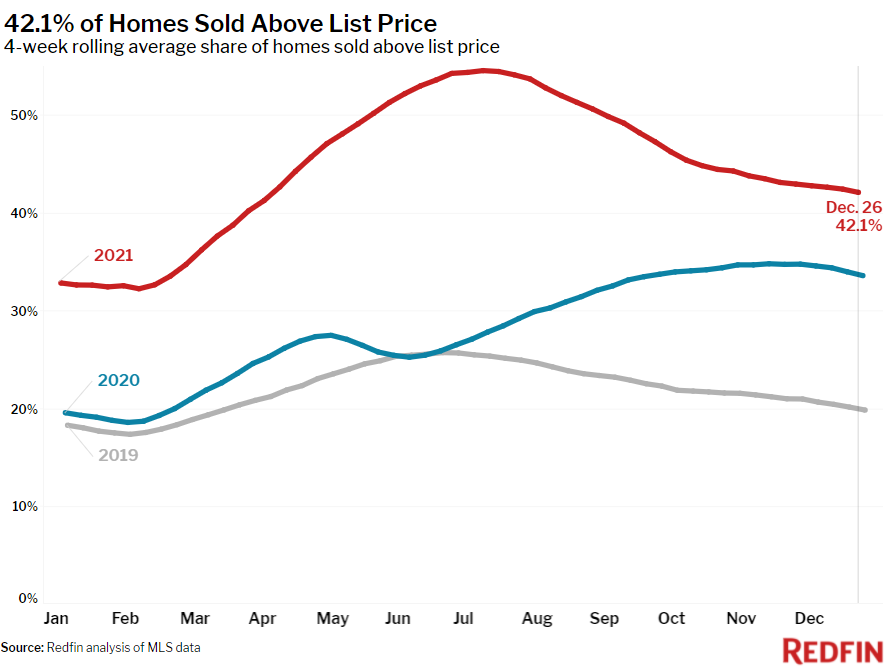
- 42.1% of homes sold above list price, up from 33.6% a year earlier and 19.9% in 2019.
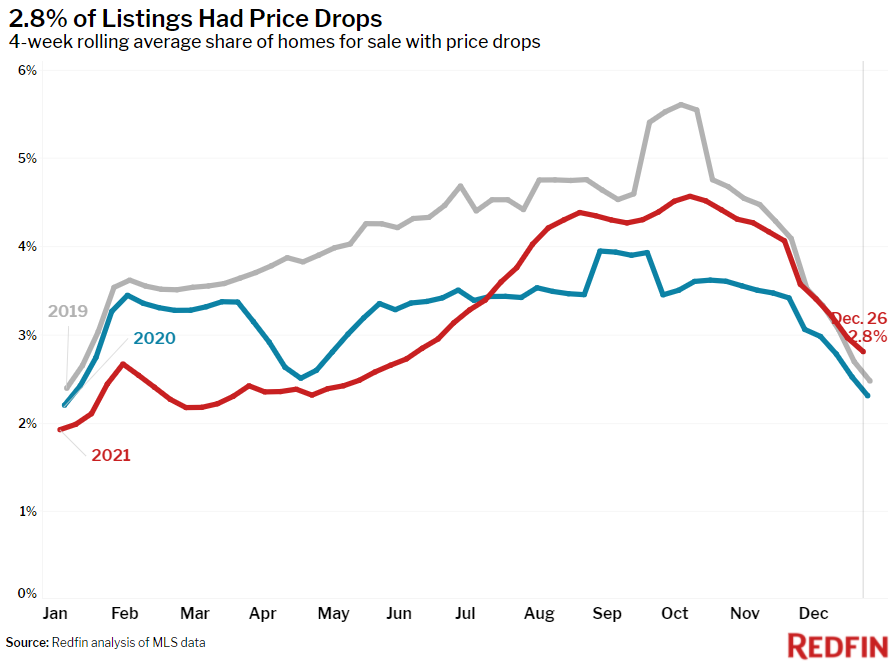
- On average, 2.8% of homes for sale each week had a price drop, up 0.5 percentage points from the same time in 2020 and up 0.3 points from this time in 2019.
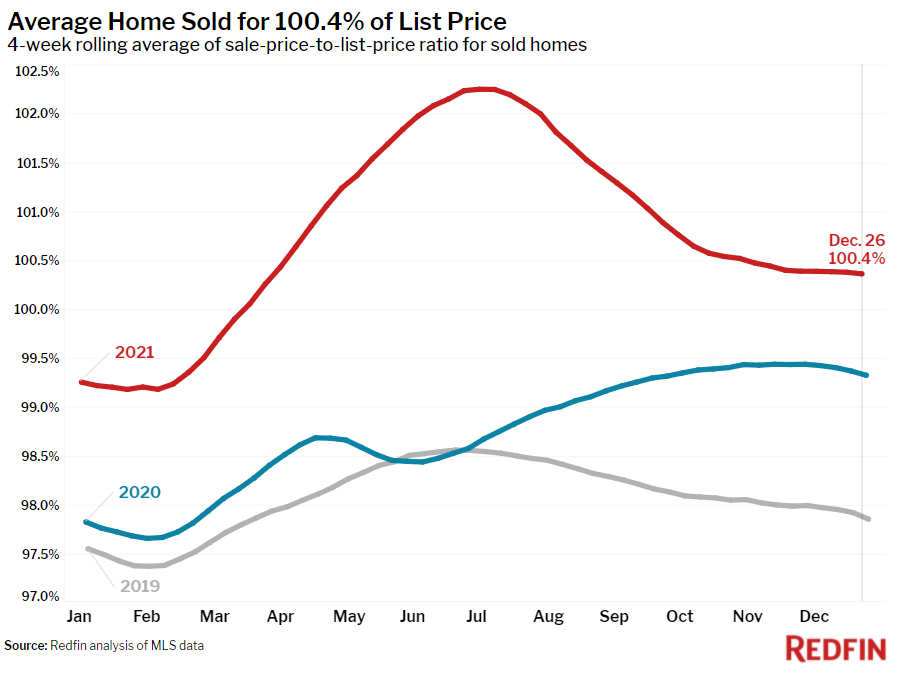
- The average sale-to-list price ratio, which measures how close homes are selling to their asking prices, was 100.4%. In other words, the average home sold for 0.4% above its asking price.
Other leading indicators of homebuying activity:
- Mortgage purchase applications decreased 3% week over week (seasonally adjusted) during the week ending December 23. For the week ending December 23, 30-year mortgage rates declined to 3.05%. Mortgage data is from the week ending December 23 because data sources did not update over the holiday week.
- Touring activity through December 26 was 8.7 percentage points behind 2019 and 8.5 points behind 2020 relative to the first week of January according to home tour technology company ShowingTime.
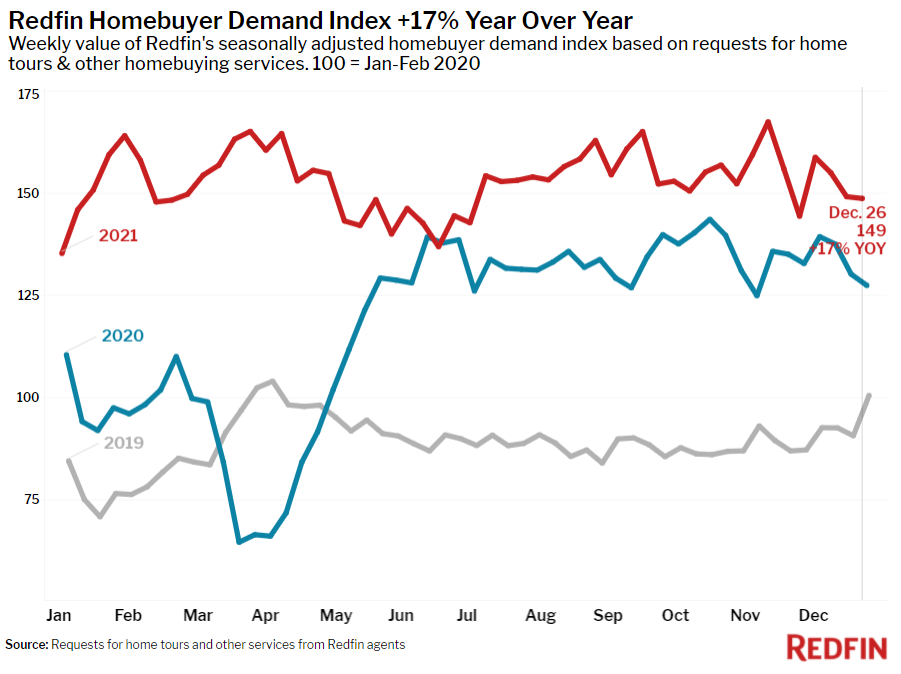
- The Redfin Homebuyer Demand Index was up 17% from a year earlier. The seasonally adjusted Redfin Homebuyer Demand Index is a measure of requests for home tours and other homebuying services from Redfin agents.
Refer to our metrics definition page for explanations of all the metrics used in this report.