
- Surging borrowing costs and home prices prompted real estate investors to pump the brakes in the first quarter. Many are hoping prices will drop so they can get better deals.
- Still, investors bought a record 20% of homes sold in metros tracked by Redfin as a slowdown in homebuying nationwide allowed them to continue growing their market share.
- Investor purchases of high- and mid-priced homes declined, but purchases of low-priced homes increased.
- Investor purchases of single-family homes dropped more than purchases of condos, townhomes and multifamily units, but single-family housing remains the most popular property type among investors.
- The 10 U.S. markets where investors had the largest market share, including Atlanta and Phoenix, all saw investor purchases decline.
Real estate investors bought 77,829 homes in the metros tracked by Redfin in the first quarter, down 11.5% from the fourth quarter of 2021 and 16.5% from the third quarter of 2021, when investor purchases hit a record high. On a year-over-year basis, investor purchases were up 30.7%—the smallest annual gain in a year.
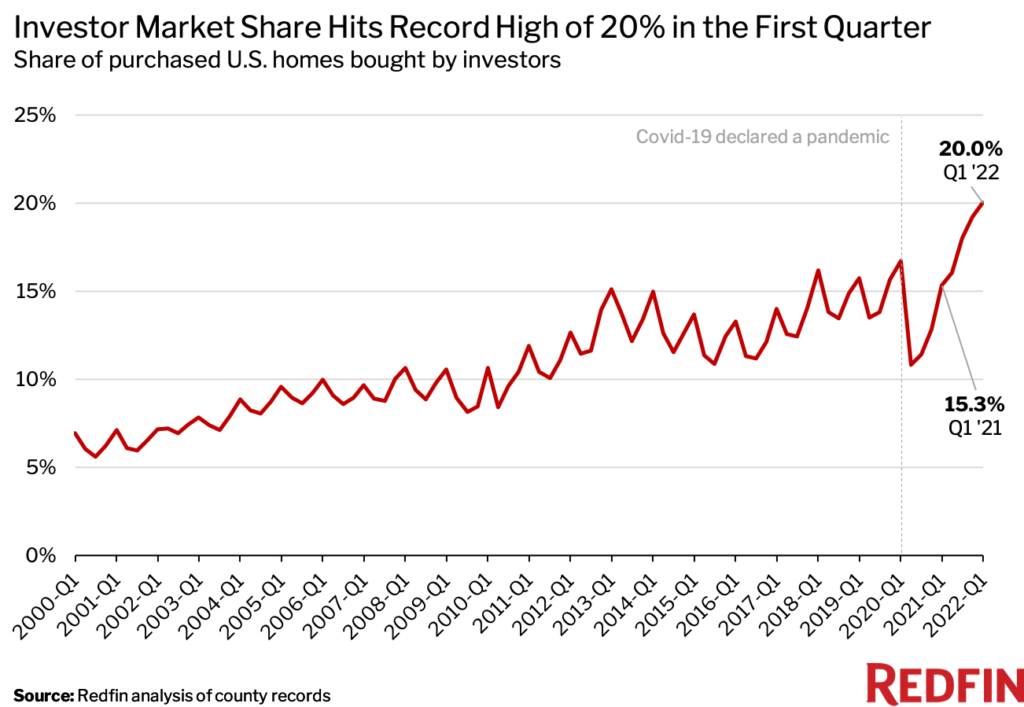
Still, investors bought up a larger share of America’s homes than ever before. They purchased a record 20% of homes that sold in the first quarter, up from 19.2% one quarter earlier and 15.3% one year earlier. A decrease in overall home purchases nationwide allowed investors to increase their market share even while purchasing fewer homes. 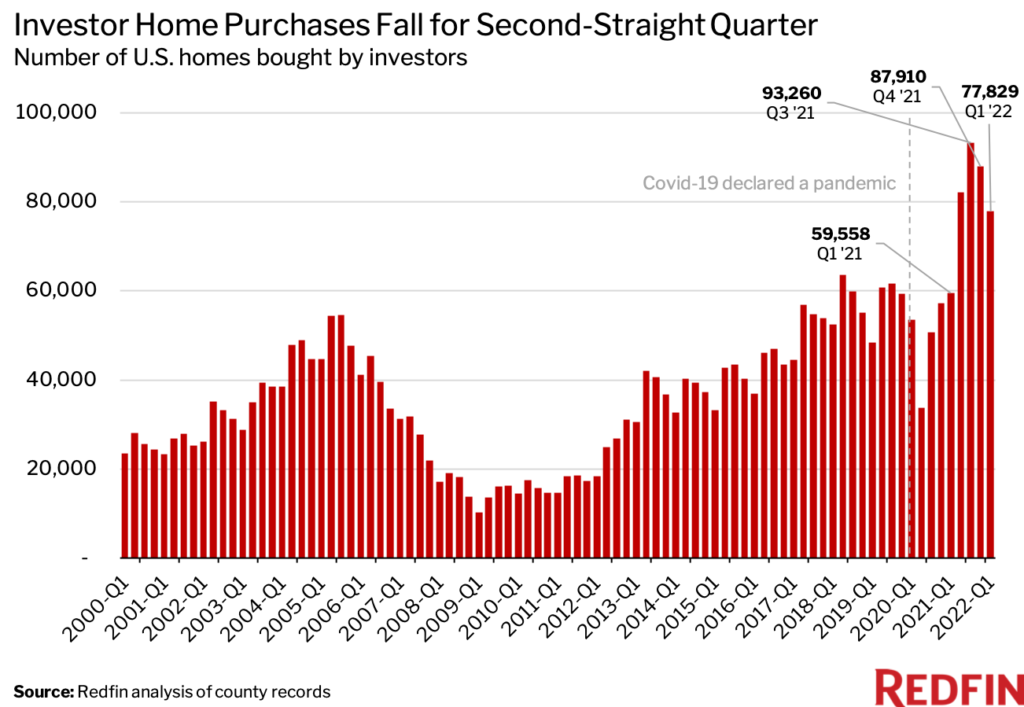
This is according to a Redfin analysis of county records across 40 of the most populous U.S. metropolitan areas. We define an investor as any institution or business that purchases residential real estate. When we refer to a “record,” the record dates back to the first quarter of 2000. This data is subject to revision. Scroll to the bottom of this report for our full methodology.
“Investor home purchases are falling for the same reason overall home purchases are falling: Surging interest rates and high housing prices have made it more expensive to get a mortgage and buy a home,” said Redfin Senior Economist Sheharyar Bokhari. “While roughly three-quarters of investor purchases are made with cash, investors are still impacted by interest rates because they often take out loans to get that cash.”
“The fact that investors are still able to grow their market share while buying fewer homes signals they’re not feeling the pain of higher interest rates as intensely as individual buyers, many of whom are getting priced out of the housing market altogether,” Bokhari added. “It also indicates that the individuals who can still afford to buy will continue to face competition from investors.”
In dollar terms, investors bought $49.8 billion worth of homes in the first quarter, down 6.8% from $53.4 billion one quarter earlier but up 40.3% from $35.5 billion one year earlier. The typical home investors purchased cost $427,174, up from $425,298 one quarter earlier and $372,076 one year earlier.
Jennifer Bowers, a Redfin real estate agent in Nashville, said investors are pulling back from the market because they’re hoping prices will drop.
“Investors are on the hunt for deals. They’re waiting for homes to linger on the market for longer,” she said. “Plus, they bought so many houses at the height of the pandemic that some amount of pullback is natural.”
Bowers continued: “A few months ago, 95% of homes for sale in Nashville would get at least one cash offer from an investor—one of my listings got eight. Today, most homes aren’t getting any. This is good news for regular buyers. While some of them will still get into bidding wars with investors, they won’t necessarily have to waive every contingency and offer astronomically over the asking price to compete.”
The drop in investor purchases over the last two quarters may indicate investor purchases are past their peak and returning to normal. Up until the end of 2021, investor purchases had been climbing steadily since the pandemic began, in defiance of normal seasonality. Meanwhile, overall home purchases seesawed in typical seasonal fashion. Now it seems investor activity is getting back on track with the market as a whole.
While investor purchases have slowed, they remain above pre-pandemic levels, in part because investors can rent out the homes they buy and cash in on soaring rents. Demand for rentals is high because there aren’t enough homes for sale, and the ones that are for sale are often prohibitively expensive.
Investor Purchases of High- and Mid-Priced Homes Decline While Purchases of Low-Priced Homes Rise
Investor purchases of high-priced homes fell 27.1% quarter over quarter to 19,312 in the first quarter. Investor purchases of mid-priced homes also declined, down 19.1% to 23,556. But investor purchases of low-priced homes increased 8.3% to 34,961.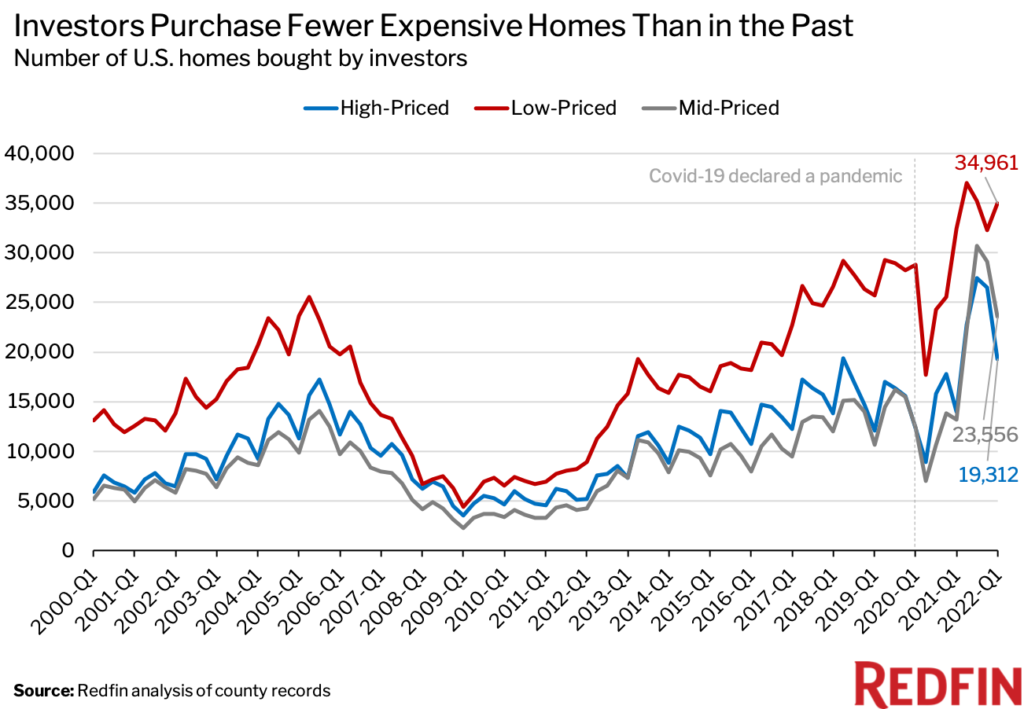
On a year-over-year basis, purchases of high-priced homes were up 38.3%, while purchases of mid-priced homes were up 78.7% and purchases of low-priced homes were up 7.9%—representing the smallest annual increases in a year.
Demand for high-end goods tends to slow during times of economic stress. Total luxury-homes sales fell 18% year over year during the three months ending April 30, the largest drop since the onset of the coronavirus pandemic, a recent Redfin analysis found. Non luxury home sales declined just 5% during the same period.
Investors also tend to gravitate toward lower-priced homes, which offer more room to generate profits. Low-priced homes made up 44.9% of investor home purchases in the first quarter, while mid-priced homes made up 30.3% and high-priced homes made up 24.8%.
Investors bought a record 25.3% of all low-priced homes that were purchased in the metros tracked by Redfin in the first quarter, compared with 18.1% of mid-priced homes and 16% of high-priced homes.
Investor Purchases of Single-Family Homes Drop 14%—More Than Any Other Property Type
Investor purchases of single-family homes dropped 14.4% quarter over quarter to 56,791 in the first quarter. Investor purchases of condos/co-ops and multifamily properties also declined, falling 4.5% to 12,368 and 0.4% to 3,523, respectively. The only property type that saw an increase was townhouses, with investor purchases climbing 1.5% quarter over quarter to 5,147.
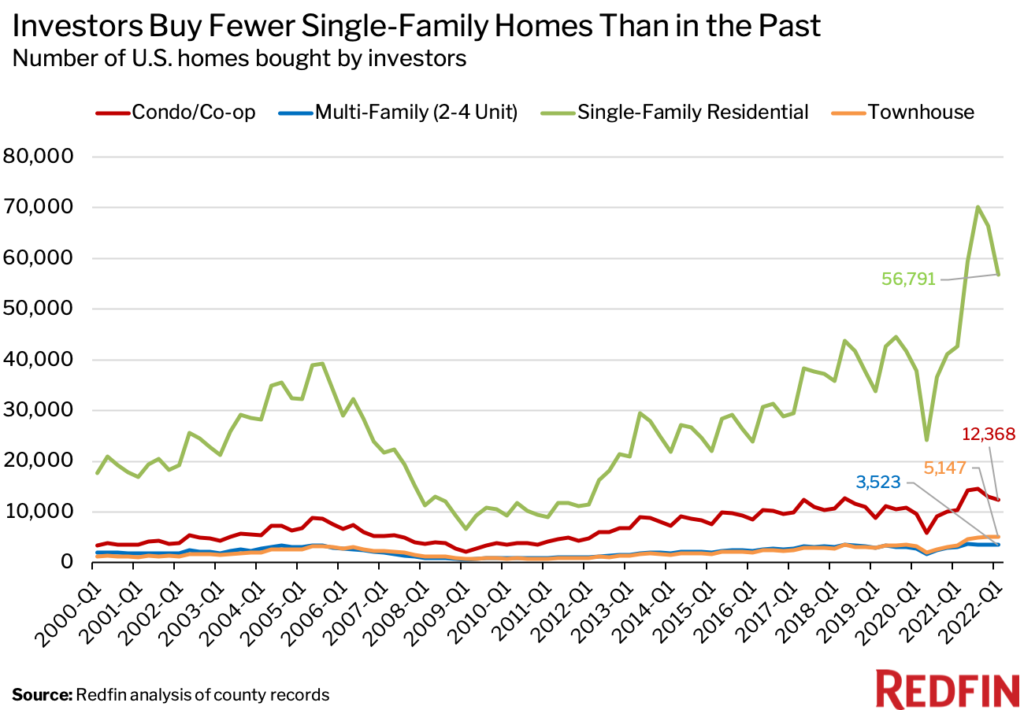
Investor purchases of townhouses also rose the most on a year-over-year basis, increasing 48.8%. By comparison, purchases of single-family homes were up 33.1%, purchases of condos/co-ops were up 19.5% and purchases of multifamily properties were up 14.8%.
While investor purchases of single-family homes declined on a quarterly basis, single-family homes remained the most popular property type. They represented 73% of investor purchases in the first quarter, while condos/co-ops made up 15.9%, townhouses made up 6.6% and multifamily properties made up 4.5%.
“Investors dove full-force into the single-family housing market during the first year of the pandemic because demand was through the roof—everyone wanted to leave their condo in the city for a big house in the suburbs,” Bokhari said. “That demand is no longer as intense now that life is going back to normal and Americans are returning to the office. Still, single-family homes remain the most common property type purchased by investors, partly because investors are concentrated in the Sun Belt, where single-family homes are more common.”
Investors have the highest market share in the multifamily market. They bought 29.5% of multifamily properties purchased in the metros tracked by Redfin in the first quarter. This isn’t surprising, as it’s less common for individuals to buy multifamily buildings than other property types. By comparison, investors bought 20.9% of single-family homes purchased in the first quarter, 17.3% of townhouses and 16.4% of condos/co-ops.
Investors Purchases Plummet in Places Like Atlanta and Jacksonville, Where Investors Have a Big Presence
top 10 metros by investor market share all saw investor purchases decline in the first quarter. Investor purchases fell 25.3% quarter over quarter in Atlanta, where investors bought 33.1% of homes that sold—the highest market share of any metro Redfin analyzed. In Jacksonville, FL (32.3% market share), investor purchases dropped 21.7%. Here’s the full top 10 list:
Top 10 U.S. Metros By Investor Market Share: First Quarter 2022
| Share of Purchased Homes Bought by Investors in Q1 2022 (Market Share) | QoQ Change in Investor Purchases | |
|---|---|---|
| Atlanta, GA | 33.1% | -25.3% |
| Jacksonville, FL | 32.3% | -21.7% |
| Charlotte, NC | 32.2% | -19.1% |
| Phoenix, AZ | 29.0% | -8.6% |
| Miami, FL | 28.2% | -3.6% |
| Las Vegas, NV | 26.8% | -16.5% |
| Orlando, FL | 25.7% | -12.9% |
| Tampa, FL | 24.7% | -13.0% |
| Nashville, TN | 24.6% | -16.5% |
| Columbus, OH | 22.8% | -20.5% |
Metro-Level Summary: Investor Home Purchases
All data represents the first quarter of 2022, unless otherwise noted. The table below includes the 40 most populous metros for which data was available.
| U.S. Metro Area | Investor Purchases, QoQ Change | Investor Purchases, YoY Change | Share of Purchased Homes Bought by Investors | Share of Purchased Homes Bought by Investors, Q1 2021 | Total Value of Homes Bought by Investors | Median Sale Price of Homes Bought by Investors |
|---|---|---|---|---|---|---|
| Anaheim, CA | -17.3% | 3.1% | 20.6% | 16.7% | $2,582,807,000 | $1,170,750 |
| Atlanta, GA | -25.3% | 53.6% | 33.1% | 22.7% | $2,700,285,805 | $285,000 |
| Baltimore, MD | 4.2% | 33.6% | 16.4% | 12.1% | $372,922,006 | $170,000 |
| Charlotte, NC | -19.1% | 44.4% | 32.2% | 23.1% | $1,153,383,738 | $306,000 |
| Chicago, IL | 6.4% | 12.6% | 13.2% | 10.7% | $889,788,999 | $180,000 |
| Cincinnati, OH | -10.1% | 2.8% | 19.3% | 16.4% | $225,899,104 | $150,000 |
| Cleveland, OH | -2.1% | 28.9% | 22.4% | 19.3% | $242,052,911 | $95,000 |
| Columbus, OH | -20.5% | 59.5% | 22.8% | 15.8% | $322,174,058 | $195,000 |
| Denver, CO | -24.7% | 17.0% | 17.1% | 14.2% | $1,164,741,667 | $535,850 |
| Detroit, MI | 2.4% | 3.7% | 22.2% | 18.7% | $112,893,002 | $78,000 |
| Fort Lauderdale, FL | -5.1% | 40.6% | 20.9% | 15.3% | $1,246,319,426 | $335,000 |
| Jacksonville, FL | -21.7% | 62.1% | 32.3% | 23.5% | $705,795,984 | $278,100 |
| Las Vegas, NV | -16.5% | 28.3% | 26.8% | 20.6% | $1,541,239,187 | $405,200 |
| Los Angeles, CA | -13.5% | 17.7% | 19.8% | 16.3% | $6,342,166,591 | $1,020,000 |
| Miami, FL | -3.6% | 22.8% | 28.2% | 24.3% | $2,854,287,225 | $412,600 |
| Milwaukee, WI | -26.7% | -13.3% | 15.0% | 15.1% | $137,796,079 | $130,000 |
| Minneapolis, MN | -30.3% | 9.3% | 11.6% | 9.5% | $403,559,297 | $275,000 |
| Montgomery County, PA | 10.1% | 34.4% | 10.0% | 8.7% | $179,184,765 | $230,000 |
| Nashville, TN | -16.5% | 36.4% | 24.6% | 17.3% | $768,663,960 | $359,950 |
| Nassau County, NY | -1.1% | 9.0% | 12.8% | 9.9% | $1,542,575,465 | $512,500 |
| New Brunswick, NJ | -2.7% | 8.3% | 11.5% | 9.6% | $474,121,976 | $353,500 |
| New York, NY | 15.9% | 49.9% | 15.5% | 11.6% | $3,837,440,062 | $710,000 |
| Newark, NJ | 20.6% | 30.4% | 14.8% | 10.7% | $307,113,737 | $330,000 |
| Oakland, CA | -17.1% | 14.3% | 13.8% | 11.4% | $1,126,423,000 | $1,005,000 |
| Orlando, FL | -12.9% | 44.7% | 25.7% | 18.8% | $1,092,176,213 | $314,750 |
| Philadelphia, PA | 55.3% | 116.2% | 18.8% | 16.6% | $349,453,905 | $125,000 |
| Phoenix, AZ | -8.6% | 40.3% | 29.0% | 20.4% | $3,939,402,246 | $424,000 |
| Portland, OR | -28.1% | 13.8% | 11.5% | 10.7% | $466,583,241 | $511,600 |
| Providence, RI | -18.2% | 40.5% | 8.0% | 5.3% | $100,295,423 | $300,000 |
| Riverside, CA | -4.3% | 18.6% | 17.2% | 15.0% | $1,827,254,422 | $535,000 |
| Sacramento, CA | -21.6% | 40.8% | 18.8% | 13.9% | $1,017,162,000 | $555,500 |
| San Diego, CA | -14.9% | 21.9% | 21.1% | 16.4% | $2,328,361,455 | $900,000 |
| San Francisco, CA | -21.7% | 1.5% | 20.0% | 17.8% | $1,582,787,667 | $2,100,000 |
| San Jose, CA | -8.7% | 3.1% | 14.7% | 13.3% | $1,035,739,773 | $1,600,000 |
| Seattle, WA | -23.2% | -14.2% | 10.1% | 10.6% | $722,928,096 | $850,000 |
| Tampa, FL | -13.0% | 38.4% | 24.7% | 18.3% | $1,714,848,558 | $307,000 |
| Virginia Beach, VA | 7.9% | 68.5% | 12.2% | 9.4% | $197,418,800 | $160,000 |
| Warren, MI | 8.4% | -1.5% | 9.7% | 9.7% | $140,538,966 | $133,500 |
| Washington, D.C. | -4.0% | 6.2% | 9.2% | 7.5% | $810,993,643 | $387,800 |
| West Palm Beach, FL | 4.1% | 27.5% | 17.1% | 14.1% | $1,226,383,219 | $375,000 |
Methodology
For this analysis, we looked at county sale records for homes purchased from January 2000 through March 2022. We define an investor as any buyer whose name includes at least one of the following keywords: LLC, Inc, Trust, Corp, Homes. We also define an investor as any buyer whose ownership code on a purchasing deed includes at least one of the following keywords: association, corporate trustee, company, joint venture, corporate trust. This data may include purchases made through family trusts for personal use.
We analyzed home sales in the 50 most populous metro areas, but only included 40 metros in this report due to non-disclosure of sale prices in some counties.
For the price-tier analysis, we looked at all home sales in a given year and sorted each sale into one of three buckets: low-priced, mid-priced or high-priced. Low-priced means a home’s sale price was in the bottom tercile of local sale prices, while mid-priced means it was in the middle tercile and high-priced means it was in the top tercile.


