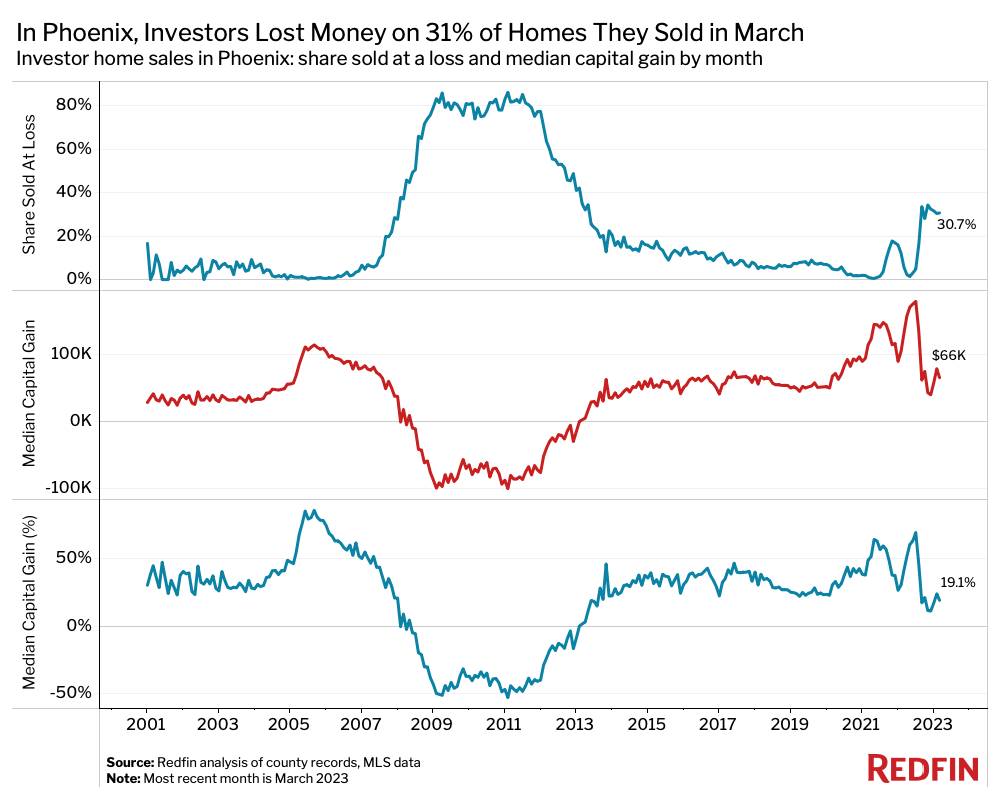
The share is more than twice that high in Phoenix and Las Vegas, both pandemic boomtowns. Investors are selling at a loss as elevated mortgage rates curtail homebuyer demand.
Roughly one of every seven (13.5%) U.S. homes sold by an investor in March sold for less than the investor bought it for. That’s comparable with February’s 14.5% rate—the highest since 2016. It’s also nearly triple the share of a year earlier and compares with a record low of 2.8% in May.
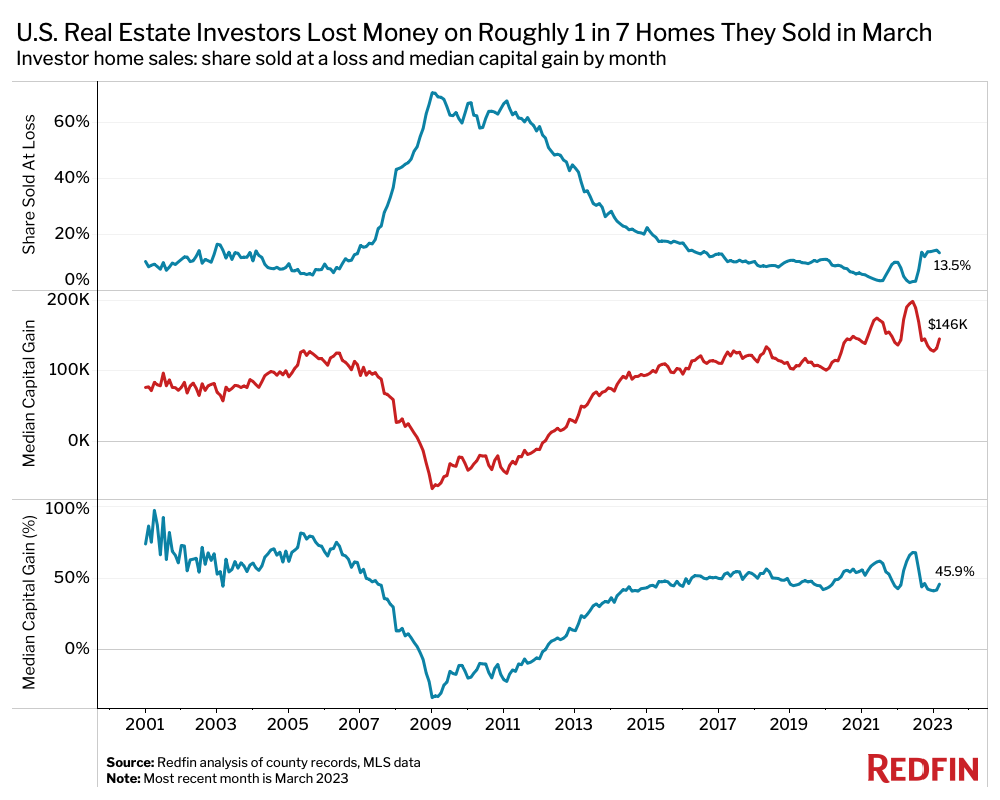
By comparison, 4.8% of overall U.S. homes that sold in March sold at a loss.
This is according to a Redfin analysis of county records and MLS data across 40 of the most populous U.S. metropolitan areas. We define an investor as any institution or business that purchases residential real estate, including both large companies and mom-and-pop investors. This data is subject to revision. A full methodology can be found at the bottom of this report.
While most housing investors still reaped gains, those gains have shrunk. The typical investor who sold a home in March sold it for 45.9% more ($145,714) than the price they paid, down from 55.3% ($173,458) a year earlier and a pandemic peak of 67.9% ($199,274) in June 2022. It’s important to note that gains don’t necessarily equal profits. Just because an investor sold a home for $145,000 more than they paid doesn’t mean they’re making money because they may have spent more than that on renovating the property.
“Home flippers aren’t reaping the gains they used to,” said Phoenix Redfin agent Van Welborn. “I recently showed one of my buyers a three-bedroom single-family home in Glendale that was listed by an investor. My client ultimately found another house they liked better, and the investor ended up losing about $20,000. The investor bought the home for $450,000 and sold it for $480,000, but put $50,000 of work into it. The house also sold below the $550,000 list price after sitting on the market for almost four months.”
Investors Are Losing Money as Mortgage Rates Rise, Homebuyer Demand Drops
Investors are making less money selling homes—and losing money in some cases—because the housing market has slowed dramatically in response to rising mortgage rates.
The average 30-year-fixed mortgage rate is 6.39%, down from the 20-year high of 7.08% in the fall, but up from 5.11% a year ago and a record low of 2.65% during the height of the pandemic in January 2021. Higher mortgage payments have eaten into investor profits, and sent the typical homebuyer’s monthly payment up nearly $300 from a year ago, which has slowed homebuying demand and pushed down sale prices. As a result, the share of investor-owned homes selling at a loss has increased. While many investors buy homes in cash, they’re still sensitive to high interest rates because they often take out loans to get that cash.
“You might wonder why investors don’t just wait to sell until the housing market bounces back. Many long-term investors who rent their properties out are doing that, but many flippers—especially those who bought recently—can’t afford to,” said Redfin Senior Economist Sheharyar Bokhari. “Holding onto homes that aren’t producing income can be expensive because the owner is on the hook for property taxes, along with operating costs and monthly mortgage payments in some cases. Many short-term investors are also opting to sell because they know prices may have more room to fall and want to cut their losses.”
Roughly one in five (20.8%) homes sold by flippers in March sold at a loss, higher than the 13.5% share for investors overall. For the purposes of this report, we define a flipper as an investor that bought a home and resold it within nine months.
Investors who rent out their properties are also seeing their returns shrink in some areas. The median U.S. asking rent fell 0.4% year over year in March—the first annual drop in three years—and 13 major metros saw larger declines. Owners of short-term rentals are getting hit as well. The Airbnb market market is oversaturated with supply and authorities are imposing tougher restrictions on hosts, driving some to sell, Redfin agents said.
Overall, investor activity has fallen significantly from the height of the pandemic, when record-low mortgage rates and soaring homebuyer demand drove up investor purchases. Redfin recently reported that investor purchases declined a record 46% year over year in the fourth quarter.
Investors Are Most Likely to Sell at a Loss in Phoenix, Las Vegas
In Phoenix, 30.7% of homes sold by investors in March sold at a loss—the highest share of the 40 metros Redfin analyzed and more than double the national rate. Next came Las Vegas (28%), Jacksonville, FL (20.9%), Sacramento, CA (20.2%) and Charlotte, NC (17.4%).
The markets where investors are most likely to lose money are the places where home purchases—by investors and individual house hunters alike—soared during the pandemic. Many of those markets are also on the list of housing markets that are now cooling fastest. Pandemic boomtowns are seeing home prices and sales fall relatively quickly because housing costs surged to unsustainable levels during the pandemic, pricing out many house hunters, and elevated mortgage rates then added fuel to the fire.
Redfin agents say that small, individual investors are often the ones offloading their properties now, while many large investment companies are waiting on the sidelines for the market to improve.
“Most of the investors I see selling now are mom-and pop-investors,” said Las Vegas Redfin real estate agent Shay Stein. “They’re selling because their long-term tenants are moving out, they want to put their money elsewhere, or they just want to get out because they have heartburn from 2008. The best time to sell would’ve been late 2021 or early 2022, but many of them are thinking that the next best time is now because the economy and home prices could slow further.”
While a lot of large investors are holding onto their properties, iBuyers (instant buyers) are the exception, according to Stein. Many iBuying companies, including RedfinNow, ceased or slowed operations in the last two years and are now trying to offload inventory. That’s likely part of the reason that some markets where iBuyers had a large presence, including Phoenix, Charlotte and Las Vegas, have seen an uptick in the share of investor-owned homes selling at a loss. Redfin shuttered its iBuying operation, RedfinNow, in November 2022.
“My colleague recently represented a couple that purchased an iBuyer home for $610,000, substantially below the $760,000 list price and the $708,200 price that the iBuyer paid for the home,” Stein said. “The appraisal also came in at $680,000, so the buyers walked away with $70,000 in equity. The house sat on the market for 166 days before selling.”
Investors are less likely to lose money in affordable areas and select South Florida markets, which have held up relatively well. In Virginia Beach, VA, 1.7% of homes sold by investors in March sold at a loss. It was followed by West Palm Beach, FL (2.4%), Miami (2.5%), Fort Lauderdale, FL (2.5%) and Warren, MI (2.6%). Affordable markets have seen housing demand fare relatively well because prices didn’t overheat as much during the pandemic, and the rise in mortgage rates doesn’t make as big of a dollar difference in monthly housing payments as it does in expensive areas.
Investors Are Selling Homes for Less Than They Were a Year Ago
The median sale price of homes sold by investors was $463,505 in March, down 4.8% from $486,980 a year earlier.
In San Francisco, the median sale price of homes sold by investors fell 30% year over year to $1.8 million in March—the largest drop among the metros Redfin analyzed. Next came Sacramento (-13.6%), San Jose, CA (-13.4%), Oakland, CA (-13.3%) and Warren (-11%). New York, Phoenix, Las Vegas, Seattle and Denver rounded out the top 10. Overall U.S. home prices have been falling fastest in pandemic boomtowns and expensive coastal markets because prices in those areas overheated in recent years and are now coming down from unsustainable levels.
With returns shrinking, investors are getting creative, Stein said.
“Some investors are offering sellers a 60% down payment but hedging their bets by holding onto the rest until they flip the home and resell it,” Stein said. “Let’s say an investor bought your home for $700,000. They would give you $420,000 upfront and then write you another check once they cash out, but the risk is that oftentimes, they’re not guaranteeing that you’ll get the full remainder of your money. If their flip doesn’t go well, they might only give you $150,000 of the $280,000 they owe you.”
Redfin agents do not recommend that most sellers take offers like this. The potential benefit for the seller is a big down payment for their next home, but Stein said such a risk should only be a last resort for sellers who desperately need quick cash for their next move.
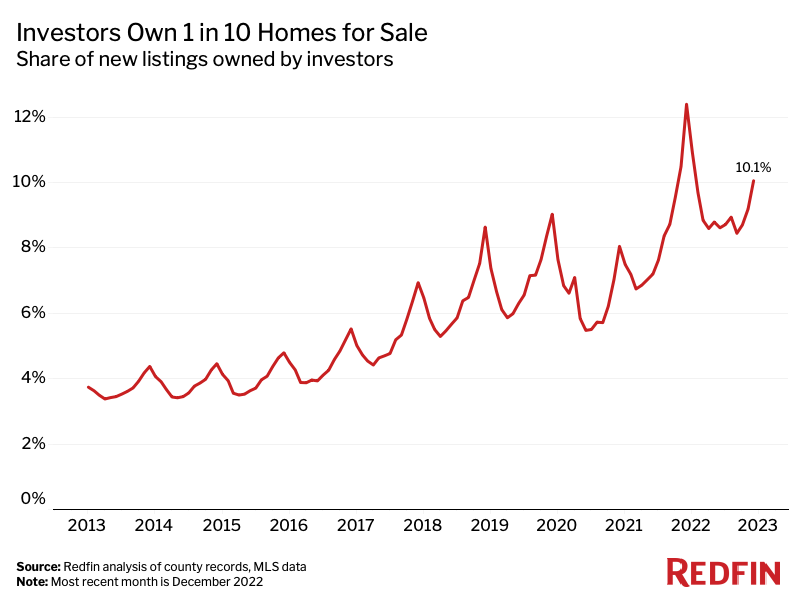
Investors Own 10% of Homes for Sale, Higher Than Pre-Pandemic Levels
Investors owned 10.1% of new listings on the market as of December, the most recent month for which listing data is available. That’s down from a peak of 12.4% a year earlier, but higher than pre-pandemic levels.
Metro-Level Summary: Investor Housing Market Activity, March 2023
This table includes 40 of the 50 most populous U.S. metropolitan areas—those for which there was sufficient data.
| Metro Area | Share of Homes Sold at a Loss | Median Capital Gain (%) | Median Capital Gain ($) | Median Sale Price | Median Sale Price (YoY Change) |
| Anaheim, CA | 8.4% | 39.1% | $323,250 | $1,150,000 | -1.3% |
| Atlanta, GA | 14.5% | 44.7% | $98,000 | $317,000 | -6.5% |
| Baltimore, MD | 5.5% | 87.1% | $138,750 | $298,000 | 24.2% |
| Charlotte, NC | 17.4% | 55.5% | $117,000 | $328,000 | -2.7% |
| Chicago, IL | 10.8% | 58.6% | $112,750 | $305,000 | -1.6% |
| Cincinnati, OH | 3.7% | 121.8% | $124,250 | $226,250 | 3.5% |
| Cleveland, OH | 15.3% | 77.3% | $69,750 | $160,000 | 4.2% |
| Columbus, OH | 3.0% | 92.3% | $120,000 | $250,000 | -3.3% |
| Denver, CO | 11.2% | 42.9% | $162,000 | $540,000 | -7.7% |
| Detroit, MI | 16.2% | 83.2% | $62,215 | $137,000 | -2.1% |
| Fort Lauderdale, FL | 2.5% | 74.5% | $182,450 | $427,450 | 6.9% |
| Jacksonville, FL | 20.9% | 34.9% | $77,450 | $299,450 | -2.8% |
| Las Vegas, NV | 28.0% | 24.2% | $75,900 | $390,000 | -8.2% |
| Los Angeles, CA | 8.3% | 32.8% | $236,500 | $957,500 | -1.8% |
| Miami, FL | 2.5% | 75.0% | $224,900 | $524,900 | 9.4% |
| Milwaukee, WI | 3.4% | 86.8% | $116,200 | $250,000 | 13.4% |
| Minneapolis, MN | 10.5% | 48.4% | $106,000 | $325,000 | 2.6% |
| Montgomery County, PA | 3.5% | 78.2% | $179,950 | $409,950 | 3.8% |
| Nashville, TN | 16.4% | 36.2% | $107,123 | $403,400 | 4.4% |
| Nassau County, NY | 4.3% | 74.3% | $277,000 | $650,000 | 5.7% |
| New Brunswick, NJ | 4.7% | 84.6% | $210,750 | $460,000 | 7.6% |
| New York, NY | 11.3% | 74.8% | $329,000 | $769,000 | -10.6% |
| Newark, NJ | 5.5% | 104.3% | $245,000 | $480,000 | 3.2% |
| Oakland, CA | 14.5% | 40.0% | $260,000 | $910,000 | -13.3% |
| Orlando, FL | 12.2% | 41.0% | $104,535 | $359,435 | 2.2% |
| Philadelphia, PA | 7.3% | 102.9% | $142,000 | $280,000 | 16.7% |
| Phoenix, AZ | 30.7% | 19.1% | $65,650 | $410,000 | -9.1% |
| Portland, OR | 15.4% | 56.2% | $185,500 | $515,500 | -5.0% |
| Providence, RI | 4.7% | 63.2% | $151,750 | $391,750 | 5.1% |
| Riverside, CA | 12.2% | 38.1% | $152,500 | $552,500 | -3.1% |
| Sacramento, CA | 20.2% | 27.3% | $109,250 | $509,500 | -13.6% |
| San Diego, CA | 11.4% | 47.1% | $306,000 | $956,000 | 6.2% |
| San Francisco, CA | 13.0% | 30.7% | $417,000 | $1,775,000 | -30.0% |
| San Jose, CA | 9.7% | 32.0% | $370,000 | $1,525,000 | -13.4% |
| Seattle, WA | 14.4% | 55.9% | $297,500 | $830,000 | -7.8% |
| Tampa, FL | 13.1% | 55.5% | $124,950 | $349,950 | -0.6% |
| Virginia Beach, VA | 1.7% | 107.1% | $150,000 | $290,000 | 12.0% |
| Warren, MI | 2.6% | 114.5% | $114,250 | $214,000 | -11.0% |
| Washington, D.C. | 5.6% | 46.1% | $161,001 | $510,000 | -3.8% |
| West Palm Beach, FL | 2.4% | 73.1% | $190,100 | $450,000 | 2.2% |
| National—U.S.A. | 13.5% | 45.9% | $145,714 | $463,505 | -4.8% |
Methodology
We identified investor home purchases in county records between January 2000 and December 2022, and searched MLS data to identify any listings of those properties between January 2001 and December 2022 and any sales of those properties between January 2001 and March 2023.
We define an investor as any buyer whose name includes at least one of the following keywords: LLC, Inc, Trust, Corp, Homes. We also define an investor as any buyer whose ownership code on a purchasing deed includes at least one of the following keywords: association, corporate trustee, company, joint venture, corporate trust. This data may include purchases made through family trusts for personal use.
We analyzed investor purchases in the 50 most populous U.S. metro areas, but only included 40 metros in this report due to non-disclosure of sale prices in some counties.
 United States
 Canada