
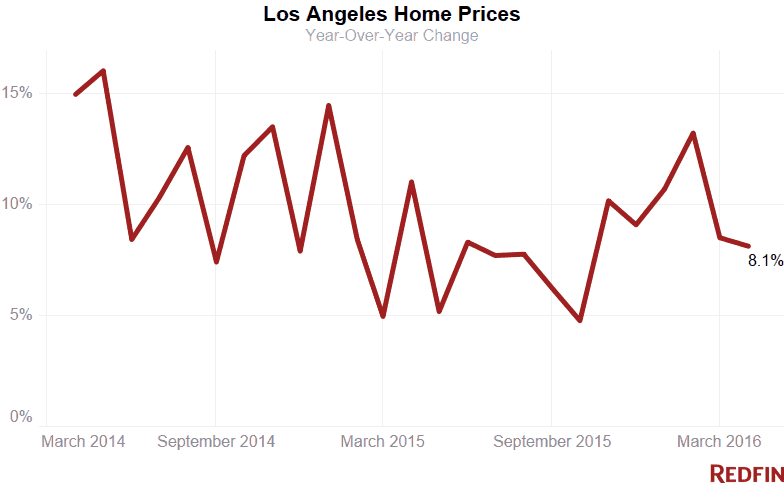
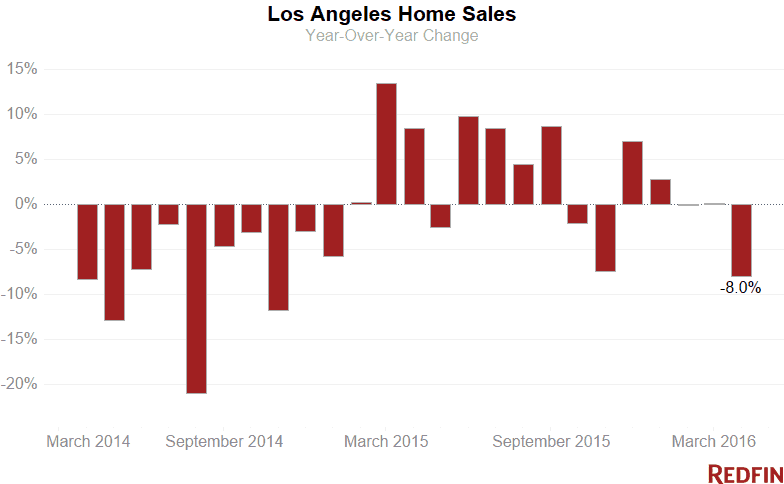
Home prices in the city of Los Angeles rose 8.1 percent in April from a year earlier to $600,000, the highest median sale price recorded in at least six years. Sales fell 8 percent, the biggest year-over-year decline since November 2014.
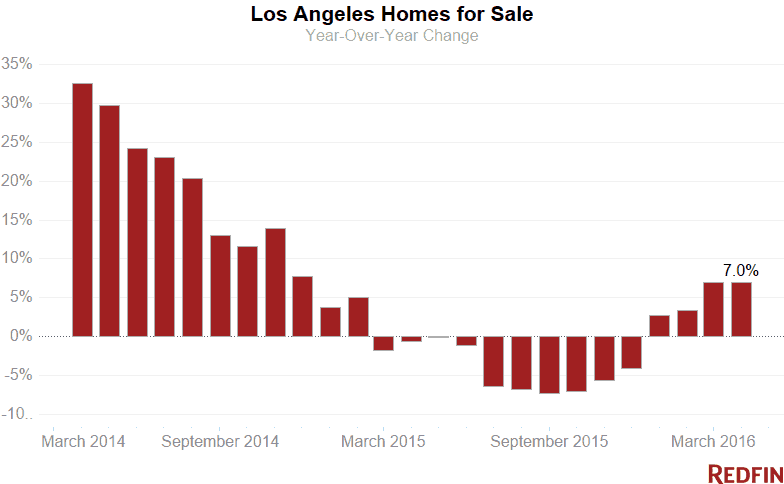
The stockpile of homes for sale increased almost 7 percent from a year earlier, the fourth month of growing supply.
More than 3,700 new listings hit the market last month, a 6.7 percent increase over April 2015. The inventory boost, while welcome, wasn’t enough to improve the balance of power between buyers and sellers. The city had less than a three-month supply of houses for sale, about half of what’s considered balanced, meaning buyers still faced fierce competition, especially for properties that are in demand.
“As prices continue to rise across L.A., more homeowners are deciding now is the right time to sell,” according to Redfin real estate agent Lindsay Katz.
“In general, this is good news for fatigued buyers who feel they’ve run out of options,” Katz said. “Still, while buyers have more to choose from this spring, inventory that does come on the market usually gets multiple offers and is snapped up quickly.”
Forty-one percent of homes sold in April fetched higher prices than sellers were asking.
Area Trends and Hot Neighborhoods
The Westside was a key contributor to the city’s sales slump. Sales fell 8.3 percent in the region compared to April 2015, most dramatically in the higher-end areas of Santa Monica (-26.6%), Malibu (-20.6%) and Venice (-19.6%).
Of the four major L.A. markets (The Eastside, The Westside, South L.A. and the Valley), the Westside had the largest annual price increase—a 15 percent jump to $1.22 million—and the most significant decline in home sales.
Glassell Park posted a median sale price of $720,000 in April, up 22 percent over last year. Sales in the thriving Eastside neighborhood rose nearly 11 percent. Glassell Park was also one of the city’s fastest markets, with a typical home selling in 16 days. Nearly half of all homes there sold for more than the asking price.
With its central location, increasing hip factor and affordability, North Hollywood also was hot last month. The median sale price jumped 14 percent from last April to $490,000. With so many homes priced below half a million dollars, buyer competition grew, pushing sales up 22 percent. Forty percent of all homes sold for more than sellers were asking, but the good news for NoHo homebuyers is that inventory is on the rise, up 43 percent over last year.
Here’s what’s happening in your neighborhood:
| Place | Median Sale Price | Year-Over-Year | Homes Sold | Year-Over-Year | Inventory | Year-Over-Year | New Listings | Median Days on Market | Avg Sale-to-List |
|---|---|---|---|---|---|---|---|---|---|
| Beverly Glen | $1,425,000 | 29.5% | 16 | 33.3% | 30 | 15.4% | 33 | 42 | 96.0% |
| Beverly Hills Post Office | $1,600,000 | -5.5% | 42 | -6.7% | 98 | 11.4% | 92 | 42 | 96.2% |
| Brentwood | $1,430,000 | -2.0% | 111 | 7.8% | 120 | -2.4% | 166 | 36 | 100.3% |
| Central LA | $899,500 | 9.0% | 844 | -6.6% | 917 | 1.0% | 1,348 | 34 | 98.9% |
| Century City | $1,060,000 | 24.1% | 83 | 15.3% | 73 | -19.8% | 126 | 20 | 99.9% |
| Chatsworth | $515,000 | 1.2% | 93 | -21.9% | 98 | 24.1% | 163 | 40 | 99.1% |
| Cheviot Hills | $1,725,000 | 16.8% | 20 | 11.1% | 19 | 5.6% | 28 | 31 | 97.5% |
| Crenshaw | $642,000 | 29.0% | 40 | 0.0% | 22 | 4.8% | 45 | 17 | 102.7% |
| Downtown | $630,000 | 4.1% | 63 | -49.6% | 118 | 32.6% | 147 | 53 | 98.3% |
| Eagle Rock | $750,000 | 13.6% | 71 | 20.3% | 35 | -14.6% | 87 | 15 | 102.1% |
| East LA | $640,000 | 11.3% | 557 | 4.1% | 434 | 3.1% | 789 | 22 | 101.5% |
| Encino | $780,000 | 6.0% | 163 | -15.5% | 177 | 2.3% | 283 | 34 | 99.4% |
| Fox Hills | $445,000 | 3.5% | 17 | -45.2% | 9 | -47.1% | 30 | 21 | 100.7% |
| Glassell Park | $720,000 | 22.0% | 41 | 10.8% | 26 | 8.3% | 59 | 16 | 102.1% |
| Greater Echo Park Elysian | $873,000 | 10.7% | 61 | 27.1% | 52 | 8.3% | 71 | 34 | 101.0% |
| Hancock Park | $3,100,000 | 115.6% | 19 | 137.5% | 26 | 52.9% | 28 | 30 | 98.0% |
| Highland Park | $625,000 | 7.4% | 74 | 10.4% | 52 | -23.5% | 110 | 25 | 100.8% |
| Hollywood | $711,000 | 4.6% | 75 | 8.7% | 84 | -1.2% | 111 | 44 | 98.3% |
| Hollywood Hills West | $1,157,500 | 3.8% | 122 | 17.3% | 128 | -21.5% | 183 | 44 | 98.4% |
| Holmby Hills | $893,000 | 1.2% | 2 | -80.0% | 14 | 55.6% | 20 | 17 | 97.0% |
| Koreatown / Wilshire Center | $590,000 | 3.7% | 108 | -6.1% | 128 | 7.6% | 179 | 31 | 99.1% |
| Lake Balboa | $500,000 | 17.6% | 80 | -4.8% | 56 | 1.8% | 116 | 27 | 100.1% |
| Malibu | $2,070,000 | 4.8% | 27 | -20.6% | 219 | -2.7% | 62 | 53 | 96.1% |
| Marina del Rey | $832,000 | -1.7% | 81 | 19.1% | 70 | 18.6% | 123 | 31 | 99.1% |
| Mid-City | $880,000 | 14.3% | 125 | -13.8% | 131 | 8.3% | 208 | 24 | 99.8% |
| Mid-Wilshire | $885,000 | 4.1% | 378 | -3.3% | 410 | 9.3% | 615 | 30 | 99.2% |
| Mount Washington | $725,000 | 3.7% | 27 | -6.9% | 18 | 0.0% | 36 | 19 | 105.5% |
| North Hollywood | $490,000 | 14.0% | 160 | 22.1% | 114 | 42.5% | 212 | 31 | 100.2% |
| North Valley | $468,000 | 8.8% | 1,123 | -3.5% | 858 | 21.4% | 1,738 | 33 | 99.5% |
| Northridge | $600,000 | 21.2% | 118 | -4.1% | 89 | -2.2% | 178 | 32 | 98.0% |
| Northwest San Pedro | $499,000 | 11.5% | 69 | 1.5% | 57 | -31.3% | 98 | 55 | 99.1% |
| Pacific Palisades | $2,345,000 | -5.2% | 93 | -4.1% | 111 | 7.8% | 146 | 29 | 98.7% |
| Pacoima | $375,000 | 14.2% | 79 | 6.8% | 44 | 22.2% | 115 | 18 | 99.3% |
| Panorama City | $355,000 | 3.6% | 71 | -1.4% | 59 | 110.7% | 95 | 49 | 99.5% |
| Pasadena | $750,000 | 11.5% | 136 | -16.1% | 327 | -4.7% | 228 | 25 | 100.4% |
| Santa Monica | $1,620,000 | 14.5% | 47 | -26.6% | 143 | -5.9% | 82 | 18 | 100.2% |
| Sherman Oaks | $867,250 | 26.2% | 224 | -9.3% | 240 | 22.4% | 354 | 37 | 99.6% |
| Silver Lake | $1,005,000 | 12.3% | 61 | -15.3% | 44 | 22.2% | 84 | 22 | 104.0% |
| South Central LA | $361,000 | 8.2% | 207 | 14.4% | 198 | -19.5% | 345 | 38 | 99.0% |
| South LA | $400,000 | 11.7% | 859 | 7.5% | 833 | -6.0% | 1,353 | 35 | 99.9% |
| South Valley | $550,369 | 7.9% | 1,572 | -6.1% | 1,416 | 17.6% | 2,382 | 35 | 99.5% |
| Studio City | $930,000 | 5.3% | 134 | -15.2% | 156 | 23.8% | 202 | 55 | 99.2% |
| Sun Valley | $435,000 | 10.8% | 73 | -1.4% | 43 | -4.4% | 111 | 35 | 99.4% |
| Sylmar | $410,000 | 12.3% | 156 | 20.0% | 98 | 42.0% | 208 | 30 | 99.6% |
| Tarzana | $540,000 | 10.2% | 127 | -15.3% | 120 | 8.1% | 191 | 28 | 99.6% |
| Valley Village | $646,500 | -14.1% | 58 | 16.0% | 50 | 72.4% | 97 | 21 | 100.1% |
| Van Nuys | $497,000 | 19.8% | 104 | -14.1% | 85 | -2.3% | 155 | 43 | 99.0% |
| Venice | $1,688,000 | 11.2% | 90 | -19.6% | 104 | -5.4% | 146 | 39 | 98.7% |
| Watts | $289,000 | 29.3% | 64 | 33.3% | 64 | -4.5% | 113 | 47 | 99.5% |
| West Adams | $563,000 | 32.2% | 40 | 11.1% | 30 | -9.1% | 60 | 29 | 101.8% |
| West Long Beach | $380,000 | 10.5% | 37 | -15.9% | 24 | -20.0% | 43 | 39 | 99.0% |
| West Los Angeles | $1,220,000 | 15.1% | 1,359 | -8.3% | 1,429 | 3.1% | 2,239 | 25 | 99.9% |
| Westwood | $950,500 | 9.9% | 102 | -4.7% | 123 | -1.6% | 184 | 19 | 99.3% |
| Woodland Hills | $697,500 | 6.2% | 210 | -7.5% | 215 | 37.8% | 336 | 39 | 99.1% |
| Los Angeles, CA | $600,000 | 8.1% | 2,446 | -8.0% | 6,306 | 7.0% | 3,717 | 29 | 100.0% |
See Redfin’s data center to find out what’s happening in other cities.
NOTE: Not all neighborhoods are listed, but totals for L.A. encompass entire city. Data is based on listing information and might not reflect all real estate activity in the market. Neighborhood-specific data is measured over the three months ended April 30. Inventory measures listings active as of April 30.
For more information, contact Redfin journalist services
Phone: 206-588-6863
Email: press@redfin.com
Want to receive reports like this every month? Click here to be added to our distribution list.


