An analysis of over 220,000 home sales across a 13-year period found no consistent relationship between the addition of low-income housing and changes in nearby home prices in 18 of the 26 metro areas studied.
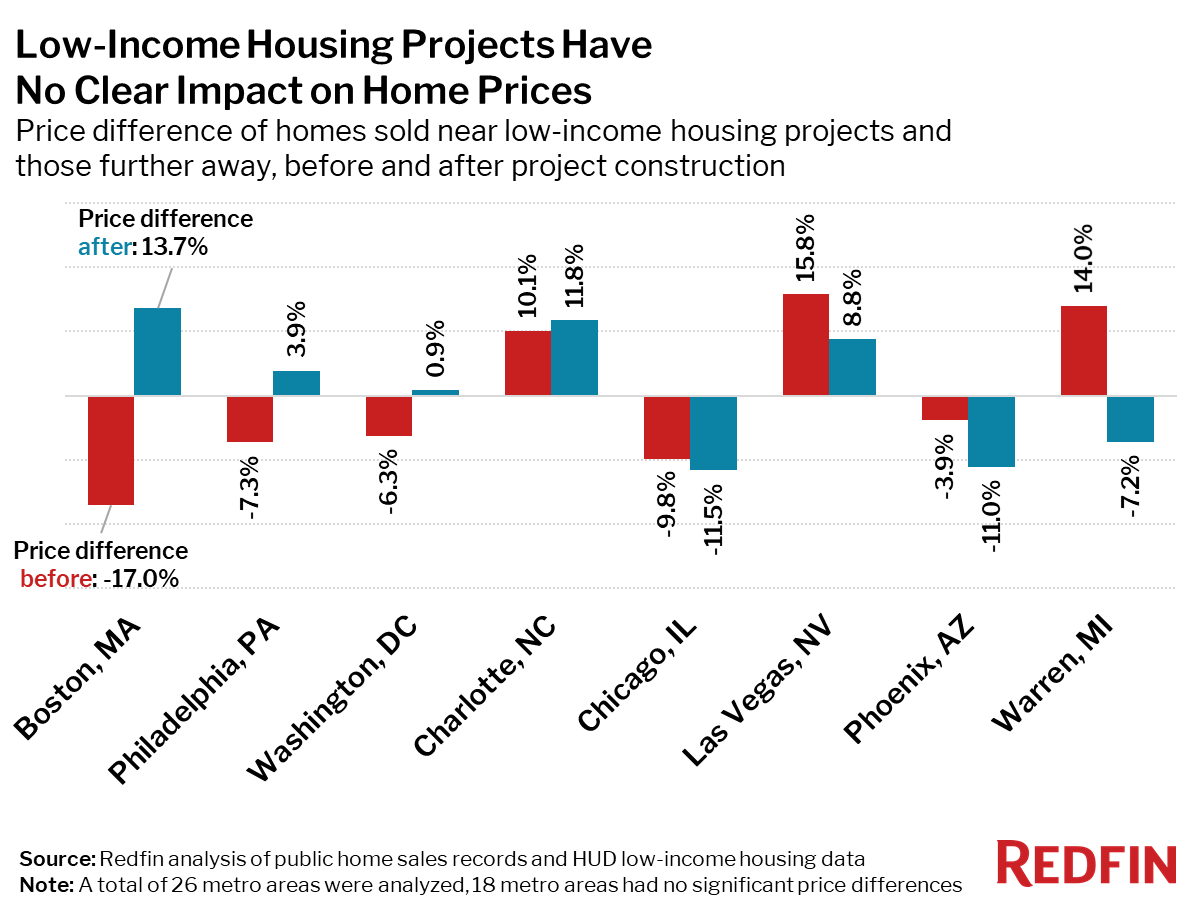
Construction of low-income housing developments has had no consistent impact on the sale prices of nearby homes, according to a Redfin analysis of over 220,000 home sales in neighborhoods with low-income housing developments in 26 metro areas across the U.S. from 2007 through 2019.
In 18 of the 26 metro areas studied, no significant difference was detected in the prices of nearby homes sold before and after the construction of a low-income housing development, when compared with similar homes farther from the development but within the same neighborhood. In four of the eight metro areas where significant differences were detected—Boston, Philadelphia, Washington, D.C. and Charlotte, NC—homes near low-income housing developments sold for more after the development was constructed. In the remaining four metro areas—Chicago, Las Vegas, Phoenix and Warren, MI—homes sold for less after low-income housing developments were built nearby.
“For children in low-income families, living in a neighborhood with less poverty can have a big impact on mental and physical health as well as long-term earnings throughout their life,” said Redfin senior economist Sheharyar Bokhari. “But economically integrated neighborhoods—those with low-income housing near homes for middle- and high-income households—are so rare because development of low-income housing often faces strong opposition from neighbors who are concerned that the project will lower their home values. These perceptions have made socio-economic segregation even more pervasive throughout the United States, further exacerbating social, racial and housing inequalities.”
The data used for this analysis comes from the HUD Low-Income Housing Tax Credit, which is used to incentivize private development of rental housing for lower-income households.
Expensive Neighborhoods in Boston & Washington, D.C., Saw Home-Price Gains After the Introduction of Low-Income Housing
In general, the more expensive the homes in a neighborhood, the more likely it was that the addition of a low-income housing development resulted in an increase in home prices in the neighborhood (R2 = 0.45). For example, in Washington, D.C., where the median price of homes sold near low-income housing developments in the study was $499,000, homes near the development site sold for 6.3% less than those farther away before the low-income homes were created. After the low-income homes were built, homes nearby sold for 0.9% more than those farther away.
“The data suggests that it can be a win-win to put low income housing in expensive neighborhoods, benefiting both current homeowners and low income residents,” explained Bokhari. “Because these projects are being built by private developers, they often have an incentive to identify places that have good prospects for growth. On the flip side, they’re also less likely to plan projects in areas that are less desirable.”
For homebuyers, economically integrated neighborhoods can be more desirable because they create a more self-contained community where the people who work in the community (teachers, service workers, etc) are able to live in the community.
However, in a lower-priced area like Phoenix, where the median home price near the low-income housing was $149,000, the price gap widened substantially. Before the introduction of the low-income housing development, homes near the site sold for 3.9% less than those farther away; after the low-income homes were built, nearby homes sold for 11% less than homes farther away.
One possible explanation for the relative weakening of home prices near some new low-income housing developments may be that low-income housing was put in areas that were in the midst of gentrification and rapid price growth. Had a high-end development instead been built in place of the low-income housing, prices might have continued to grow even higher. There are still many unknown factors, but overall this study supports the idea that low-income housing does not degrade property values.
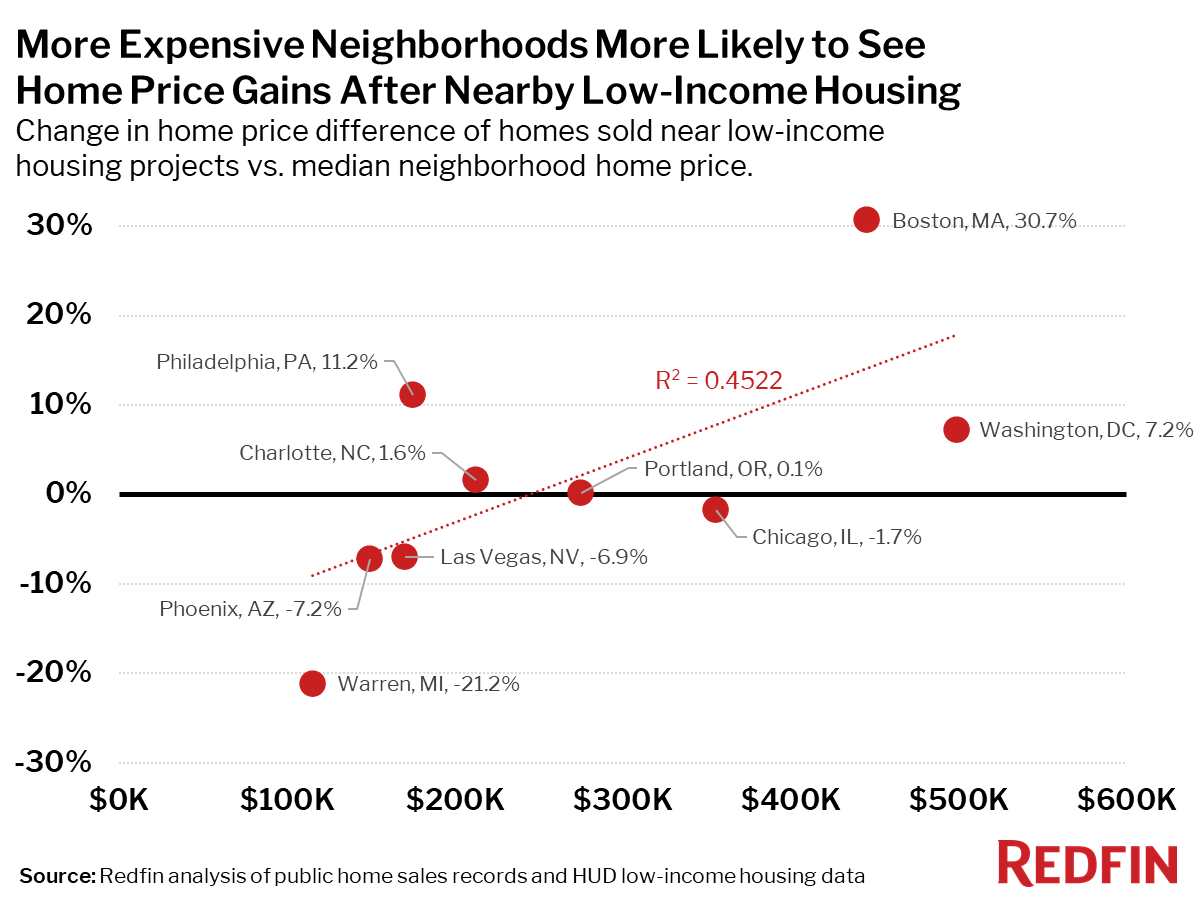
The opposite trend was seen in Philadelphia, where the median price of homes near low-income developments was just $174,900—below the national median price. Homes near the low-income housing site went from selling for 7.3% less than farther away homes before the low-income development was built, to selling for 3.9% more than homes farther away from the development after it was built.
“Part of President Joe Biden’s housing plan is to expand the Low-Income Housing Tax Credit,” said Bokhari. “If the Biden administration is successful in ‘dramatically increasing the number of new or rehabilitated affordable housing units,’ it will be a big step in the right direction, and in most cases, homeowners near the new affordable housing communities can rest assured that their home values will be unaffected.”
Home Price Difference Before and After Introduction of Nearby Low-Income Housing
| Metro Area | Statistically Significant Difference in Home Prices Before and After Nearby Low-Income Housing | Change in Home Price vs. Homes Not Near Low-Income Housing* | Sales Analyzed | Median Home Price in Neighborhoods with Low-Income Housing |
|---|---|---|---|---|
| Anaheim, CA | No | 1,773 | $558,000 | |
| Atlanta, GA | No | 5,748 | $154,000 | |
| Baltimore, MD | No | 13,687 | $215,000 | |
| Boston, MA | Yes | +31 points | 14,533 | $445,000 |
| Charlotte, NC | Yes | +2 points | 9,118 | $212,500 |
| Chicago, IL | Yes | -2 points | 6,110 | $355,000 |
| Cincinnati, OH | No | 1,904 | $159,450 | |
| Columbus, OH | No | 2,185 | $97,900 | |
| Denver, CO | No | 20,547 | $241,000 | |
| Indianapolis, IN | No | 7,395 | $123,400 | |
| Las Vegas, NV | Yes | -7 points | 2,182 | $170,000 |
| Los Angeles, CA | No | 2,653 | $380,000 | |
| Miami, FL | No | 3,636 | $315,000 | |
| Minneapolis, MN | No | 13,061 | $176,000 | |
| Montgomery County, PA | No | 5,792 | $248,950 | |
| New Brunswick, NJ | No | 9,848 | $255,000 | |
| Orlando, FL | No | 8,419 | $154,500 | |
| Philadelphia, PA | Yes | +11 points | 7,168 | $174,900 |
| Phoenix, AZ | Yes | -7 points | 10,982 | $149,000 |
| Portland, OR | Yes | +0.1 points | 11,351 | $275,000 |
| Seattle, WA | No | 12,253 | $350,000 | |
| St. Louis, MO | No | 5,572 | $204,000 | |
| Tampa, FL | No | 3,259 | $140,000 | |
| Virginia Beach, VA | No | 3,911 | $165,000 | |
| Warren, MI | Yes | -21 points | 3,389 | $114,999 |
| Washington, D.C. | Yes | +7 points | 36,824 | $499,000 |
*Note: Blanks in the change columns above indicate that the data was not statistically significant.
Methodology
For this study we identified low-income housing developments using HUD Low-Income Housing Tax Credit data. Only developments built between 2007 and 2019 with between 50 and 250 housing units—all low-income—were considered in this analysis. For a neighborhood to be included in the analysis, its Census tract had to receive its first low-income development during the study period of 2007-2019.
For each neighborhood with a qualifying low-income housing development, we compared home price trends for homes within 2,000 feet of the development and homes more than 2,000 feet away from the development but within the same Census tract. During the study period we required at least 250 sales in both the near and far regions before and after the development was constructed.
With these restrictions, we were able to analyze the impact of low-income housing developments across 26 of the 50 most populous metropolitan areas. The regression analysis controlled for beds, baths, age, sqft, property type, view, waterfront, new construction, walkscore, days on market, and the sale date (year and quarter) of the property.
Appendix: Analysis of Home Price Growth Rates Before and After Introduction of Nearby Low-Income Housing
We also analyzed the change in the rate of home price growth for nearby homes before and after the introduction of low-income housing to a neighborhood, and found even less evidence of any significant impact. In 22 of the 26 metro areas we studied, the introduction of low-income housing had no significant impact on the rate of home price growth.
Two of the 26 metro areas–Portland, OR and Los Angeles–saw nearby home price gains increase after low-income housing was built. In Portland, OR, neighborhoods near low-income housing sites saw home prices grow 1.8 percentage points less than areas further away in the years before the low-income development was built. In the years afterward, home price growth in the nearby neighborhoods was only 1.0 percentage point less. In Los Angeles, the difference in price growth between homes near low-income housing and those further away went from 2.4 points less to 2.9 points more.
Two other metro areas saw a negative change in home price growth after the introduction of low-income housing. In Boston neighborhoods near low-income developments had home prices growing 3.1 percentage points more than areas further away, but after low income housing was built, that fell to 0.9 points less. In Miami the difference in price growth between homes near low-income housing and those further away went from 4.1 points above to 2.6 points less.
Home Price Growth Difference Before and After Introduction of Nearby Low-Income Housing
| Metro Area | Statistically Significant Difference in Home Price Growth Rate Before and After Low-Income Housing | Change in Home Price Growth Rate vs. Homes Not Near Low-Income Housing* | Sales Analyzed | Median Home Price in Neighborhoods with Low-Income Housing |
|---|---|---|---|---|
| Anaheim, CA | No | 1,773 | $558,000 | |
| Atlanta, GA | No | 5,748 | $154,000 | |
| Baltimore, MD | No | 13,687 | $215,000 | |
| Boston, MA | Yes | -4 points | 14,533 | $445,000 |
| Charlotte, NC | No | 9,118 | $212,500 | |
| Chicago, IL | No | 6,110 | $355,000 | |
| Cincinnati, OH | No | 1,904 | $159,450 | |
| Columbus, OH | No | 2,185 | $97,900 | |
| Denver, CO | No | 20,547 | $241,000 | |
| Indianapolis, IN | No | 7,395 | $123,400 | |
| Las Vegas, NV | No | 2,182 | $170,000 | |
| Los Angeles, CA | Yes | +5 points | 2,653 | $380,000 |
| Miami, FL | Yes | -7 points | 3,636 | $315,000 |
| Minneapolis, MN | No | 13,061 | $176,000 | |
| Montgomery County, PA | No | 5,792 | $248,950 | |
| New Brunswick, NJ | No | 9,848 | $255,000 | |
| Orlando, FL | No | 8,419 | $154,500 | |
| Philadelphia, PA | No | 7,168 | $174,900 | |
| Phoenix, AZ | No | 10,982 | $149,000 | |
| Portland, OR | Yes | +1 point | 11,351 | $275,000 |
| Seattle, WA | No | 12,253 | $350,000 | |
| St. Louis, MO | No | 5,572 | $204,000 | |
| Tampa, FL | No | 3,259 | $140,000 | |
| Virginia Beach, VA | No | 3,911 | $165,000 | |
| Warren, MI | No | 3,389 | $114,999 | |
| Washington, D.C. | No | 36,824 | $499,000 |
*Note: Blanks in the change columns above indicate that the data was not statistically significant.
 United States
 Canada