
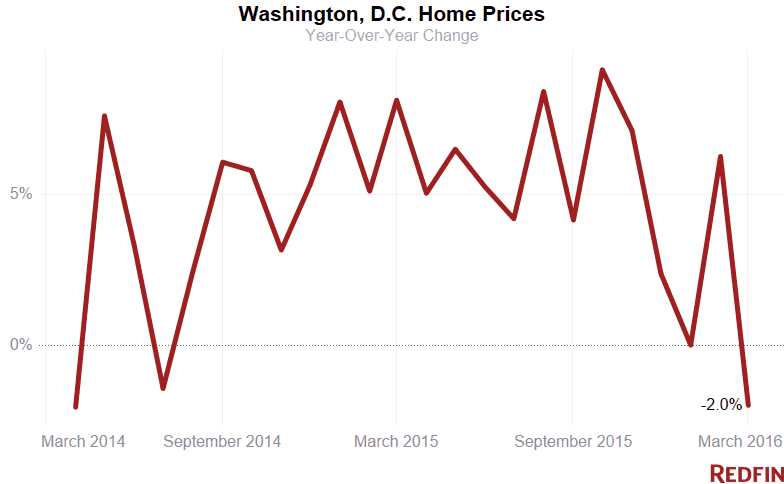
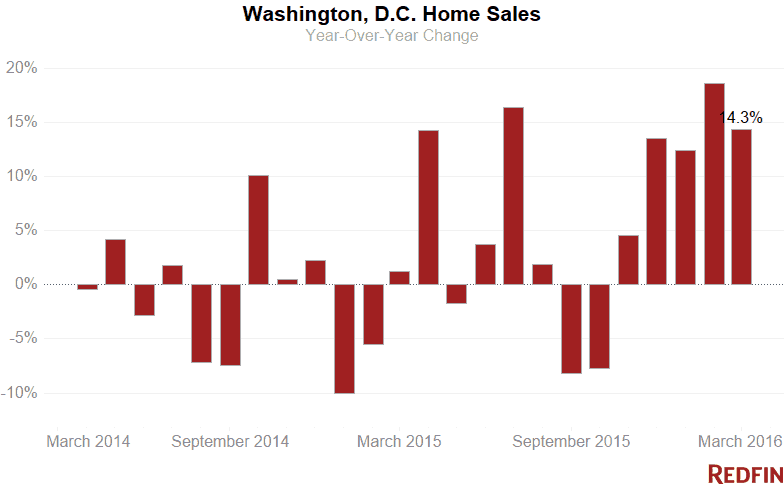
Washington, D.C., home prices fell 2 percent in March from a year earlier, with the typical home selling for nearly $487,500. The last time prices fell year over year in the District was July 2014. Sales surged 14.3 percent over the same period as buyers snapped up new listings.
Single-family homes and a small number of two-to-four-unit buildings led the price decline, falling 3.2 percent and 26.8 percent respectively. Townhome prices were up 3.3 percent and condos up 0.6 percent year over year.
“The price decline feels like more of an anomaly than a trend,” Redfin agent Sam Khosh said. “We’re still in a highly competitive market with desirable properties getting upward of 10 offers and going for well over asking price. Prices are continuing to appreciate in nearly all segments and neighborhoods.”
It is too early to tell whether or not price declines will be a permanent feature of the 2016 market. But early evidence suggests not: median list prices continue to rise (up 6.8 percent from a year ago) and more than a third of properties in the District sold above list price in March (same as last year).
With more homeowners planting new for-sale signs this spring, the number of properties on the market was up 6.2 percent from a year earlier. Still, buyers had little to chose from– the city had only a two-month supply of homes for sale, well below the six months that signals a balanced market. For historical perspective, only half as many homes were for sale this March than in March 2010.
Across the broader D.C., Maryland and Virginia region, the median sale price increased 1.4 percent from a year earlier to $355,000. Sales increased 0.6 percent year over year.
The number of homes for sale fell nearly 5 percent, despite a 16.6 percent increase in new listings compared to a year ago. The typical home found a buyer in about a month and more than a third of properties were off the market in two weeks or less.
Hot Neighborhoods
Prices jumped the most in some of D.C.’s most-affordable neighborhoods east of the river. Despite double-digit increases in Benning Heights/Capitol View/Marshall Heights (42.2%), Congress Heights (39.5%) and Fairlawn/Twining/Randle Highlands/Penn Branch (26.8%), the median sale price in each of these neighborhoods was about $260,000.
Prices fell in Foggy Bottom/West End (-38.1%), Woodley Park (-35.5 %) and Foxhall/Palisades/Spring Valley/Wesley Heights (-26.6%).
LeDroit Park was the fastest-moving neighborhood for the second month in a row, with the typical home finding a buyer in just seven days, followed by AU Park/Tenleytown (eight days) and Capitol Hill (10 days).
See our city page for the most up-to-date data on Washington-area home prices.
Here’s what’s happening in your neighborhood:
| Place | Median Sale Price | Year-Over-Year | Homes Sold | Year-Over-Year | Inventory | Year-Over-Year | New Listings | Median Days on Market | Avg Sale-to-List |
|---|---|---|---|---|---|---|---|---|---|
| 16th Street Heights | $645,000 | 12.7% | 29 | -19.4% | 22 | -4.3% | 36 | 15 | 99.4% |
| Adams Morgan / Kalorama Heights / Lanier Heights | $522,500 | 12.5% | 68 | 6.2% | 66 | 24.5% | 116 | 18.5 | 98.4% |
| Alexandria | $439,000 | 0.9% | 419 | -0.7% | 986 | 3.7% | 854 | 40 | 98.8% |
| American University Park / Friendship Heights / Tenleytown | $1,015,000 | 8.3% | 22 | -29.0% | 18 | -10.0% | 41 | 7.5 | 102.5% |
| Arlington | $536,000 | -4.3% | 222 | -9.0% | 556 | 2.4% | 431 | 22 | 99.1% |
| Atlas District | $650,000 | -7.3% | 43 | 43.3% | 32 | 28.0% | 74 | 33 | 99.4% |
| Bellevue / Congress Heights / Highlands | $225,500 | -7.2% | 34 | 13.3% | 40 | -13.0% | 46 | 40 | 98.8% |
| Benning Heights / Capitol View / Marshall Heights | $261,000 | 42.2% | 39 | -20.4% | 23 | -48.9% | 58 | 69.5 | 96.6% |
| Bethesda | $795,000 | -4.0% | 85 | 3.7% | 388 | 30.2% | 253 | 52 | 98.2% |
| Bloomingdale | $730,000 | 2.8% | 33 | 26.9% | 20 | 42.9% | 46 | 21 | 99.9% |
| Capitol Hill | $749,500 | -1.4% | 73 | 12.3% | 51 | 45.7% | 109 | 10 | 101.3% |
| Chevy Chase-DC | $935,000 | -8.2% | 41 | 57.7% | 17 | -29.2% | 50 | 13 | 100.9% |
| Chinatown / Mount Vernon Square / Penn Quarter | $476,000 | -6.1% | 61 | -11.6% | 63 | 12.5% | 102 | 11 | 99.5% |
| Cleveland Park | $361,000 | -22.0% | 20 | 5.3% | 18 | 157.1% | 27 | 40.5 | 99.3% |
| College Park | $265,000 | 51.4% | 15 | 36.4% | 17 | -37.0% | 21 | 49 | 98.4% |
| Columbia Heights | $569,800 | -8.8% | 73 | 5.8% | 90 | 119.5% | 171 | 15.5 | 100.7% |
| Congress Heights | $258,000 | 39.5% | 13 | -31.6% | 24 | 14.3% | 28 | 89 | 95.5% |
| Deanwood | $225,000 | 9.2% | 25 | 66.7% | 17 | -5.6% | 26 | 22.5 | 98.6% |
| Dupont Circle | $401,750 | -6.6% | 78 | 13.0% | 63 | 53.7% | 130 | 13 | 100.3% |
| Eckington | $520,750 | -9.8% | 18 | -18.2% | 20 | 100.0% | 34 | 48 | 101.2% |
| Edgewood | $529,500 | -6.2% | 24 | 100.0% | 13 | 18.2% | 31 | 37 | 100.7% |
| Fairlawn / Twining / Randle Highlands / Penn Branch | $260,000 | 26.8% | 29 | 3.6% | 36 | -2.7% | 55 | 48.5 | 98.7% |
| Foggy Bottom / George University / West End | $350,000 | -38.0% | 48 | 6.7% | 39 | -18.8% | 74 | 48 | 98.5% |
| Fort Totten / Lamont Riggs / Pleasant Hill / Queens Chapel | $350,000 | -2.8% | 44 | 76.0% | 15 | -34.8% | 47 | 26 | 100.0% |
| Foxhall / Palisades / Spring Valley / Wesley Heights | $890,000 | -26.6% | 43 | 30.3% | 55 | 14.6% | 71 | 40 | 98.0% |
| Georgetown | $1,250,000 | 0.1% | 64 | 23.1% | 46 | -16.4% | 77 | 37 | 98.2% |
| Glover Park / Cathedral Heights / McLean Gardens | $401,250 | 2.9% | 80 | 17.6% | 84 | 2.4% | 122 | 42 | 98.3% |
| Greenway / Benning / Dupont Park / River Terrace | $263,000 | 18.2% | 22 | 10.0% | 7 | -58.8% | 29 | 33.5 | 98.1% |
| Hill East | $699,500 | 11.9% | 52 | -1.9% | 25 | -16.7% | 67 | 14.5 | 100.7% |
| Historic Anacostia | $299,450 | -21.7% | 12 | 500.0% | 9 | 350.0% | 17 | 46 | 98.7% |
| Howard University / Le Droit Park | $645,765.5 | 9.1% | 46 | 15.0% | 25 | 31.6% | 76 | 7 | 100.8% |
| Kingman Park | $490,000 | 2.1% | 53 | 35.9% | 19 | -5.0% | 39 | 54 | 98.6% |
| Logan Circle-Shaw | $617,450 | -6.4% | 54 | -28.0% | 51 | 18.6% | 121 | 13 | 100.4% |
| Logan Circle-Shaw | $657,000 | -1.9% | 39 | -31.6% | 35 | 0.0% | 100 | 10.5 | 100.6% |
| Massachusetts Avenue Heights | $356,500 | -2.3% | 36 | 71.4% | 28 | -3.4% | 53 | 39 | 98.4% |
| Mount Pleasant | $537,499.5 | -18.6% | 22 | 57.1% | 9 | 80.0% | 28 | 42 | 99.6% |
| Navy Yard | $457,500 | -1.6% | 8 | -11.1% | 3 | 0.0% | 13 | 18 | 99.8% |
| NoMa | $650,000 | -3.7% | 15 | 50.0% | 18 | 260.0% | 37 | 30.5 | 98.5% |
| Petworth | $625,000 | 13.1% | 61 | -4.7% | 36 | 63.6% | 82 | 16 | 99.7% |
| Pleasant Plains | $520,000 | 15.6% | 32 | 18.5% | 15 | -6.2% | 48 | 23 | 100.8% |
| Rockville | $497,500 | 19.2% | 114 | 11.8% | 361 | -5.5% | 308 | 25 | 98.8% |
| Silver Spring | $360,000 | 0.0% | 225 | 43.3% | 519 | -16.0% | 426 | 36 | 99.2% |
| Southwest / Waterfront | $364,000 | 13.8% | 40 | -11.1% | 23 | 15.0% | 45 | 19 | 98.9% |
| Stanton Park | $650,000 | -4.1% | 85 | 32.8% | 42 | 13.5% | 108 | 19 | 99.9% |
| Takoma | $399,700 | 1.2% | 6 | 100.0% | 2 | 0.0% | 11 | 50 | 94.1% |
| Trinidad / Arboretum / Ivy City | $440,000 | -3.5% | 53 | 10.4% | 55 | 22.2% | 69 | 56.5 | 99.5% |
| Truxton Circle | $575,000 | -11.2% | 15 | -16.7% | 16 | 100.0% | 21 | 40 | 99.7% |
| Union Station / Kingman Park / Stanton Park | $599,950 | 5.6% | 128 | 50.6% | 74 | 37.0% | 169 | 35 | 99.3% |
| Van Ness / Forest Hills / Wakefield | $537,500 | 25.5% | 26 | 73.3% | 21 | -8.7% | 37 | 12 | 99.9% |
| Woodley Park | $292,000 | -35.5% | 8 | -27.3% | 7 | -22.2% | 18 | 18 | 100.6% |
| Woodridge | $645,000 | NA | 1 | NA | NA | NA | 1 | 23 | 97.0% |
| Woodridge-Fort Lincoln | $480,000 | -7.9% | 22 | -15.4% | 9 | -43.8% | 37 | 37.5 | 98.1% |
| Washington, DC | $487,500 | -2.0% | 688 | 14.3% | 1,355 | 6.2% | 1,200 | 21 | 99.7% |
NOTE: Not all neighborhoods are listed, but totals for Washington, D.C., encompass entire city. Data is based on listing information and might not reflect all real estate activity in the market. Neighborhood-specific data is measured over the three months ended March 31. Inventory measures listings active as of March. 31.
For more information, contact Redfin journalist services:
Phone: 206-588-6863
Email: press@redfin.com
See Redfin’s data center to find out what’s happening in other cities.
To be added to Redfin’s press release distribution list, subscribe here.


