
Key Takeaways:
- For the full year, 2017 home sales increased 1.7 percent over 2016, while prices gained 7.0 percent. The median 2017 sale price was $284,500.
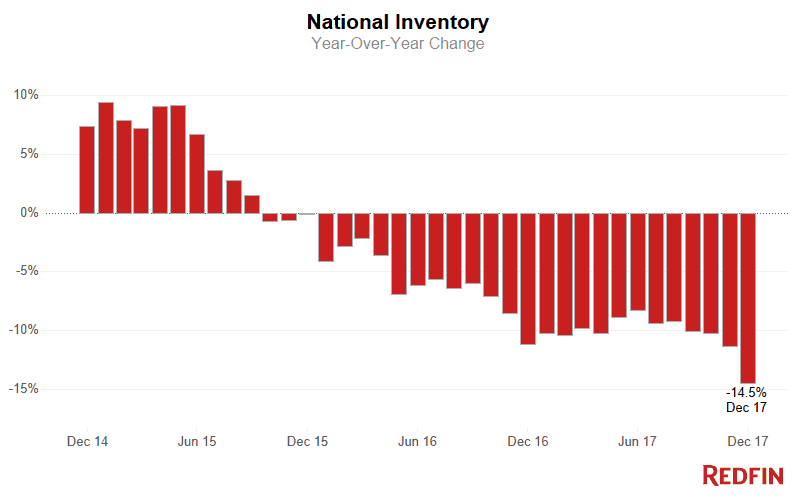
- National home prices rose 6.8 percent in December as inventory declined 14.5 percent.
- San Jose had the highest price growth and lowest supply of homes in December of all Redfin metros. December prices climbed 32 percent compared to last year as supply sunk to a record low of 0.5 months.
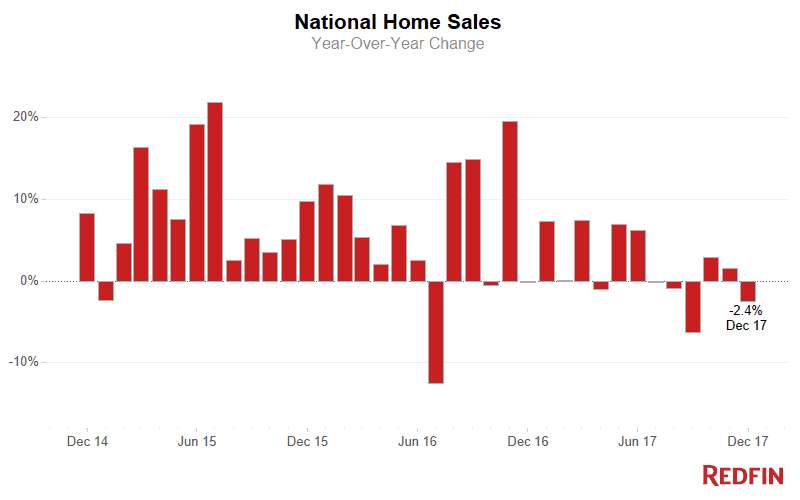
Home prices finished the year strong, up 6.8 percent in December from last year to a national median sale price of $287,000 across the markets Redfin serves. Sales were down 2.4 percent ending a year of fluctuating sales growth. The number of homes for sale declined 14.5 percent compared to a year ago, marking 27 months in a row of inventory declines.The typical home that sold in December found a buyer after 49 days on the market, five days fewer than 2016.
“Like last year, low inventory will be the biggest driver of the 2018 real estate market,” said Redfin chief economist Nela Richardson. “Major housing market dynamics don’t shift dramatically when the clock strikes midnight on Jan. 1. We anticipate a continuation of the same trends we’ve been seeing for the past few years. Price growth will remain strong as many homeowners will remain deterred from selling due to the low mortgage rates they’ve locked in and the high price of their would-be move-up home.”
| Market Summary | December 2018 | Month-Over-Month | Year-Over-Year |
|---|---|---|---|
| Median sale price | $286,700 | -1.3% | 6.8% |
| Homes sold | 218,700 | -0.5% | -2.4% |
| New listings | 147,100 | -29.5% | -3.0% |
| All Homes for sale | 568,000 | -14.0% | -14.5% |
| Median days on market | 49 | 3 | -5 |
| Months of supply | 2.6 | -0.4 | -0.4 |
| Sold above list | 20.5% | -1.5% | 0.5% |
| Median Off-Market Redfin Estimate | $250,600 | 0.7% | |
| Average Sale-to-list | 98.0% | -0.1% | 0.2% |
The number of homes newly listed for sale in December decreased 3.0 percent. With just 2.6 months of supply in December, the market was far below the six months of supply that represents balance between buyers and sellers.
Facing Lowest Supply on Record, San Jose Prices Rose 31.9 Percent Year Over Year
San Jose had only 0.5 months of supply in December, the lowest monthly supply Redfin has recorded in any metro area. This means that if the pace of home sales continued and no new homes were listed, it would only take about two weeks for all the homes currently for sale to find buyers. Seattle and Oakland also faced extremely tight markets with just 0.6 months of supply in December.
Unsurprisingly, San Jose was the fastest and most competitive market in December with the typical home finding a buyer in a median of 12 days, followed by Seattle and Oakland at 15 and 16 days respectively. More than three-quarters (76.2%) of San Jose homes sold above the list price. Of all the metro areas Redfin tracks, San Jose has had the steepest year-over-year price growth and inventory declines for three months in a row.
Redfin San Jose agent Kalena Masching says that despite the high prices (her market had a median sale price of $1.1 million in December) San Jose remains more affordable than San Francisco.
“Even highly-paid tech workers are priced out of San Francisco and moving to San Jose. This demand coupled with low inventory and job growth at the tech campuses in the South Bay has caused prices to soar.”
Median Redfin Estimate Was $251,000 in December
The median value of off-market homes in December was $250,600, as measured by the Redfin Estimate, up 0.7 percent from November. Consistent with November, 42.9 percent of homes listed for sale in December were priced higher than their concurrent Redfin Estimate, a measure of a home’s value and prediction of its eventual sale price. The median list price-to-Redfin Estimate ratio was 100.2 percent, which means the typical home for sale last month was priced in line with its estimated value.
Other December Highlights
Competition
- San Jose, CA was the fastest market for the third month in a row, with half of all homes pending sale in just 12 days, down from 39 days in December 2016. Seattle, WA and Oakland, CA were the next fastest markets at 15 and 16 median days on market, followed by Boston, MA (20) and San Francisco, CA (21).
- San Jose, CA was again the most competitive market with 76.2% of homes selling above list price, followed by 68.8% in San Francisco, CA, 62.1% in Oakland, CA, 40.2% in Seattle, WA, and 38.8% in Los Angeles, CA.
Prices
- San Jose, CA had the nation’s highest price growth for the third month in a row, rising 31.9% since last year to $1,108,000. Las Vegas, NV had the second highest growth at 17.3% year-over-year price growth, followed by Baton Rouge, LA (15.3%), Seattle, WA (15%), and San Francisco, CA (14.7%).
- 2 metros saw price declines in December: Albany, NY (-3.2%) and Camden, NJ (-0.7%).
Sales
- 5 out of 73 metros saw sales surge by double digits from last year. Camden, NJ led the nation in year-over-year sales growth, up 21.3%, followed by Louisville, KY, up 14.5%. Orlando, FL rounded out the top three with sales up 14.2% from a year ago.
- Cincinnati, OH saw the largest decline in sales since last year, falling 20.8%. Home sales in Portland, OR and Oxnard, CA both declined by 15.6%.
Inventory
- San Jose, CA had the largest decrease in overall inventory for the third month in a row, falling 51.5% since last December. Oakland, CA (-36.4%), Seattle, WA (-34.0%), and Atlanta, GA (-33.1%) also saw far fewer homes available on the market than a year ago.
- Baton Rouge, LA had the highest increase in the number of homes for sale, up 12.8% year over year, followed by New Orleans, LA (6.8%) and Austin, TX (5.2%).
Methodology
The Redfin Real-Time Housing Market Tracker is a monthly analysis of home prices, competition, sales volumes and inventory levels across the markets that Redfin serves nationwide. The analysis is based on data from the Multiple Listing Services of which Redfin is a member. The monthly data may change after publishing as additional real estate transactions are recorded.
Below are market-by-market breakdowns for prices, inventory, new listings and sales for markets with populations of 750 thousand or more. For downloadable data on all of the markets Redfin tracks, visit the Redfin Data Center.
Median Sale Price
| Redfin Metro | Median Sale Price | Month-Over-Month | Year-Over-Year |
|---|---|---|---|
| Albany, NY | $184,000 | -7.1% | -3.2% |
| Allentown, PA | $181,000 | -1.9% | 1.7% |
| Atlanta, GA | $221,400 | 5.2% | 8.0% |
| Austin, TX | $307,500 | 4.4% | 6.1% |
| Bakersfield, CA | $220,000 | -2.0% | 4.5% |
| Baltimore, MD | $249,900 | -3.8% | 0.0% |
| Baton Rouge, LA | $203,900 | 2.7% | 15.3% |
| Birmingham, AL | $190,000 | 6.1% | 9.2% |
| Boston, MA | $452,800 | 0.6% | 8.2% |
| Buffalo, NY | $141,000 | 0.7% | 10.2% |
| Camden, NJ | $166,500 | 0.9% | -0.7% |
| Charlotte, NC | $235,000 | 4.4% | 12.2% |
| Chicago, IL | $220,000 | -1.3% | 2.3% |
| Cincinnati, OH | $156,000 | -8.3% | 4.0% |
| Cleveland, OH | $135,000 | -6.2% | 5.9% |
| Columbus, OH | $194,400 | 5.1% | 14.4% |
| Dallas, TX | $285,000 | 1.8% | 9.3% |
| Denver, CO | $380,000 | 2.7% | 9.8% |
| Detroit, MI | $119,000 | -1.7% | 13.3% |
| Fort Lauderdale, FL | $250,000 | 1.7% | 11.1% |
| Fort Worth, TX | $227,100 | 3.3% | 8.2% |
| Fresno, CA | $255,000 | -0.8% | 8.5% |
| Grand Rapids, MI | $175,000 | -2.7% | 8.0% |
| Greenville, SC | $189,000 | -0.5% | 8.0% |
| Hampton Roads, VA | $220,000 | -0.5% | 2.3% |
| Honolulu, HI | $590,000 | -0.8% | 8.9% |
| Houston, TX | $230,000 | 2.1% | 1.1% |
| Indianapolis, IN | $162,500 | -1.5% | 6.9% |
| Jacksonville, FL | $216,000 | 3.5% | 9.1% |
| Kansas City, MO | $192,500 | -1.3% | 7.0% |
| Knoxville, TN | $183,400 | -1.8% | 11.1% |
| Las Vegas, NV | $252,200 | 1.7% | 17.3% |
| Long Island, NY | $420,000 | 0.0% | 4.5% |
| Los Angeles, CA | $585,000 | -0.6% | 9.3% |
| Louisville, KY | $180,000 | 0.1% | 5.9% |
| Memphis, TN | $169,000 | 4.9% | 7.6% |
| Miami, FL | $282,000 | 1.5% | 10.6% |
| Milwaukee, WI | $186,000 | -2.1% | 6.0% |
| Minneapolis, MN | $247,400 | 1.0% | 7.6% |
| Montgomery County, PA | $295,000 | 1.7% | 8.3% |
| Nashville, TN | $279,800 | 1.9% | 8.7% |
| New Orleans, LA | $209,000 | 4.5% | 13.0% |
| Oakland, CA | $668,000 | -3.2% | 11.3% |
| Oklahoma City, OK | $159,900 | -0.7% | 1.8% |
| Omaha, NE | $175,000 | -1.7% | 2.3% |
| Orange County, CA | $661,000 | -2.1% | 4.1% |
| Orlando, FL | $238,000 | 6.3% | 13.9% |
| Oxnard, CA | $593,100 | -1.1% | 10.9% |
| Philadelphia, PA | $189,100 | 2.2% | 8.0% |
| Phoenix, AZ | $247,000 | 0.0% | 7.9% |
| Pittsburgh, PA | $147,000 | -5.2% | 0.5% |
| Portland, OR | $370,000 | 0.5% | 9.1% |
| Providence, RI | $250,000 | -3.5% | 6.4% |
| Raleigh, NC | $270,000 | 0.7% | 4.3% |
| Richmond, VA | $237,000 | 2.4% | 8.5% |
| Riverside, CA | $349,500 | 3.1% | 7.5% |
| Rochester, NY | $130,000 | 0.0% | 0.0% |
| Sacramento, CA | $370,000 | -1.3% | 9.1% |
| Salt Lake City, UT | $290,000 | -3.3% | 9.5% |
| San Antonio, TX | $215,000 | 1.5% | 3.9% |
| San Diego, CA | $547,500 | -0.5% | 8.4% |
| San Francisco, CA | $1,325,000 | -1.3% | 14.7% |
| San Jose, CA | $1,108,000 | 3.1% | 31.9% |
| Seattle, WA | $530,000 | 0.9% | 15.0% |
| St. Louis, MO | $167,000 | -0.9% | 2.5% |
| Tacoma, WA | $317,000 | 1.8% | 11.2% |
| Tampa, FL | $215,000 | 0.0% | 8.9% |
| Tucson, AZ | $206,500 | 0.2% | 14.1% |
| Tulsa, OK | $165,500 | 5.4% | 8.5% |
| Warren, MI | $190,000 | 0.0% | 5.6% |
| Washington, DC | $380,000 | 0.0% | 0.0% |
| West Palm Beach, FL | $270,000 | 3.8% | 10.2% |
| Worcester, MA | $254,400 | -1.1% | 6.0% |
| National | $286,700 | -1.3% | 6.8% |
Homes Sold
| Redfin Metro | Homes Sold | Month-Over-Month | Year-Over-Year |
|---|---|---|---|
| Albany, NY | 827 | 0.1% | -4.2% |
| Allentown, PA | 644 | -13.9% | -5.6% |
| Atlanta, GA | 8,744 | 8.2% | -5.5% |
| Austin, TX | 2,746 | 17.5% | 7.3% |
| Bakersfield, CA | 667 | -2.6% | -1.6% |
| Baltimore, MD | 3,632 | 6.9% | 4.8% |
| Baton Rouge, LA | 787 | -0.8% | -11.5% |
| Birmingham, AL | 1,110 | -5.5% | 0.0% |
| Boston, MA | 3,848 | -13.6% | -11.4% |
| Buffalo, NY | 961 | -3.8% | -6.8% |
| Camden, NJ | 1,543 | -16.5% | 21.3% |
| Charlotte, NC | 2,908 | -5.4% | -9.9% |
| Chicago, IL | 8,691 | 16.9% | 7.5% |
| Cincinnati, OH | 1,713 | -10.9% | -20.8% |
| Cleveland, OH | 2,145 | -6.0% | -1.2% |
| Columbus, OH | 2,352 | 0.2% | -0.9% |
| Dallas, TX | 4,951 | 3.2% | 1.2% |
| Denver, CO | 4,395 | 2.3% | -5.6% |
| Detroit, MI | 1,557 | -25.4% | 1.4% |
| Fort Lauderdale, FL | 2,943 | 19.7% | -6.6% |
| Fort Worth, TX | 2,544 | 2.3% | -3.2% |
| Fresno, CA | 685 | -4.5% | -12.3% |
| Grand Rapids, MI | 1,173 | -5.3% | -6.4% |
| Greenville, SC | 1,062 | 18.7% | 6.2% |
| Hampton Roads, VA | 1,857 | 7.8% | 3.9% |
| Honolulu, HI | 811 | -13.4% | -5.5% |
| Houston, TX | 6,922 | 7.5% | 1.4% |
| Indianapolis, IN | 2,466 | -4.0% | -2.6% |
| Jacksonville, FL | 2,228 | 12.1% | 8.4% |
| Kansas City, MO | 2,539 | -7.9% | -5.3% |
| Knoxville, TN | 1,011 | -10.2% | -6.0% |
| Las Vegas, NV | 3,150 | -1.0% | -8.0% |
| Long Island, NY | 2,241 | -20.0% | -13.2% |
| Los Angeles, CA | 5,935 | 0.1% | -6.2% |
| Louisville, KY | 1,336 | 16.6% | 14.5% |
| Memphis, TN | 1,052 | -5.7% | -2.9% |
| Miami, FL | 2,549 | 11.7% | -4.4% |
| Milwaukee, WI | 1,317 | -16.0% | -3.1% |
| Minneapolis, MN | 4,071 | -21.0% | -14.3% |
| Montgomery County, PA | 2,109 | -3.3% | -3.4% |
| Nashville, TN | 3,016 | 0.6% | -5.5% |
| New Orleans, LA | 1,085 | 11.1% | 4.4% |
| Oakland, CA | 2,029 | -14.0% | -7.6% |
| Oklahoma City, OK | 1,503 | -1.7% | 2.5% |
| Omaha, NE | 982 | -0.4% | -11.5% |
| Orange County, CA | 2,247 | -7.3% | -9.3% |
| Orlando, FL | 3,992 | 29.3% | 14.2% |
| Oxnard, CA | 596 | -11.4% | -15.6% |
| Philadelphia, PA | 1,966 | -3.3% | -3.4% |
| Phoenix, AZ | 7,015 | -1.4% | -0.4% |
| Pittsburgh, PA | 1,928 | -0.3% | 2.5% |
| Portland, OR | 2,859 | -6.4% | -15.6% |
| Providence, RI | 1,703 | -3.1% | -3.0% |
| Raleigh, NC | 2,073 | 2.4% | 2.8% |
| Richmond, VA | 1,553 | 14.9% | 10.6% |
| Riverside, CA | 4,527 | 1.3% | -3.8% |
| Rochester, NY | 942 | -0.2% | -7.0% |
| Sacramento, CA | 2,450 | -4.0% | -10.5% |
| Salt Lake City, UT | 1,419 | -8.8% | -1.6% |
| San Antonio, TX | 2,096 | 0.8% | -9.0% |
| San Diego, CA | 2,641 | -5.6% | -9.3% |
| San Francisco, CA | 825 | -22.6% | -9.7% |
| San Jose, CA | 1,037 | -14.2% | -8.1% |
| Seattle, WA | 3,789 | -7.9% | -1.1% |
| St. Louis, MO | 3,058 | -5.1% | -4.0% |
| Tacoma, WA | 1,283 | -8.4% | -3.7% |
| Tampa, FL | 5,697 | 28.8% | 12.4% |
| Tucson, AZ | 1,155 | -7.8% | -10.3% |
| Tulsa, OK | 962 | 17.2% | 8.0% |
| Warren, MI | 3,005 | -21.9% | -7.0% |
| Washington, DC | 6,755 | -6.0% | 0.6% |
| West Palm Beach, FL | 2,590 | 12.8% | -4.0% |
| Worcester, MA | 891 | -7.2% | 3.1% |
| National | 218,700 | -0.5% | -2.4% |
New Listings
| Redfin Metro | New Listings | Month-Over-Month | Year-Over-Year |
|---|---|---|---|
| Albany, NY | 470 | -32.5% | -4.7% |
| Albuquerque, NM | 702 | -25.2% | -1.0% |
| Allentown, PA | 490 | -35.6% | 2.5% |
| Atlanta, GA | 5,564 | -28.4% | 6.6% |
| Austin, TX | 1,738 | -27.2% | 6.6% |
| Bakersfield, CA | 518 | -25.5% | -1.0% |
| Baltimore, MD | 2,167 | -31.2% | -7.6% |
| Baton Rouge, LA | 634 | -22.8% | -16.1% |
| Birmingham, AL | 700 | -30.7% | -19.5% |
| Boston, MA | 1,628 | -52.6% | -8.3% |
| Buffalo, NY | 527 | -34.8% | 0.6% |
| Camden, NJ | 1,287 | -22.1% | 1.6% |
| Charlotte, NC | 1,873 | -31.8% | -2.2% |
| Chicago, IL | 4,739 | -31.6% | -9.7% |
| Cincinnati, OH | 1,070 | -35.1% | -5.0% |
| Cleveland, OH | 1,379 | -30.9% | -2.9% |
| Columbus, OH | 1,366 | -28.1% | 0.0% |
| Dallas, TX | 3,385 | -27.2% | 1.1% |
| Denver, CO | 2,042 | -37.4% | -11.3% |
| Detroit, MI | 1,372 | -24.4% | 4.3% |
| Fort Lauderdale, FL | 2,910 | -19.1% | -7.1% |
| Fort Worth, TX | 1,877 | -22.4% | -0.3% |
| Fresno, CA | 481 | -30.9% | -9.8% |
| Grand Rapids, MI | 641 | -37.0% | -0.8% |
| Greenville, SC | 632 | -34.6% | -5.1% |
| Hampton Roads, VA | 1,374 | -24.4% | 5.4% |
| Honolulu, HI | 607 | -35.6% | -0.5% |
| Houston, TX | 4,948 | -28.0% | -3.5% |
| Indianapolis, IN | 1,485 | -28.5% | -2.2% |
| Jacksonville, FL | 1,582 | -22.6% | -3.4% |
| Kansas City, MO | 1,795 | -24.5% | 17.6% |
| Knoxville, TN | 769 | -26.0% | 9.9% |
| Las Vegas, NV | 2,395 | -20.8% | -3.7% |
| Long Island, NY | 1,461 | -36.4% | -0.3% |
| Los Angeles, CA | 3,525 | -36.6% | -8.8% |
| Louisville, KY | 714 | -34.4% | -8.9% |
| Memphis, TN | 745 | -28.4% | 5.5% |
| Miami, FL | 3,125 | -20.8% | -2.8% |
| Milwaukee, WI | 664 | -36.6% | -1.9% |
| Minneapolis, MN | 1,906 | -34.8% | -5.6% |
| Montgomery County, PA | 948 | -42.9% | -15.8% |
| Nashville, TN | 2,240 | -25.3% | 5.4% |
| New Orleans, LA | 916 | -25.3% | -0.3% |
| Oakland, CA | 968 | -43.6% | -5.4% |
| Oklahoma City, OK | 1,227 | -22.8% | 0.9% |
| Omaha, NE | 661 | -21.3% | 22.4% |
| Orange County, CA | 1,316 | -35.5% | -5.4% |
| Orlando, FL | 2,839 | -20.7% | 0.4% |
| Oxnard, CA | 385 | -40.2% | -8.3% |
| Philadelphia, PA | 1,373 | -30.3% | -8.6% |
| Phoenix, AZ | 5,464 | -28.5% | -5.8% |
| Pittsburgh, PA | 1,089 | -28.3% | -0.5% |
| Portland, OR | 1,581 | -31.6% | 7.8% |
| Providence, RI | 890 | -38.1% | -7.9% |
| Raleigh, NC | 1,245 | -24.2% | -1.4% |
| Richmond, VA | 795 | -32.4% | -9.7% |
| Riverside, CA | 3,422 | -31.6% | -1.5% |
| Rochester, NY | 504 | -31.7% | -10.5% |
| Sacramento, CA | 1,507 | -31.6% | 2.4% |
| Salt Lake City, UT | 918 | -34.6% | -3.7% |
| San Antonio, TX | 1,690 | -23.4% | -10.8% |
| San Diego, CA | 1,676 | -36.9% | -6.8% |
| San Francisco, CA | 310 | -55.3% | 2.0% |
| San Jose, CA | 509 | -44.9% | 19.5% |
| Seattle, WA | 1,613 | -42.2% | -10.9% |
| St. Louis, MO | 2,031 | -33.8% | -6.4% |
| Tacoma, WA | 806 | -15.6% | 10.3% |
| Tampa, FL | 4,066 | -21.7% | -7.5% |
| Tucson, AZ | 996 | -23.2% | -6.5% |
| Tulsa, OK | 758 | -23.1% | 3.8% |
| Warren, MI | 1,782 | -33.4% | -7.4% |
| Washington, DC | 3,864 | -33.6% | -14.2% |
| West Palm Beach, FL | 2,973 | -20.7% | -1.6% |
| Worcester, MA | 460 | -37.2% | 10.8% |
| National | 147,100 | -29.5% | -3.0% |
All Homes for Sale
| Redfin Metro | All Homes for Sale | Month-Over-Month | Year-Over-Year |
|---|---|---|---|
| Albany, NY | 2,389 | -12.4% | -28.3% |
| Albuquerque, NM | 2,839 | -34.8% | -27.1% |
| Allentown, PA | 2,127 | -13.8% | -21.6% |
| Atlanta, GA | 20,633 | -11.4% | -33.1% |
| Austin, TX | 5,892 | -15.2% | 5.2% |
| Bakersfield, CA | 1,705 | -14.5% | -16.6% |
| Baltimore, MD | 8,299 | -15.6% | -16.8% |
| Baton Rouge, LA | 3,171 | -5.6% | 12.8% |
| Birmingham, AL | 4,313 | -11.6% | -15.1% |
| Boston, MA | 4,676 | -31.3% | -24.8% |
| Buffalo, NY | 1,714 | -14.1% | -32.4% |
| Camden, NJ | 6,681 | -8.2% | -5.7% |
| Charlotte, NC | 9,295 | -12.7% | -4.9% |
| Chicago, IL | 27,453 | -18.1% | -15.8% |
| Cincinnati, OH | 5,760 | -15.5% | -12.3% |
| Cleveland, OH | 6,913 | -15.3% | -15.3% |
| Columbus, OH | 4,541 | -20.9% | -17.6% |
| Dallas, TX | 9,901 | -23.7% | -0.5% |
| Denver, CO | 3,966 | -25.2% | -20.1% |
| Detroit, MI | 4,004 | -10.8% | -6.9% |
| Fort Lauderdale, FL | 11,940 | -7.2% | -12.2% |
| Fort Worth, TX | 4,771 | -18.3% | -11.9% |
| Fresno, CA | 1,271 | -16.1% | -18.9% |
| Grand Rapids, MI | 1,968 | -18.1% | -11.7% |
| Greenville, SC | 3,265 | -11.9% | -8.4% |
| Hampton Roads, VA | 6,503 | -11.2% | -11.0% |
| Honolulu, HI | 2,627 | -11.0% | 2.2% |
| Houston, TX | 20,771 | -12.5% | -6.2% |
| Indianapolis, IN | 5,332 | -16.2% | -24.6% |
| Jacksonville, FL | 5,443 | -9.4% | -15.0% |
| Knoxville, TN | 3,965 | -9.0% | -9.8% |
| Las Vegas, NV | 7,867 | -13.0% | -26.1% |
| Long Island, NY | 8,340 | -11.5% | -14.7% |
| Los Angeles, CA | 10,895 | -23.3% | -25.5% |
| Louisville, KY | 2,582 | -17.2% | -11.5% |
| Memphis, TN | 2,682 | -14.0% | -18.9% |
| Miami, FL | 17,087 | -3.6% | -5.6% |
| Milwaukee, WI | 3,985 | -19.3% | -20.2% |
| Minneapolis, MN | 6,722 | -23.4% | -24.0% |
| Montgomery County, PA | 5,719 | -18.8% | -9.5% |
| Nashville, TN | 8,107 | -11.7% | 1.4% |
| New Orleans, LA | 5,555 | -4.2% | 6.8% |
| Oakland, CA | 1,184 | -40.9% | -36.4% |
| Oklahoma City, OK | 5,325 | -8.7% | -10.9% |
| Omaha, NE | 1,667 | -11.9% | -10.5% |
| Orange County, CA | 4,493 | -24.4% | -25.0% |
| Orlando, FL | 8,326 | -12.1% | -19.3% |
| Oxnard, CA | 1,115 | -19.7% | -22.4% |
| Philadelphia, PA | 6,226 | -14.0% | -12.4% |
| Phoenix, AZ | 17,638 | -11.7% | -16.6% |
| Pittsburgh, PA | 8,078 | -12.3% | -14.5% |
| Portland, OR | 4,280 | -16.3% | -7.7% |
| Providence, RI | 4,137 | -19.2% | -19.2% |
| Raleigh, NC | 5,384 | -12.4% | -0.4% |
| Richmond, VA | 2,735 | -17.1% | -19.4% |
| Riverside, CA | 12,286 | -13.6% | -21.3% |
| Rochester, NY | 1,682 | -16.0% | -31.4% |
| Sacramento, CA | 3,258 | -26.2% | -17.4% |
| Salt Lake City, UT | 2,632 | -31.5% | -9.5% |
| San Antonio, TX | 6,744 | -13.5% | -4.4% |
| San Diego, CA | 4,048 | -20.1% | -19.2% |
| San Francisco, CA | 553 | -49.2% | -31.6% |
| San Jose, CA | 528 | -41.7% | -51.5% |
| Seattle, WA | 2,254 | -35.4% | -34.0% |
| St. Louis, MO | 9,623 | -18.2% | -8.9% |
| Tacoma, WA | 1,567 | -18.0% | -23.7% |
| Tampa, FL | 11,258 | -7.5% | -17.8% |
| Tucson, AZ | 4,044 | -10.2% | -9.0% |
| Tulsa, OK | 3,562 | -7.4% | -8.1% |
| Warren, MI | 5,980 | -17.3% | -18.4% |
| Washington, DC | 12,316 | -20.6% | -15.6% |
| West Palm Beach, FL | 13,512 | -3.2% | -4.1% |
| Worcester, MA | 1,468 | -22.0% | -25.9% |
| National | 568,000 | -14.0% | -14.5% |
Median Off-Market Redfin Estimate
| Redfin Metro | Estimate | Month-Over-Month |
|---|---|---|
| Albany, NY | $204,600 | 1.0% |
| Allentown, PA | $194,400 | 0.4% |
| Atlanta, GA | $188,900 | 0.5% |
| Austin, TX | $288,100 | -0.3% |
| Bakersfield, CA | $198,400 | 0.4% |
| Baltimore, MD | $243,800 | 0.4% |
| Baton Rouge, LA | $152,300 | 0.7% |
| Birmingham, AL | $138,200 | 0.8% |
| Boston, MA | $455,700 | 0.6% |
| Buffalo, NY | $145,200 | 1.4% |
| Camden, NJ | $185,900 | 0.6% |
| Charlotte, NC | $174,000 | 1.3% |
| Chicago, IL | $231,000 | 0.6% |
| Cincinnati, OH | $152,700 | 0.6% |
| Cleveland, OH | $129,600 | 0.7% |
| Columbus, OH | $167,700 | 0.9% |
| Dallas, TX | $233,800 | 0.7% |
| Denver, CO | $373,800 | 0.5% |
| Detroit, MI | $80,700 | 3.0% |
| Fort Lauderdale, FL | $237,600 | 0.7% |
| Fort Worth, TX | $189,700 | 0.8% |
| Fresno, CA | $231,800 | 1.3% |
| Grand Rapids, MI | $145,400 | 0.1% |
| Greenville, SC | $151,600 | 0.8% |
| Hampton Roads, VA | $212,700 | 0.3% |
| Honolulu, HI | $662,600 | 0.2% |
| Houston, TX | $191,700 | 0.4% |
| Indianapolis, IN | $144,400 | 1.0% |
| Jacksonville, FL | $193,000 | 1.8% |
| Kansas City, MO | $170,600 | 1.3% |
| Knoxville, TN | $135,600 | 0.8% |
| Las Vegas, NV | $228,800 | 1.6% |
| Long Island, NY | $410,200 | 1.1% |
| Los Angeles, CA | $574,100 | 0.8% |
| Louisville, KY | $154,300 | 0.6% |
| Memphis, TN | $122,900 | 1.5% |
| Miami, FL | $271,500 | 0.5% |
| Milwaukee, WI | $189,100 | 0.6% |
| Minneapolis, MN | $240,200 | 0.6% |
| Montgomery County, PA | $304,300 | 0.5% |
| Nashville, TN | $219,000 | 1.1% |
| New Orleans, LA | $175,200 | 0.6% |
| Oakland, CA | $701,800 | 0.6% |
| Oklahoma City, OK | $135,200 | -0.8% |
| Omaha, NE | $156,800 | 0.2% |
| Orange County, CA | $670,000 | 0.7% |
| Orlando, FL | $207,700 | 0.8% |
| Oxnard, CA | $571,000 | 0.7% |
| Philadelphia, PA | $182,100 | 0.2% |
| Phoenix, AZ | $244,200 | 0.6% |
| Pittsburgh, PA | $134,900 | 0.2% |
| Portland, OR | $369,200 | -1.1% |
| Providence, RI | $275,000 | 1.2% |
| Raleigh, NC | $242,500 | 0.5% |
| Richmond, VA | $205,800 | 0.5% |
| Riverside, CA | $332,100 | 0.8% |
| Rochester, NY | $135,400 | 0.8% |
| Sacramento, CA | $375,400 | 0.5% |
| Salt Lake City, UT | $292,300 | 0.9% |
| San Antonio, TX | $175,200 | 0.6% |
| San Diego, CA | $551,500 | 0.6% |
| San Francisco, CA | $1,200,400 | 0.2% |
| San Jose, CA | $1,037,700 | 1.4% |
| Seattle, WA | $503,500 | 1.1% |
| St. Louis, MO | $146,400 | 1.2% |
| Tacoma, WA | $304,000 | 1.0% |
| Tampa, FL | $195,100 | 0.7% |
| Tucson, AZ | $189,000 | 0.7% |
| Tulsa, OK | $133,500 | -0.7% |
| Warren, MI | $194,900 | 1.0% |
| Washington, DC | $371,300 | 0.3% |
| West Palm Beach, FL | $245,600 | 0.3% |
| Worcester, MA | $262,600 | 0.9% |
| National | $250,600 | 0.7% |


