
Sales Rebounded, up 4.1%, as Inventory Declined Just 5.4% from Last Year
San Jose, Seattle and Portland Posted Double-Digit Inventory Increases for the Second Month in a Row
*This report was updated on August 30.
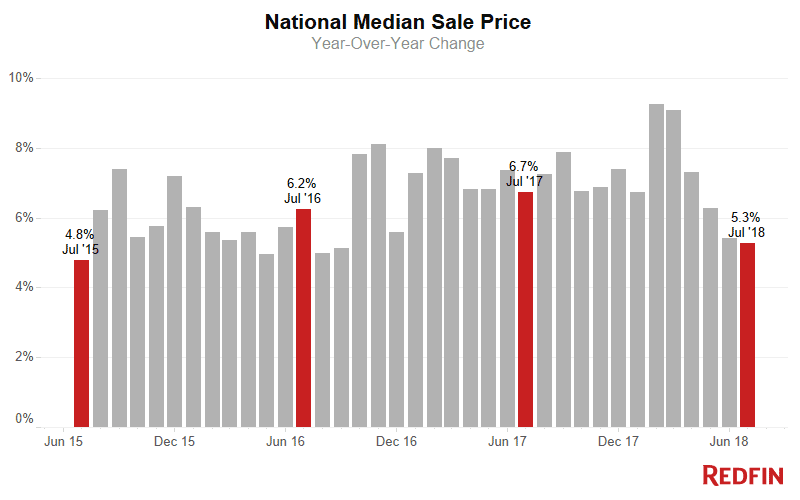
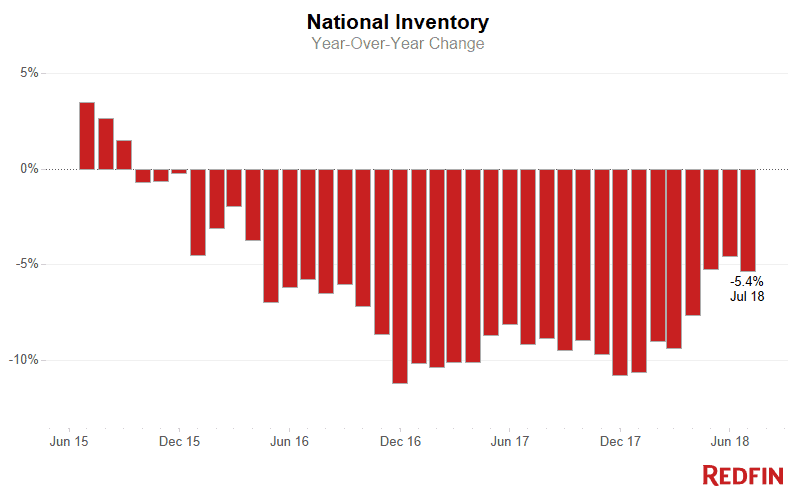
U.S. home-sale prices increased 5.3 percent in July to a median of $307,400, compared to a year ago. The price growth rate has been dropping for five consecutive months and has not been this low since September 2016. Homes sales increased 4.1 percent in July compared to July 2017 as inventory declines continued to moderate.
The number of homes for sale in July was down 5.4 percent year over year. This marks the third month of supply declines around 5 percent following 19 months of inventory declines of over 7 percent.
Homes that sold in July went under contract in a median 35 days, three days faster than last year and one day slower than in June. While homes are still selling near a record-fast pace, there are some signs competition is waning. For the first time since March 2015, the share of homes that sold above asking price declined year over year– albeit slightly– from 26.5 in July 2017 to 26.2 percent last month. Twenty-eight percent of homes on the market in July had a price drop, the largest share on record since Redfin began tracking this metric in 2009, and a 3.2 percentage-point increase over last July. It’s worth noting that the share of homes with price drops typically peaks each year in July or August.
Metro Trends
For the second month in a row, inventory increased year over year by double digits in San Jose, California, (28.0%) Seattle (27.0%) and Portland, Oregon, (21.8%). These markets also experienced sales declines of 11.9 percent, 6.4 percent and 6.1 percent, respectively. In Portland, homes took a median 15 days on market (DOM) to sell, a full week longer than last July. In San Jose (16 DOM) and Seattle (9 DOM), it took one and two days longer, respectively, for homes to find a buyer this July compared to last year.
Home prices continued to rise in these metros year over year, but they are rising at a slower rate. In Portland, home prices were up 4 percent year over year, the lowest price growth in 41 months. Seattle home prices increased 8 percent compared with last year, the lowest growth in 27 months. San Jose home prices grew 19.3 percent. While still the highest growth of any metro Redfin tracks, this was the lowest price growth San Jose has seen in nine months.
Taylor Marr, Redfin senior economist, said, “The Bay Area, Seattle and Portland have been so competitive for so long that buyers and sellers have adjusted to those conditions and may feel uneasy about the changes we’re seeing in the market. After several years of shrinking inventory and unsustainable price growth, I’m encouraged by these changes as a signal that we may be returning to a healthier, more balanced market.”
While these hot coastal markets are showing signs of cooling, competition is heating up in some smaller, inland metros. In Indianapolis the typical home that sold in July found a buyer in 10 days, 25 days faster than last July. In Atlanta (23 DOM); Rochester, New York (15 DOM); Buffalo, New York (14 DOM); and Knoxville, Tennessee (55 DOM), homes sold more than two weeks faster this year compared to last year.
Jake Johnson, Redfin’s market manager in Indianapolis, said a drastic year-over-year decline in inventory (-27.6%) is causing competition to escalate. “We’re caught in the cycle where sellers are afraid to list because they aren’t sure if they’ll find a home to buy. In popular neighborhoods, homes that would have received two or three offers last year are getting eight to 10. Homes in the $250,000 to $350,000 price range are going under contract within days. Because Indianapolis hasn’t traditionally been a hot market, we’re educating buyers about how the market is changing and how we can craft an offer to win in a bidding war.”
| Market Summary | July 2018 | Month-Over-Month | Year-Over-Year |
| Median sale price | $307,400 | -1.4% | 5.3% |
| Homes sold | 277,100 | -8.2% | 4.1% |
| New listings | 319,000 | -8.2% | 2.8% |
| All Homes for sale | 747,200 | -1.1% | -5.4% |
| Median days on market | 35 | 1 | -3 |
| Months of supply | 2.7 | 0.2 | -0.3 |
| Sold above list | 26.2% | -1.7% | -0.3% |
| Median Off-Market Redfin Estimate | $292,800 | 0.1% | 7.8% |
| Average Sale-to-list | 98.6% | -0.3% | 0.0% |
Other July Highlights
Speed and Competition
- Grand Rapids, MI was the fastest market, with half of all homes pending sale in just 8 days, down from 11 days from a year earlier. Boston, Denver and Seattle were the next fastest markets with 9 median days on market, followed by Indianapolis (10).
- The most competitive market in July was San Francisco where 76.3% of homes sold above list price, followed by 71.7% in San Jose, CA, 70.0% in Oakland, CA, 51.3% in Tacoma, WA, and 50.8% in Boston.
Prices
- San Jose, CA had the nation’s highest price growth, rising 19.3% since last year to $1,163,500. Detroit had the second highest growth at 15% year-over-year price growth, followed by Tacoma, WA (12.7%), Memphis, TN (12.5%), and Salt Lake City (12.2%).
- 2 metros saw price declines in July: Camden, NJ (-0.9%), and Baltimore (-0.5%).
Sales
- 12 out of 72 metros saw sales surge by double digits from last year. Camden, NJ led the nation in year-over-year sales growth, up 40.8%, followed by Oklahoma City, up 20.1% from a year ago.
- Miami saw the largest decline in sales since last year, falling 17.9%. Home sales in Buffalo, NY and San Jose, CA declined by 12.9% and 11.9%, respectively.
Inventory
- San Jose, CA had the highest increase in the number of homes for sale, up 28.0% year over year, followed by Seattle (27.0%) and Portland, OR (21.8%).
- Las Vegas had the largest decrease in overall inventory, falling 33.6% since last July. Albuquerque, NM (-32.1%), Indianapolis (-27.6%), and Rochester, NY (-26.2%) also saw far fewer homes available on the market than a year ago.
Redfin Estimate
- The median list price-to-Redfin Estimate ratio was 92.5% in San Francisco, CA, the lowest of any market. This indicates the typical home for sale in July was listed below its estimated value. Only 5.9% of homes in San Francisco, CA were listed for more than their Redfin Estimate.
- Conversely, the median list price-to-Redfin Estimate ratio was 102.3% in Miami, FL and 102.0% in West Palm Beach, FL, which means sellers are listing their homes for more than the estimated value in those metro areas. In Miami, FL, 84.4% of homes were listed above their Redfin Estimate, the highest percentage of any metro.
Below are market-by-market breakdowns for prices, inventory, new listings and sales for markets with populations of 750 thousand or more. For downloadable data on all of the markets Redfin tracks, visit the Redfin Data Center.
*CORRECTION: We have temporarily removed data for the Washington, D.C. and Baltimore metro areas from this report. The July data that Redfin initially reported for those markets was inaccurate due to an engineering problem related to the MLS data feed. We regret the error and are working to resolve the issue. We will update the report with the correct data when it is available.
Median Sale Price
| Redfin Metro | Median Sale Price | Month-Over-Month | Year-Over-Year |
|---|---|---|---|
| Albany, NY | $225,000 | 2.3% | 6.3% |
| Allentown, PA | $210,000 | 5.0% | 10.5% |
| Atlanta, GA | $245,000 | -1.2% | 8.9% |
| Austin, TX | $315,000 | -2.2% | 5.7% |
| Bakersfield, CA | $240,000 | 2.1% | 5.5% |
| Baton Rouge, LA | $205,000 | 0.1% | 2.5% |
| Birmingham, AL | $215,000 | 3.0% | 11.5% |
| Boston, MA | $515,000 | 0.0% | 8.4% |
| Buffalo, NY | $165,000 | 6.5% | 10.7% |
| Camden, NJ | $188,300 | 1.0% | -0.9% |
| Charlotte, NC | $247,000 | -2.4% | 3.3% |
| Chicago, IL | $253,600 | -2.5% | 1.4% |
| Cincinnati, OH | $185,000 | -4.6% | 2.8% |
| Cleveland, OH | $152,500 | -1.6% | 3.7% |
| Columbus, OH | $210,000 | -4.5% | 6.1% |
| Dallas, TX | $299,900 | -0.9% | 5.2% |
| Denver, CO | $410,000 | -1.4% | 7.9% |
| Detroit, MI | $144,900 | 7.3% | 15.0% |
| Fort Lauderdale, FL | $262,300 | -2.9% | 4.1% |
| Fort Worth, TX | $245,000 | -2.0% | 8.9% |
| Fresno, CA | $272,000 | 0.7% | 7.1% |
| Grand Rapids, MI | $203,000 | -1.0% | 10.2% |
| Greenville, SC | $212,000 | -0.2% | 8.2% |
| Hampton Roads, VA | $230,000 | -4.2% | 0.0% |
| Honolulu, HI | $591,500 | 2.0% | 2.9% |
| Houston, TX | $242,500 | -0.6% | 5.4% |
| Indianapolis, IN | $181,500 | -3.5% | 7.7% |
| Jacksonville, FL | $234,000 | -2.5% | 4.5% |
| Kansas City, MO | $215,000 | -2.1% | 7.5% |
| Knoxville, TN | $200,000 | 2.6% | 8.0% |
| Las Vegas, NV | $271,500 | -0.5% | 10.8% |
| Long Island, NY | $460,000 | 3.4% | 5.3% |
| Los Angeles, CA | $625,000 | -0.8% | 5.9% |
| Louisville, KY | $205,000 | 3.9% | 10.8% |
| Memphis, TN | $188,500 | -3.3% | 12.5% |
| Miami, FL | $300,000 | 0.0% | 9.1% |
| Milwaukee, WI | $230,000 | 2.2% | 8.5% |
| Minneapolis, MN | $267,700 | -0.8% | 5.0% |
| Montgomery County, PA | $322,500 | 3.2% | 0.8% |
| Nashville, TN | $296,900 | -1.0% | 9.2% |
| New Orleans, LA | $228,000 | 1.3% | 1.6% |
| Oakland, CA | $765,000 | -3.2% | 10.1% |
| Oklahoma City, OK | $175,000 | 1.4% | 2.9% |
| Omaha, NE | $205,400 | -0.3% | 11.2% |
| Orange County, CA | $720,000 | -0.7% | 5.9% |
| Orlando, FL | $245,000 | -1.6% | 7.9% |
| Oxnard, CA | $605,000 | -3.2% | 5.2% |
| Philadelphia, PA | $210,000 | -1.2% | 5.5% |
| Phoenix, AZ | $267,500 | -0.9% | 9.2% |
| Pittsburgh, PA | $172,500 | -5.2% | 5.9% |
| Portland, OR | $395,200 | -2.4% | 4.0% |
| Providence, RI | $275,000 | -1.8% | 3.8% |
| Raleigh, NC | $285,000 | -1.4% | 7.1% |
| Richmond, VA | $253,800 | 0.5% | 2.6% |
| Riverside, CA | $365,000 | 0.0% | 4.9% |
| Rochester, NY | $152,000 | 1.3% | 8.6% |
| Sacramento, CA | $399,000 | -0.7% | 6.4% |
| Salt Lake City, UT | $325,000 | 0.3% | 12.2% |
| San Antonio, TX | $225,000 | -1.5% | 7.1% |
| San Diego, CA | $589,000 | 1.7% | 8.3% |
| San Francisco, CA | $1,400,000 | -1.1% | 9.9% |
| San Jose, CA | $1,163,500 | -5.0% | 19.3% |
| Seattle, WA | $575,000 | -1.3% | 8.6% |
| St. Louis, MO | $184,900 | -1.6% | 1.6% |
| Tacoma, WA | $355,000 | -2.3% | 12.7% |
| Tampa, FL | $228,000 | -1.9% | 6.0% |
| Tucson, AZ | $210,000 | 0.0% | 7.7% |
| Tulsa, OK | $165,000 | -1.5% | 0.0% |
| Warren, MI | $219,000 | 1.9% | 10.7% |
| West Palm Beach, FL | $272,000 | -4.6% | 2.6% |
| Worcester, MA | $280,000 | -5.1% | 5.7% |
| National | $307,400 | -1.4% | 5.3% |
Homes Sold
| Redfin Metro | Homes Sold | Month-Over-Month | Year-Over-Year |
|---|---|---|---|
| Albany, NY | 990 | -3.0% | 3.3% |
| Allentown, PA | 927 | -11.0% | -2.7% |
| Atlanta, GA | 11,316 | -4.5% | 7.8% |
| Austin, TX | 3,188 | -10.7% | -0.5% |
| Bakersfield, CA | 787 | -10.0% | 1.4% |
| Baton Rouge, LA | 1,023 | -1.3% | -2.8% |
| Birmingham, AL | 1,536 | 4.2% | 9.2% |
| Boston, MA | 5,522 | -11.1% | 1.9% |
| Buffalo, NY | 952 | -13.5% | -12.9% |
| Camden, NJ | 2,490 | -9.5% | 40.8% |
| Charlotte, NC | 3,874 | -11.1% | -2.5% |
| Chicago, IL | 13,014 | -2.9% | 15.3% |
| Cincinnati, OH | 2,495 | -4.1% | 2.3% |
| Cleveland, OH | 2,774 | -10.2% | 2.2% |
| Columbus, OH | 3,259 | -0.2% | 12.0% |
| Dallas, TX | 5,891 | -9.9% | -2.0% |
| Denver, CO | 5,088 | -14.2% | -4.3% |
| Detroit, MI | 2,068 | 0.2% | 8.8% |
| Fort Lauderdale, FL | 2,930 | -19.5% | -5.8% |
| Fort Worth, TX | 3,379 | -2.8% | 2.5% |
| Fresno, CA | 803 | -16.3% | -5.3% |
| Grand Rapids, MI | 1,808 | 13.7% | 13.7% |
| Greenville, SC | 1,233 | 0.9% | 5.7% |
| Hampton Roads, VA | 2,493 | -3.8% | 16.7% |
| Honolulu, HI | 812 | -10.3% | 0.6% |
| Houston, TX | 8,110 | -9.5% | 6.2% |
| Indianapolis, IN | 3,298 | -12.4% | 0.7% |
| Jacksonville, FL | 2,575 | -11.0% | 5.3% |
| Kansas City, MO | 3,561 | -9.3% | 7.0% |
| Knoxville, TN | 1,352 | -11.2% | -1.3% |
| Las Vegas, NV | 3,859 | -4.7% | 3.3% |
| Long Island, NY | 2,710 | -11.1% | 9.1% |
| Los Angeles, CA | 6,401 | -8.3% | -0.5% |
| Louisville, KY | 1,738 | 15.7% | 16.9% |
| Memphis, TN | 1,433 | 8.7% | 2.1% |
| Miami, FL | 2,218 | -22.3% | -17.9% |
| Milwaukee, WI | 2,012 | -13.4% | -2.9% |
| Minneapolis, MN | 6,844 | 1.9% | 5.1% |
| Montgomery County, PA | 3,355 | 1.5% | 13.6% |
| Nashville, TN | 3,666 | 0.1% | 1.0% |
| New Orleans, LA | 1,364 | -7.2% | 0.8% |
| Oakland, CA | 2,737 | -6.3% | 9.0% |
| Oklahoma City, OK | 2,193 | 1.2% | 20.1% |
| Omaha, NE | 1,281 | -19.5% | -10.0% |
| Orange County, CA | 2,746 | -4.2% | -1.5% |
| Orlando, FL | 4,097 | -9.7% | 3.4% |
| Oxnard, CA | 779 | 3.9% | -3.2% |
| Philadelphia, PA | 2,658 | -15.4% | 0.9% |
| Phoenix, AZ | 8,345 | -8.0% | 7.1% |
| Pittsburgh, PA | 2,587 | -7.1% | 18.1% |
| Portland, OR | 3,414 | -10.9% | -6.1% |
| Providence, RI | 1,947 | -12.9% | -2.1% |
| Raleigh, NC | 2,618 | -7.6% | 12.4% |
| Richmond, VA | 1,876 | -12.0% | 4.1% |
| Riverside, CA | 5,073 | -5.3% | 0.3% |
| Rochester, NY | 1,085 | -14.0% | -9.8% |
| Sacramento, CA | 2,859 | -8.3% | -2.6% |
| Salt Lake City, UT | 1,714 | -14.1% | -2.5% |
| San Antonio, TX | 2,794 | -8.7% | 2.0% |
| San Diego, CA | 3,188 | -9.0% | -4.2% |
| San Francisco, CA | 968 | -14.8% | -3.1% |
| San Jose, CA | 1,340 | -10.2% | -11.9% |
| Seattle, WA | 4,646 | -7.9% | -6.4% |
| St. Louis, MO | 3,939 | -9.8% | -4.1% |
| Tacoma, WA | 1,552 | -11.9% | -5.7% |
| Tampa, FL | 5,428 | -8.4% | -3.9% |
| Tucson, AZ | 1,447 | -15.4% | 3.1% |
| Tulsa, OK | 1,196 | 1.8% | 14.8% |
| Warren, MI | 4,196 | -1.2% | 8.1% |
| West Palm Beach, FL | 2,911 | -13.3% | 8.3% |
| Worcester, MA | 1,087 | -9.8% | 0.3% |
| National | 277,100 | -8.2% | 4.1% |
New Listings
| Redfin Metro | New Listings | Month-Over-Month | Year-Over-Year |
|---|---|---|---|
| Albany, NY | 1,226 | -11.1% | 7.9% |
| Albuquerque, NM | 1,483 | -9.6% | 1.9% |
| Allentown, PA | 1,262 | -7.3% | 16.5% |
| Atlanta, GA | 11,519 | -11.5% | 6.9% |
| Austin, TX | 3,861 | -9.5% | -0.4% |
| Bakersfield, CA | 1,062 | -0.5% | 4.7% |
| Baton Rouge, LA | 1,181 | -11.7% | -7.7% |
| Birmingham, AL | 1,621 | -9.9% | 2.0% |
| Boston, MA | 5,114 | -23.7% | 1.9% |
| Buffalo, NY | 1,559 | 10.0% | 8.0% |
| Camden, NJ | 2,214 | -9.5% | -0.4% |
| Charlotte, NC | 4,422 | -7.3% | -0.3% |
| Chicago, IL | 13,414 | -8.9% | 5.5% |
| Cincinnati, OH | 2,853 | -6.6% | 8.6% |
| Cleveland, OH | 3,578 | -4.4% | 10.3% |
| Columbus, OH | 3,499 | -4.1% | 0.8% |
| Dallas, TX | 7,755 | -12.8% | 4.1% |
| Denver, CO | 5,628 | -14.2% | -1.3% |
| Detroit, MI | 2,807 | -1.3% | 2.3% |
| Fort Lauderdale, FL | 3,942 | -2.7% | 6.7% |
| Fort Worth, TX | 4,113 | -10.7% | 4.6% |
| Fresno, CA | 1,068 | 3.2% | 4.2% |
| Grand Rapids, MI | 1,807 | -5.0% | 3.7% |
| Greenville, SC | 1,292 | -6.8% | 0.7% |
| Hampton Roads, VA | 2,512 | -15.9% | -0.6% |
| Honolulu, HI | 1,149 | 6.8% | 7.9% |
| Houston, TX | 10,828 | -5.8% | 1.3% |
| Indianapolis, IN | 3,642 | -9.2% | 4.2% |
| Jacksonville, FL | 3,110 | -3.0% | 11.9% |
| Kansas City, MO | 3,996 | -10.7% | 9.2% |
| Knoxville, TN | 1,665 | -1.4% | 21.8% |
| Las Vegas, NV | 4,349 | -4.1% | 4.7% |
| Long Island, NY | 3,716 | -7.4% | 7.5% |
| Los Angeles, CA | 8,334 | -5.2% | -0.6% |
| Louisville, KY | 1,798 | -0.9% | 0.6% |
| Memphis, TN | 1,465 | -7.4% | 3.2% |
| Miami, FL | 3,980 | -1.4% | -1.1% |
| Milwaukee, WI | 2,196 | 0.0% | 4.3% |
| Minneapolis, MN | 6,680 | -13.9% | 2.3% |
| Montgomery County, PA | 2,688 | -17.1% | -2.3% |
| Nashville, TN | 4,528 | -1.8% | 11.7% |
| New Orleans, LA | 1,593 | -7.1% | -4.9% |
| Oakland, CA | 3,030 | -10.7% | 2.5% |
| Oklahoma City, OK | 2,271 | -7.3% | -1.3% |
| Omaha, NE | 1,431 | -9.3% | 5.4% |
| Orange County, CA | 3,387 | -7.3% | 1.6% |
| Orlando, FL | 4,588 | -6.3% | 2.8% |
| Oxnard, CA | 975 | -4.4% | 9.1% |
| Philadelphia, PA | 2,800 | -9.5% | 2.2% |
| Phoenix, AZ | 7,966 | -14.1% | -1.0% |
| Pittsburgh, PA | 2,930 | -6.5% | 5.7% |
| Portland, OR | 4,228 | -6.8% | 1.1% |
| Providence, RI | 2,489 | -11.8% | 11.2% |
| Raleigh, NC | 2,458 | -8.3% | -6.6% |
| Richmond, VA | 1,899 | -12.2% | 0.2% |
| Riverside, CA | 6,084 | -9.5% | -3.1% |
| Rochester, NY | 1,378 | -9.7% | 3.4% |
| Sacramento, CA | 3,613 | -9.7% | -3.2% |
| Salt Lake City, UT | 2,076 | -4.8% | -0.1% |
| San Antonio, TX | 3,550 | -6.4% | 3.5% |
| San Diego, CA | 3,956 | -9.0% | 1.5% |
| San Francisco, CA | 1,036 | -19.0% | 3.2% |
| San Jose, CA | 1,644 | -4.4% | 15.2% |
| Seattle, WA | 5,494 | -12.9% | -2.9% |
| St. Louis, MO | 4,765 | -6.9% | 2.1% |
| Tacoma, WA | 1,831 | -6.2% | -8.5% |
| Tampa, FL | 5,918 | -8.1% | -0.4% |
| Tucson, AZ | 1,509 | -10.9% | 3.7% |
| Tulsa, OK | 1,445 | -4.7% | 3.7% |
| Warren, MI | 5,303 | -5.5% | 2.1% |
| West Palm Beach, FL | 3,393 | -4.9% | -0.3% |
| Worcester, MA | 1,220 | -16.6% | 9.2% |
| National | 319,000 | -8.2% | 2.8% |
All Homes for Sale
| Redfin Metro | All Homes for Sale | Month-Over-Month | Year-Over-Year |
|---|---|---|---|
| Albany, NY | 3,016 | 2.1% | -11.4% |
| Albuquerque, NM | 3,479 | -24.8% | -32.1% |
| Allentown, PA | 3,487 | 16.5% | 16.2% |
| Atlanta, GA | 28,829 | 3.9% | -3.1% |
| Austin, TX | 8,341 | -0.7% | -5.8% |
| Bakersfield, CA | 2,263 | 0.2% | -1.1% |
| Baton Rouge, LA | 3,952 | -6.4% | 18.3% |
| Birmingham, AL | 4,989 | -1.1% | -17.3% |
| Boston, MA | 8,252 | -6.9% | -4.0% |
| Buffalo, NY | 2,300 | 10.8% | -22.2% |
| Camden, NJ | 7,492 | 0.2% | -8.2% |
| Charlotte, NC | 11,464 | -0.1% | -15.8% |
| Chicago, IL | 41,046 | 0.1% | -4.5% |
| Cincinnati, OH | 7,938 | 2.5% | -3.0% |
| Cleveland, OH | 8,811 | 1.5% | -8.6% |
| Columbus, OH | 6,969 | 1.8% | -6.2% |
| Dallas, TX | 17,118 | -3.6% | 9.7% |
| Denver, CO | 7,538 | 2.1% | -1.3% |
| Detroit, MI | 4,734 | 2.8% | -4.3% |
| Fort Lauderdale, FL | 12,872 | -3.8% | -4.2% |
| Fort Worth, TX | 7,483 | -3.9% | 1.6% |
| Fresno, CA | 1,726 | 2.7% | -1.8% |
| Grand Rapids, MI | 2,572 | 4.2% | -7.1% |
| Greenville, SC | 4,129 | 1.1% | -0.9% |
| Hampton Roads, VA | 7,448 | -3.4% | -13.6% |
| Honolulu, HI | 3,484 | 2.2% | 8.7% |
| Houston, TX | 28,025 | -0.2% | -6.8% |
| Indianapolis, IN | 5,674 | 1.2% | -27.6% |
| Jacksonville, FL | 7,820 | 0.0% | 7.1% |
| Knoxville, TN | 4,819 | 3.1% | 0.6% |
| Las Vegas, NV | 7,014 | -25.7% | -33.6% |
| Long Island, NY | 11,646 | 2.7% | -0.2% |
| Los Angeles, CA | 17,405 | -0.2% | -4.4% |
| Louisville, KY | 3,206 | -0.3% | -8.6% |
| Memphis, TN | 3,246 | 0.4% | -8.2% |
| Miami, FL | 16,991 | -2.0% | -4.7% |
| Milwaukee, WI | 5,255 | 2.7% | -20.8% |
| Minneapolis, MN | 11,477 | 1.2% | -11.4% |
| Montgomery County, PA | 7,281 | 1.0% | -10.8% |
| Nashville, TN | 11,116 | 2.3% | 16.1% |
| New Orleans, LA | 6,028 | -3.2% | 1.9% |
| Oakland, CA | 3,372 | 6.8% | 5.9% |
| Oklahoma City, OK | 5,424 | -1.8% | -17.5% |
| Omaha, NE | 2,010 | 0.1% | -11.6% |
| Orange County, CA | 8,130 | -1.0% | -1.6% |
| Orlando, FL | 9,308 | -2.9% | -15.7% |
| Oxnard, CA | 1,935 | 0.1% | 12.7% |
| Philadelphia, PA | 6,933 | 2.5% | -13.6% |
| Phoenix, AZ | 17,305 | -8.3% | -13.9% |
| Pittsburgh, PA | 9,664 | -0.5% | -9.6% |
| Portland, OR | 7,344 | 3.9% | 21.8% |
| Providence, RI | 6,131 | 3.1% | 1.4% |
| Raleigh, NC | 6,252 | -6.6% | -11.5% |
| Richmond, VA | 3,517 | -1.5% | -13.5% |
| Riverside, CA | 15,621 | -3.2% | -2.1% |
| Rochester, NY | 2,222 | 7.8% | -26.2% |
| Sacramento, CA | 5,860 | 1.9% | 1.1% |
| Salt Lake City, UT | 3,079 | -23.5% | -18.0% |
| San Antonio, TX | 8,329 | -3.8% | -7.4% |
| San Diego, CA | 7,218 | 1.5% | 14.6% |
| San Francisco, CA | 1,354 | -3.1% | 2.3% |
| San Jose, CA | 1,980 | 8.0% | 28.0% |
| Seattle, WA | 6,991 | 10.0% | 27.0% |
| St. Louis, MO | 12,100 | -4.1% | -9.7% |
| Tacoma, WA | 2,391 | 1.6% | -14.2% |
| Tampa, FL | 12,287 | -5.7% | -8.5% |
| Tucson, AZ | 4,190 | -5.4% | -8.7% |
| Tulsa, OK | 3,906 | -6.1% | -11.3% |
| Warren, MI | 8,790 | 8.7% | -2.9% |
| West Palm Beach, FL | 13,286 | -2.9% | -2.2% |
| Worcester, MA | 2,198 | -1.0% | -3.7% |
| National | 747,200 | -1.1% | -5.4% |
Median Off-Market Redfin Estimate
| Redfin Metro | Estimate | Month-Over-Month | Year-Over-Year |
|---|---|---|---|
| Albany, NY | $212,300 | 0.9% | 4.8% |
| Allentown, PA | $204,500 | 1.4% | 5.7% |
| Atlanta, GA | $208,500 | 1.2% | 10.9% |
| Austin, TX | $297,700 | 0.5% | 3.0% |
| Bakersfield, CA | $209,300 | 0.6% | 5.9% |
| Baton Rouge, LA | $150,300 | 0.1% | -0.6% |
| Birmingham, AL | $145,700 | 0.4% | 6.3% |
| Boston, MA | $484,700 | 0.8% | 7.1% |
| Buffalo, NY | $153,000 | 1.5% | 6.8% |
| Camden, NJ | $191,600 | 1.0% | 3.7% |
| Charlotte, NC | $197,900 | 1.0% | 15.2% |
| Chicago, IL | $236,400 | 0.9% | 2.9% |
| Cincinnati, OH | $165,400 | 0.8% | 9.0% |
| Cleveland, OH | $135,400 | 1.0% | 5.2% |
| Columbus, OH | $184,700 | 0.9% | 11.1% |
| Dallas, TX | $252,200 | 0.7% | 8.6% |
| Denver, CO | $407,100 | 0.5% | 9.5% |
| Detroit, MI | $100,900 | 1.1% | 28.8% |
| Fort Lauderdale, FL | $255,500 | 0.6% | 8.3% |
| Fort Worth, TX | $208,000 | 0.9% | 10.5% |
| Fresno, CA | $249,700 | 1.5% | 9.3% |
| Grand Rapids, MI | $156,200 | 0.6% | 7.6% |
| Greenville, SC | $163,300 | 0.8% | 8.6% |
| Hampton Roads, VA | $221,700 | 0.6% | 4.1% |
| Honolulu, HI | $686,200 | 0.1% | 3.8% |
| Houston, TX | $202,800 | 0.6% | 6.2% |
| Indianapolis, IN | $155,700 | 1.4% | 8.9% |
| Jacksonville, FL | $210,200 | 1.0% | 10.9% |
| Kansas City, MO | $182,700 | 1.1% | 8.4% |
| Knoxville, TN | $145,600 | 0.8% | 8.2% |
| Las Vegas, NV | $264,300 | 1.6% | 17.3% |
| Long Island, NY | $430,300 | 0.6% | 6.0% |
| Los Angeles, CA | $616,100 | 0.8% | 8.2% |
| Louisville, KY | $147,800 | 0.9% | -3.6% |
| Memphis, TN | $132,300 | 0.4% | 9.2% |
| Miami, FL | $289,800 | 0.9% | 7.3% |
| Milwaukee, WI | $207,600 | 2.0% | 10.5% |
| Minneapolis, MN | $254,000 | 0.9% | 6.4% |
| Montgomery County, PA | $313,900 | 0.6% | 3.6% |
| Nashville, TN | $241,900 | 1.0% | 11.6% |
| New Orleans, LA | $165,300 | 0.4% | -5.1% |
| Oakland, CA | $771,700 | 0.8% | 10.6% |
| Oklahoma City, OK | $138,700 | 0.5% | 1.7% |
| Omaha, NE | $166,900 | 1.0% | 6.7% |
| Orange County, CA | $710,700 | 0.6% | 6.8% |
| Orlando, FL | $224,700 | 0.7% | 9.0% |
| Oxnard, CA | $596,600 | 0.5% | 5.2% |
| Philadelphia, PA | $203,400 | 1.9% | 11.9% |
| Phoenix, AZ | $261,100 | 0.8% | 7.5% |
| Pittsburgh, PA | $137,700 | 1.2% | 2.2% |
| Portland, OR | $389,900 | 0.6% | 4.4% |
| Providence, RI | $289,300 | 0.6% | 6.3% |
| Raleigh, NC | $257,500 | 0.7% | 6.7% |
| Richmond, VA | $219,200 | 0.7% | 7.1% |
| Riverside, CA | $358,500 | 0.7% | 8.8% |
| Rochester, NY | $141,500 | 1.4% | 5.4% |
| Sacramento, CA | $398,300 | 0.7% | 6.6% |
| Salt Lake City, UT | $317,400 | 1.1% | 9.6% |
| San Antonio, TX | $187,400 | 0.8% | 7.6% |
| San Diego, CA | $588,100 | 0.6% | 7.3% |
| San Francisco, CA | $1,350,100 | 0.4% | 12.7% |
| San Jose, CA | $1,284,000 | 0.2% | 25.5% |
| Seattle, WA | $566,200 | 0.5% | 13.7% |
| St. Louis, MO | $153,600 | 0.9% | 6.2% |
| Tacoma, WA | $344,900 | 1.5% | 14.6% |
| Tampa, FL | $212,000 | 0.6% | 9.4% |
| Tucson, AZ | $200,900 | 0.6% | 7.1% |
| Tulsa, OK | $136,000 | 0.7% | 1.1% |
| Warren, MI | $208,300 | 1.0% | 7.9% |
| West Palm Beach, FL | $261,100 | 0.4% | 6.6% |
| Worcester, MA | $279,800 | 1.1% | 7.8% |
| National | $292,800 | 0.1% | 7.8% |


