
Seattle has the lowest supply of homes for sale on record
Denver is the fastest market of all time with homes selling in six days
Richmond home sales boom, up 47% over last year
Majority of homes in San Francisco now sell for over $1 million
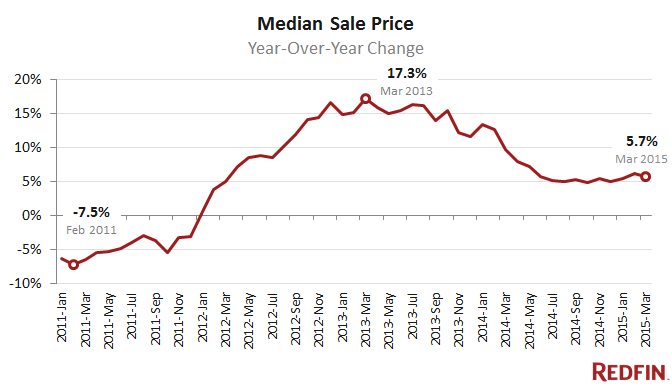
Home sales leapt 10.1 percent in March compared with a year earlier, while the number of new listings increased 9.2 percent. Although more people are buying in 2015, increased supply has so far kept competition and prices in check. Year-over-year growth in home sales hasn’t topped 10 percent since September 2013.
Redfin analysis revealed continuing stable price growth last month, at 5.7 percent year over year. While 18.5 percent of homes sold above the asking price, that share is down year over year for the 17th month in a row. It was 19.5 percent in March of last year.
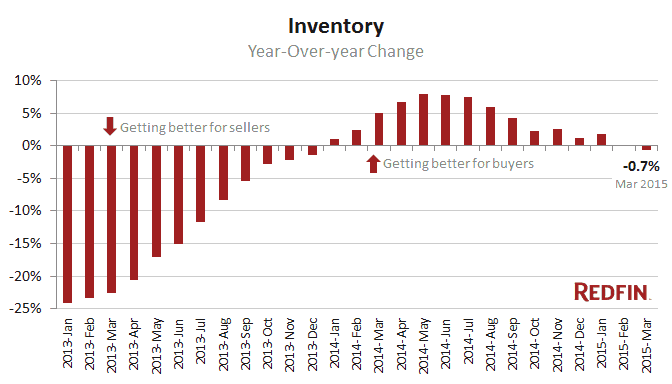
But March was also the first month since December 2013 when the overall number of homes for sale shrank year over year, by 0.7 percent, even though the number of newly listed homes increased. New listings will need to keep pace with the high demand we’re seeing so far this year in order to prevent another national shift in favor of sellers. In the West, market conditions have already tilted further in the favor of sellers, according to the most recent survey of Redfin agents.
Other March Highlights
Prices
- More than half of all homes in the San Francisco market are now selling for over $1 million. The region had the third-highest rate of price growth, at 17.7 percent year over year. The median sale price was $1,060,000 last month.
- Denver had the highest price growth in the country. The median sale price surpassed $300,000 for the first time, rising 19.6 percent from a year ago to $314,900.
- Median sale price prices in Baltimore ($230,000), Boston ($325,000) and Cleveland ($114,950) were flat compared with the previous year. The median sale price in Jacksonville ticked down 0.6 percent due to a 16.8 percent surge in new condo listings.
Sales
- Richmond, Virginia, saw a 47 percent boom in home sales, with 1,308 properties changing hands, up from 890 in 2014.
- San Jose home sales were about half of what they were last March. Only 713 homes sold last month compared with 1,412 a year ago.
- Houston sales dropped slightly year over year for the third straight month. Sales were down 0.6 percent in March compared with 2014.
Competition
- Denver was the fastest housing market on record in March. The average home in Denver was on the market only six days before going under contract. The mile-high city broke its own record, set in May 2014 when the average home sold in eight days.
- There were less than two months of supply at the end of March in both Denver (1.8) and Oakland (1.9), while Seattle (2.2) pulled even with chronically supply-starved San Francisco for the first time. This was the lowest supply of homes for sale on record in Seattle.
- Fresno has seen competition heat up substantially. Last March, only 0.9 percent of listings sold above asking price. This year it was 16.9 percent, the second-highest increase in the country, behind Denver (which increased 18.7% to 44.9%).
New Listings
- 43 out of 51 metro areas nationally saw year-over-year growth in new listings in March. Leading the pack were Fort Lauderdale (25.3%), Riverside-San Bernardino (24.6%) and Sacramento (20%).
- Providence (-14%) and San Francisco (-12.2%) saw the largest drop in March listings compared to 2014.
Data for the March National Market Tracker can be downloaded as an Excel spreadsheet.
For additional information:
Chicago Market Tracker
San Francisco Market Tracker
Washington, D.C., Market Tracker
Median Sale Price
| Metro | Median Sale Price | Month-over- Month |
Year-over- Year |
|---|---|---|---|
| Allentown, PA | $165,000 | 3.1% |
6.5%
|
| Atlanta, GA | $180,000 | 3.8% |
11.0%
|
| Austin, TX | $259,800 | 4.0% |
10.6%
|
| Baltimore, MD | $230,000 | 2.2% |
0.0%
|
| Boston, MA | $325,000 | 0.0% |
0.0%
|
| Charlotte, NC | $197,900 | 5.3% |
8.4%
|
| Chicago, IL | $202,000 | 15.4% |
15.4%
|
| Cleveland, OH | $115,000 | 20.0% |
-0.0%
|
| Dallas-Fort Worth, TX | $210,000 | 5.0% |
11.1%
|
| Denver, CO | $314,900 | 6.7% |
19.6%
|
| Fort Lauderdale, FL | $185,000 | -1.6% |
9.5%
|
| Fort Myers-Cape Coral, FL | $200,000 | 10.8% |
17.7%
|
| Fresno, CA | $219,900 | 6.0% |
5.7%
|
| Hampton Roads, VA | $208,000 | 3.9% |
5.1%
|
| Honolulu, HI | $500,000 | 1.0% |
3.1%
|
| Houston, TX | $210,000 | 5.0% |
7.7%
|
| Hudson Valley, NY | $400,000 | 7.4% |
1.3%
|
| Indianapolis, IN | $145,000 | 6.9% |
4.9%
|
| Jacksonville, FL | $165,000 | -1.0% |
-0.6%
|
| Las Vegas, NV | $190,000 | 0.5% |
5.6%
|
| Long Island, NY | $364,200 | 1.2% |
8.7%
|
| Los Angeles, CA | $487,200 | 1.5% |
6.2%
|
| Louisville, KY | $155,200 | 7.1% |
9.3%
|
| Miami, FL | $225,000 | 4.7% |
4.7%
|
| Minneapolis-St. Paul, MN | $210,000 | 5.0% |
10.5%
|
| Nashville, TN | $219,000 | 5.8% |
10.1%
|
| Oakland, CA | $555,000 | 10.4% |
6.8%
|
| Oklahoma City, OK | $153,000 | -1.3% |
1.3%
|
| Omaha, NE | $156,200 | 0.8% |
5.8%
|
| Orange County, CA | $570,000 | 2.7% |
4.6%
|
| Orlando, FL | $179,000 | 7.8% |
10.5%
|
| Philadelphia, PA | $222,000 | 11.4% |
6.7%
|
| Phoenix, AZ | $205,000 | 2.5% |
6.4%
|
| Portland, OR | $282,000 | 2.5% |
6.6%
|
| Providence, RI | $189,900 | 4.9% |
4.3%
|
| Raleigh-Durham, NC | $228,500 | 10.4% |
8.9%
|
| Richmond, VA | $209,000 | 4.7% |
10.0%
|
| Riverside-San Bernardino, CA | $295,000 | 2.8% |
7.3%
|
| Sacramento, CA | $305,000 | -1.3% |
6.4%
|
| San Antonio, TX | $185,000 | -1.6% |
10.2%
|
| San Diego, CA | $460,000 | 4.0% |
7.0%
|
| San Francisco, CA | $1,060,000 | 8.7% |
17.1%
|
| San Jose, CA | $880,000 | 8.6% |
16.6%
|
| Seattle, WA | $385,700 | 7.2% |
11.8%
|
| Tacoma, WA | $245,000 | 3.7% |
7.5%
|
| Tampa, FL | $159,000 | 7.4% |
11.2%
|
| Tucson, AZ | $177,000 | 4.1% |
7.3%
|
| Ventura County, CA | $486,000 | 0.2% |
8.0%
|
| Washington, DC | $359,900 | 2.8% |
2.8%
|
| West Palm Beach, FL | $214,000 | 7.0% |
12.6%
|
| Wilmington, DE | $198,300 | 0.1% |
7.2%
|
| Overall | $267,500 | 4.3% |
5.7%
|
Median List Price
| Metro | Median List Price | Month-over- Month |
Year-over- Year |
|---|---|---|---|
| Allentown, PA | $ 199,900 | 14.2% |
6.6%
|
| Atlanta, GA | $ 215,000 | 7.6% |
13.2%
|
| Austin, TX | $ 299,000 | 1.4% |
9.9%
|
| Baltimore, MD | $ 274,900 | 6.0% |
2.0%
|
| Boston, MA | $ 369,000 | 5.4% |
1.1%
|
| Chicago, IL | $ 259,900 | 4.0% |
8.7%
|
| Cleveland, OH | $ 142,000 | 1.5% |
5.3%
|
| Dallas-Fort Worth, TX | $ 235,000 | 4.4% |
17.5%
|
| Denver, CO | $ 325,000 | 0.0% |
10.2%
|
| Fort Lauderdale, FL | $ 270,000 | 1.8% |
5.9%
|
| Fort Myers-Cape Coral, FL | $ 222,800 | 2.9% |
22.4%
|
| Fresno, CA | $ 235,000 | 4.4% |
9.3%
|
| Hampton Roads, VA | $ 232,500 | 1.3% |
4.3%
|
| Honolulu, HI | $ 499,900 | -4.8% |
4.1%
|
| Houston, TX | $ 250,000 | 0.0% |
12.0%
|
| Hudson Valley, NY | $ 469,900 | -6.0% |
-3.9%
|
| Indianapolis, IN | $ 160,000 | 14.4% |
3.2%
|
| Jacksonville, FL | $ 197,300 | -1.3% |
9.7%
|
| Las Vegas, NV | $ 219,900 | 4.7% |
13.9%
|
| Long Island, NY | $ 420,000 | 1.7% |
1.3%
|
| Los Angeles, CA | $ 527,000 | 2.3% |
5.6%
|
| Louisville, KY | $ 169,900 | 6.3% |
6.3%
|
| Miami, FL | $ 310,000 | 0.0% |
15.2%
|
| Minneapolis-St. Paul, MN | $ 244,900 | -0.0% |
8.6%
|
| Nashville, TN | $ 256,000 | -1.5% |
5.8%
|
| Oakland, CA | $ 579,900 | 3.9% |
10.5%
|
| Oklahoma City, OK | $ 175,000 | 1.2% |
9.4%
|
| Omaha, NE | $ 175,000 | 0.0% |
7.1%
|
| Orange County, CA | $ 639,900 | 1.8% |
7.0%
|
| Orlando, FL | $ 199,800 | 2.7% |
11.1%
|
| Philadelphia, PA | $ 256,000 | 2.4% |
6.7%
|
| Phoenix, AZ | $ 235,000 | 2.2% |
7.3%
|
| Portland, OR | $ 310,000 | 0.0% |
4.1%
|
| Providence, RI | $ 225,000 | 7.1% |
2.7%
|
| Raleigh-Durham, NC | $ 255,000 | 2.0% |
10.5%
|
| Richmond, VA | $ 239,000 | 2.6% |
12.1%
|
| Riverside-San Bernardino, CA | $ 316,900 | 2.2% |
9.3%
|
| Sacramento, CA | $ 469,000 | 4.4% |
6.7%
|
| San Antonio, TX | $ 214,900 | -0.5% |
13.7%
|
| San Diego, CA | $ 515,000 | 3.2% |
8.2%
|
| San Francisco, CA | $ 965,000 | 7.3% |
13.5%
|
| San Jose, CA | $ 799,000 | 0.1% |
8.1%
|
| Seattle, WA | $ 409,000 | 1.0% |
7.9%
|
| Tacoma, WA | $ 267,500 | 4.9% |
7.3%
|
| Tampa, FL | $ 180,000 | 0.1% |
9.1%
|
| Tucson, AZ | $ 200,000 | 0.3% |
5.8%
|
| Ventura County, CA | $ 580,000 | 5.6% |
10.5%
|
| Washington, DC | $ 414,000 | 3.5% |
4.0%
|
| West Palm Beach, FL | $ 259,900 | -1.6% |
13.5%
|
| Wilmington, DE | $ 230,000 | 4.7% |
7.0%
|
| Overall | $307,100 | 3.0% |
7.7%
|
Homes Sold
| Metro | Homes Sold | Month-over- Month |
Year-over- Year |
|---|---|---|---|
| Allentown, PA | 522 | 47.0% |
20.8%
|
| Atlanta, GA | 5,436 | 21.1% |
7.1%
|
| Austin, TX | 2,346 | 29.4% |
3.8%
|
| Baltimore, MD | 2,672 | 33.7% |
25.3%
|
| Boston, MA | 3,241 | 30.2% |
-4.6%
|
| Charlotte, NC | 2,449 | 40.5% |
17.5%
|
| Chicago, IL | 7,419 | 30.0% |
1.8%
|
| Cleveland, OH | 1,745 | 35.2% |
11.6%
|
| Dallas-Fort Worth, TX | 6,819 | 30.6% |
-0.2%
|
| Denver, CO | 4,177 | 40.5% |
10.9%
|
| Fort Lauderdale, FL | 2,769 | 23.0% |
2.8%
|
| Fort Myers-Cape Coral, FL | 1,938 | 32.5% |
9.6%
|
| Fresno, CA | 688 | 28.4% |
14.7%
|
| Hampton Roads, VA | 1,663 | 39.4% |
16.0%
|
| Honolulu, HI | 676 | 88.8% |
6.1%
|
| Houston, TX | 5,938 | 33.0% |
-0.6%
|
| Hudson Valley, NY | 759 | 16.8% |
29.5%
|
| Indianapolis, IN | 2,224 | 35.0% |
11.1%
|
| Jacksonville, FL | 2,024 | 36.5% |
19.0%
|
| Las Vegas, NV | 3,289 | 37.4% |
8.1%
|
| Long Island, NY | 1,479 | 8.8% |
10.1%
|
| Los Angeles, CA | 5,511 | 44.5% |
11.1%
|
| Louisville, KY | 998 | 31.1% |
11.5%
|
| Miami, FL | 2,907 | 21.6% |
9.8%
|
| Minneapolis-St. Paul, MN | 3,919 | 49.3% |
21.8%
|
| Nashville, TN | 2,275 | 37.5% |
13.6%
|
| Oakland, CA | 2,079 | 42.5% |
2.6%
|
| Oklahoma City, OK | 1,599 | 29.9% |
4.2%
|
| Omaha, NE | 963 | 37.2% |
7.7%
|
| Orange County, CA | 2,639 | 51.2% |
14.1%
|
| Orlando, FL | 3,687 | 26.1% |
25.9%
|
| Philadelphia, PA | 2,921 | 27.0% |
12.8%
|
| Phoenix, AZ | 7,623 | 36.6% |
18.7%
|
| Portland, OR | 3,050 | 42.5% |
25.6%
|
| Providence, RI | 584 | 27.8% |
-2.2%
|
| Raleigh-Durham, NC | 2,435 | 50.8% |
19.7%
|
| Richmond, VA | 1,308 | 46.8% |
47.0%
|
| Riverside-San Bernardino, CA | 4,529 | 38.4% |
9.6%
|
| Sacramento, CA | 2,474 | 32.1% |
11.3%
|
| San Antonio, TX | 1,853 | 11.0% |
18.4%
|
| San Diego, CA | 2,872 | 28.5% |
5.2%
|
| San Francisco, CA | 1,007 | 14.7% |
-24.3%
|
| San Jose, CA | 713 | -32.5% |
-49.5%
|
| Seattle, WA | 3,654 | 44.1% |
14.3%
|
| Tacoma, WA | 1,028 | 31.3% |
15.5%
|
| Tampa, FL | 5,071 | 27.3% |
23.5%
|
| Tucson, AZ | 1,153 | 29.8% |
6.0%
|
| Ventura County, CA | 712 | 52.1% |
28.1%
|
| Washington, DC | 5,889 | 38.0% |
14.2%
|
| West Palm Beach, FL | 2,960 | 29.6% |
10.2%
|
| Wilmington, DE | 547 | 31.2% |
21.0%
|
| Overall | 139,233 | 32.9% |
10.1%
|
New Listings
| Metro | New Listings | Month-over- Month |
Year-over- Year |
|---|---|---|---|
| Allentown, PA | 1,113 | 45.9% |
-1.2%
|
| Atlanta, GA | 10,026 | 25.1% |
4.4%
|
| Austin, TX | 3,487 | 29.9% |
5.6%
|
| Baltimore, MD | 5,064 | 39.2% |
10.9%
|
| Boston, MA | 8,408 | 105.5% |
6.2%
|
| Chicago, IL | 18,081 | 33.3% |
12.6%
|
| Cleveland, OH | 3,390 | 49.7% |
3.4%
|
| Dallas-Fort Worth, TX | 9,269 | 22.2% |
-5.5%
|
| Denver, CO | 5,708 | 38.1% |
3.9%
|
| Fort Lauderdale, FL | 1,658 | 26.1% |
25.3%
|
| Fort Myers-Cape Coral, FL | 2,479 | -0.1% |
4.1%
|
| Fresno, CA | 1,118 | 24.9% |
17.8%
|
| Hampton Roads, VA | 3,003 | 27.9% |
1.5%
|
| Honolulu, HI | 1,155 | 14.1% |
10.5%
|
| Houston, TX | 9,273 | 12.5% |
7.5%
|
| Hudson Valley, NY | 2,062 | 48.1% |
-5.0%
|
| Indianapolis, IN | 3,799 | 29.2% |
2.1%
|
| Jacksonville, FL | 2,899 | 14.2% |
5.7%
|
| Las Vegas, NV | 4,889 | 20.1% |
5.4%
|
| Long Island, NY | 4,047 | 51.1% |
-6.3%
|
| Los Angeles, CA | 9,209 | 20.6% |
11.6%
|
| Louisville, KY | 1,863 | 43.4% |
-5.9%
|
| Miami, FL | 2,371 | 12.2% |
12.6%
|
| Minneapolis-St. Paul, MN | 7,807 | 38.4% |
16.4%
|
| Nashville, TN | 4,065 | 38.8% |
8.7%
|
| Oakland, CA | 3,142 | 26.9% |
4.7%
|
| Oklahoma City, OK | 2,443 | 18.5% |
2.0%
|
| Omaha, NE | 1,773 | 41.1% |
7.8%
|
| Orange County, CA | 4,429 | 27.6% |
19.2%
|
| Orlando, FL | 5,198 | 13.8% |
7.8%
|
| Philadelphia, PA | 6,888 | 37.4% |
5.2%
|
| Phoenix, AZ | 9,935 | 11.0% |
-2.5%
|
| Portland, OR | 4,468 | 24.1% |
13.4%
|
| Providence, RI | 1,212 | 53.6% |
-14.0%
|
| Richmond, VA | 2,378 | 40.8% |
17.5%
|
| Riverside-San Bernardino, CA | 8,343 | 20.7% |
24.7%
|
| Sacramento, CA | 246 | 47.3% |
20.0%
|
| San Antonio, TX | 2,949 | 10.4% |
11.1%
|
| San Diego, CA | 4,649 | 18.5% |
2.7%
|
| San Francisco, CA | 1,495 | 10.2% |
-12.2%
|
| San Jose, CA | 1,849 | 30.6% |
5.8%
|
| Seattle, WA | 5,150 | 28.5% |
12.1%
|
| Tacoma, WA | 1,665 | 38.4% |
11.7%
|
| Tampa, FL | 6,931 | 12.8% |
14.7%
|
| Tucson, AZ | 1,958 | 8.7% |
2.5%
|
| Ventura County, CA | 1,108 | 19.9% |
9.6%
|
| Washington, DC | 11,302 | 43.8% |
13.7%
|
| West Palm Beach, FL | 4,278 | 6.8% |
5.3%
|
| Wilmington, DE | 1,157 | 36.4% |
8.5%
|
| Overall | 225,066 | 27.9% |
9.2%
|
Inventory
| Metro | Inventory | Month-over- Month |
Year-over- Year |
|---|---|---|---|
| Allentown, PA | 4,840 | 5.9% |
-6.7%
|
| Atlanta, GA | 33,012 | -0.6% |
-5.8%
|
| Austin, TX | 7,797 | 0.7% |
-3.8%
|
| Baltimore, MD | 17,274 | 0.5% |
10.7%
|
| Boston, MA | 21,075 | 5.1% |
-12.7%
|
| Chicago, IL | 61,130 | 12.3% |
11.6%
|
| Dallas-Fort Worth, TX | 22,448 | -0.2% |
-21.4%
|
| Denver, CO | 7,366 | 17.3% |
-8.8%
|
| Fresno, CA | 2,750 | -0.0% |
20.5%
|
| Hampton Roads, VA | 11,890 | 1.8% |
5.4%
|
| Honolulu, HI | 4,109 | 4.9% |
-16.6%
|
| Houston, TX | 24,379 | -1.2% |
-0.7%
|
| Indianapolis, IN | 15,208 | -22.0% |
-25.5%
|
| Jacksonville, FL | 11,020 | -0.4% |
-25.0%
|
| Las Vegas, NV | 18,962 | 0.2% |
-5.6%
|
| Long Island, NY | 17,553 | 4.0% |
-0.8%
|
| Los Angeles, CA | 20,171 | 3.1% |
7.7%
|
| Miami, FL | 12,238 | -2.9% |
-5.2%
|
| Minneapolis-St. Paul, MN | 21,775 | 5.8% |
-5.0%
|
| Nashville, TN | 12,133 | -17.8% |
-25.0%
|
| Oakland, CA | 3,884 | 2.9% |
-17.1%
|
| Omaha, NE | 4,115 | 2.4% |
-17.8%
|
| Orange County, CA | 8,336 | 16.5% |
35.4%
|
| Orlando, FL | 22,640 | -3.3% |
-19.3%
|
| Philadelphia, PA | 26,661 | 6.1% |
2.6%
|
| Phoenix, AZ | 33,016 | 0.9% |
-9.7%
|
| Portland, OR | 8,858 | -6.1% |
-25.6%
|
| Providence, RI | 4,953 | 2.4% |
-3.0%
|
| Richmond, VA | 6,491 | 0.8% |
3.5%
|
| Riverside-San Bernardino, CA | 27,970 | 4.0% |
25.8%
|
| San Antonio, TX | 11,471 | 0.1% |
7.0%
|
| San Diego, CA | 8,934 | -3.7% |
-10.5%
|
| San Francisco, CA | 2,255 | 0.9% |
-5.3%
|
| San Jose, CA | 2,989 | 15.8% |
31.9%
|
| Seattle, WA | 8,062 | -5.2% |
-23.6%
|
| Tacoma, WA | 4,648 | -4.6% |
-21.0%
|
| Tampa, FL | 29,168 | -0.9% |
-14.4%
|
| Tucson, AZ | 9,242 | 8.3% |
11.5%
|
| Ventura County, CA | 2,187 | -1.9% |
-3.4%
|
| Washington, DC | 23,839 | 4.9% |
6.3%
|
| West Palm Beach, FL | 18,006 | 4.0% |
2.6%
|
| Wilmington, DE | 5,032 | 4.5% |
-1.6%
|
| Overall | 645,045 | 2.0% |
-0.7%
|
Methodology: Redfin’s National Market Tracker follows housing trends in the country’s largest metropolitan divisions (those with population 500,000 or greater) served by Redfin agents. Analysis by Redfin is based on all residential home sales transacted on the multiple-listing service and supplemented by county recorder data where available. Metropolitan divisions are based the latest definitions released by the Bureau of Labor Statistics. To view a breakdown of these regions, click here.
Other popular posts:
1. Your Guide to Bringing Home a Rescue Pet
2. How to Secure a New Home After an Abusive Relationship
3. Tips for Safe Holiday Home Decorating
4. How to Host an At-Home Dream Wedding


