
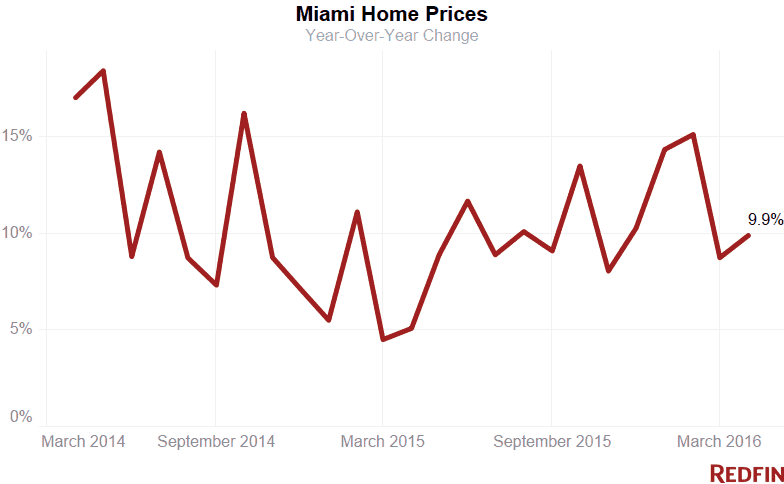
Miami home prices rose nearly 10 percent in April from a year earlier to $250,000, the city’s highest median sale price in at least six years.
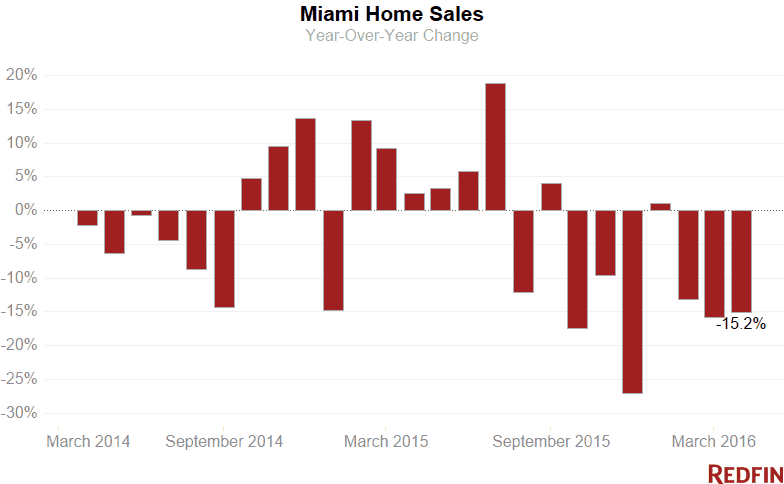
Sales dropped 15 percent, the third month of double-digit declines, as fewer condominiums and single-family homes found buyers.
The number of new homes hitting the market fell, contributing to a 4.8 percent drop in the total number of properties for sale year over year.
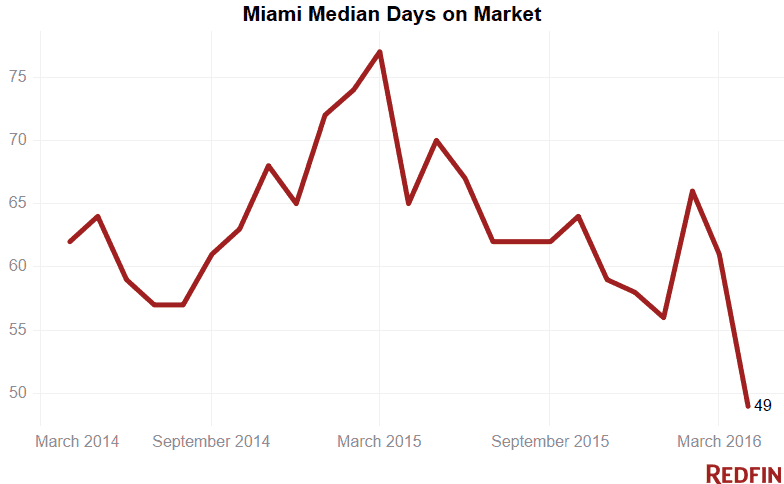
Homes that were on the market sold 16 days faster than they did at this time last year, with the houses finding buyers in 49 days on average. The last time homes were selling so quickly was October 2013.
Condo Units
Condo prices dropped 3.4 percent to a $175,000 median and sales fell 18 percent in April from a year earlier as an oversupply of units continued to hold the market back.
Last month, there was nearly a 10-month supply of condos on the market, a boon to city homebuyers when you consider that a six-month supply signals a balanced market, with higher figures favoring buyers. While fewer units have been added to the market in the past two months, the total number of condos for sale continued its upswing, posting a 2.5 percent year-over-year increase as sellers outnumbered buyers.
Condos that did sell found buyers 19 days faster than they did a year earlier, spending an average of 70 days on the market.
Single-family Homes
Single-family home prices hit a fifth-straight month of double-digit, year-over-year price gains, posting a 12.2 percent jump in April to $291,690. Single-family prices haven’t fallen since December 2014.
While prices climbed, sales dropped 12.4 percent, the seventh-straight month of year-over-year declines. Buyers aren’t in a rush to spend top dollar on single-family homes, Redfin agent Cecilia Cordova said.
“My buyers looking for single-family properties will offer on a house only if it’s at the right price and in good condition,” Cordova said. “They know that just a year ago many of these sellers purchased their homes for $50,000 or even $100,000 less. Buyers are opting to wait for price drops or, in some cases, I’ll suggest that my clients look at properties in the condo market, where prices are lower and there are many more options to choose from.”
More sellers put their single-family homes up for sale, but not enough to boost the overall supply, which fell 9 percent from April 2015.The Miami market continues to favor house sellers, with a 4.2-month supply of single-family homes for sale, the lowest since July.
A typical single-family residence spent 44 days on the market, 13 days fewer than the same time last year.
Neighborhood Trends
Among areas with at least 40 home sales in the last three months, South Point posted the highest sale prices. A typical home fetched $879,500 last month as buyers picked up more properties for less than what sellers wanted. The median asking price in the neighborhood was $1.1 million.
Little Havana continued to be one of Miami’s more affordable neighborhoods, with a median sale price of $150,380, down 9.5 percent.
Prices in Little Haiti jumped 44.8 percent to a $199,120 median. This large hike in prices corresponded with a substantial 25 percent drop in sales.
The Upper Eastside saw a surge in the number of houses and condos hitting the market, up 48.5 percent for the year. As a result, the total number of homes for sale in the neighborhood more than doubled.
| Place | Median Sale Price | Year-Over-Year | Homes Sold | Year-Over-Year | Inventory | Year-Over-Year | New Listings | Median Days on Market | Avg Sale-to-List |
|---|---|---|---|---|---|---|---|---|---|
| Andover | $151,824 | 23.0% | 1 | 0.0% | 3 | NA | 5 | 69 | 72.3% |
| Aventura | $352,500 | -1.0% | 106 | -28.4% | 567 | 15.2% | 293 | 117 | 93.9% |
| Bal Harbour | $612,500 | -34.1% | 8 | -27.3% | 175 | 22.4% | 29 | 76 | 93.6% |
| Bay Harbor Islands | $357,500 | 17.6% | 10 | -54.5% | 144 | 39.8% | 25 | 160 | 95.8% |
| Bay Point | $2,150,000 | 34.4% | 5 | 0.0% | 30 | 150.0% | 12 | 127 | 92.1% |
| Bayshore | $962,500 | 32.8% | 22 | -40.5% | 135 | 45.2% | 72 | 188 | 92.2% |
| Biscayne Park | $377,500 | 20.8% | 4 | -33.3% | 28 | 27.3% | 6 | 66 | 95.3% |
| Biscayne Point | $740,000 | 24.4% | 15 | -25.0% | 43 | -10.4% | 26 | 108 | 94.9% |
| Brentwood | $191,000 | 52.8% | 2 | -60.0% | 2 | -66.7% | 4 | 50 | 93.3% |
| Brickell | $365,000 | -8.8% | 169 | -39.6% | 1,348 | 12.8% | 661 | 143 | 95.0% |
| Coral Gables | $610,000 | 31.2% | 77 | -24.5% | 573 | 5.5% | 150 | 58 | 94.5% |
| Coral Way | $359,000 | 15.8% | 144 | -28.4% | 393 | -6.4% | 331 | 65 | 95.3% |
| Cutler Bay | $239,500 | 14.1% | 80 | 21.2% | 211 | -37.6% | 90 | 57 | 99.9% |
| Doral | $293,250 | 8.6% | 56 | -23.3% | 786 | 13.4% | 158 | 86 | 95.5% |
| Downtown | $390,000 | 5.4% | 104 | -29.7% | 749 | 8.1% | 356 | 171 | 94.9% |
| Eastern Shores | $177,500 | 15.3% | 23 | -23.3% | 108 | 8.0% | 67 | 111 | 94.7% |
| El Portal | $460,000 | 17.9% | 3 | -57.1% | 21 | 16.7% | 6 | 75 | 93.4% |
| Fisher Island | $6,150,000 | 158.9% | 21 | 200.0% | 58 | 13.7% | 8 | 21 | 90.3% |
| Flamingo-Lummus | $229,000 | 11.8% | 116 | -15.3% | 441 | 4.0% | 238 | 117 | 94.5% |
| Hialeah | $182,500 | 20.7% | 181 | -7.6% | 143 | -44.1% | 246 | 36 | 98.4% |
| Highland Village | $86,500 | 9.5% | 1 | -50.0% | NA | NA | 2 | 7 | 73.9% |
| Homestead | $170,000 | 13.5% | 214 | -3.6% | 629 | -34.9% | 272 | 37 | 97.3% |
| Kendall | $225,000 | 0.2% | 93 | -21.2% | 326 | -27.1% | 123 | 44 | 97.3% |
| Key Biscayne | $932,500 | -9.7% | 18 | -57.1% | 292 | 35.2% | 45 | 161 | 94.2% |
| Keystone Point | $1,180,000 | 72.8% | 10 | -41.2% | 52 | 62.5% | 29 | 182 | 90.0% |
| La Gorce | $1,775,000 | 15.3% | 12 | -42.9% | 94 | 56.7% | 36 | 273 | 90.9% |
| Lakewood Estates | $195,000 | 87.5% | 3 | 200.0% | NA | NA | 1 | 81 | 98.0% |
| Little Haiti | $199,123 | 44.8% | 45 | -25.0% | 105 | 6.1% | 89 | 44 | 94.6% |
| Little Havana | $150,375 | -9.5% | 48 | -7.7% | 89 | -11.9% | 93 | 33 | 95.5% |
| Miami Lakes | $323,000 | 10.5% | 46 | -28.1% | 85 | -17.5% | 101 | 55 | 96.8% |
| Miami Shores | $372,500 | -0.7% | 26 | -33.3% | 62 | 12.7% | 52 | 64 | 94.9% |
| Miami Springs | $290,000 | 0.0% | 9 | -40.0% | 50 | 21.9% | 17 | 58 | 99.4% |
| New Belle Meade | $508,750 | -4.2% | 10 | -37.5% | 25 | 38.9% | 18 | 65 | 95.5% |
| Normandy Isle | $211,000 | -27.5% | 22 | -42.1% | 75 | 0.0% | 56 | 53 | 95.0% |
| North Bay Village | $187,500 | -12.6% | 12 | -42.9% | 212 | 20.4% | 45 | 85 | 97.2% |
| North Shore | $297,000 | -20.3% | 78 | -25.0% | 333 | 28.6% | 205 | 93 | 95.9% |
| Northeast Coconut Grove | $580,000 | 6.4% | 97 | -21.8% | 236 | 11.3% | 193 | 71 | 94.9% |
| Overtown | $128,500 | 64.6% | 6 | -50.0% | 20 | -28.6% | 13 | 33 | 98.7% |
| Palm Island | $11,500,000 | 58.6% | 1 | -66.7% | 22 | 22.2% | 6 | 446 | 82.7% |
| Palmetto Bay | $545,000 | 6.9% | 38 | 8.6% | 165 | 25.0% | 61 | 43 | 97.1% |
| Pinecrest | $912,500 | 17.7% | 22 | -12.0% | 220 | 31.7% | 59 | 91 | 92.0% |
| South Miami | $510,000 | 22.3% | 25 | -13.8% | 50 | 66.7% | 44 | 101 | 96.3% |
| South Point | $879,500 | -2.8% | 62 | -8.8% | 305 | 41.9% | 170 | 112 | 94.2% |
| Southwest Coconut Grove | $844,500 | 12.8% | 32 | -15.8% | 123 | 6.0% | 75 | 75 | 93.8% |
| Sunny Isles Beach | $350,000 | -4.8% | 45 | -44.4% | 1,185 | 39.6% | 151 | 142 | 94.1% |
| Sweetwater | $170,000 | 5.8% | 3 | -57.1% | 11 | -8.3% | 5 | 82 | 101.3% |
| The Roads | $465,000 | -1.1% | 27 | 58.8% | 70 | 14.8% | 64 | 53 | 94.0% |
| Upper Eastside | $430,000 | 19.4% | 59 | 0.0% | 232 | 112.8% | 150 | 72 | 94.5% |
| Venetian Islands | $786,000 | 16.4% | 15 | -44.4% | 95 | 25.0% | 36 | 143 | 91.7% |
| West Avenue | $310,000 | 5.1% | 81 | -16.5% | 300 | 11.5% | 160 | 99 | 94.1% |
| West Flagler | $250,000 | 21.4% | 62 | -19.5% | 107 | -10.1% | 117 | 48 | 97.1% |
| West Miami | $299,500 | -4.9% | 2 | -60.0% | 15 | 36.4% | 5 | 77 | 94.3% |
| Wynwood-Edgewater | $345,000 | -3.2% | 87 | -30.9% | 583 | 47.2% | 286 | 86 | 94.9% |
| Miami, FL | $250,000 | 9.9% | 1,277 | -15.2% | 7,709 | -4.8% | 2,210 | 49 | 96.7% |
NOTE: Not all neighborhoods are listed, but totals for Miami encompass the entire city. Data is based on listing information and might not reflect all real estate activity in the market. Neighborhood-specific data is measured over a three-month span that ended April 30. City-specific data is measured over a one-month span that also ended April 30.
For more information, contact Redfin journalist services:
Phone: 206-588-6863
Email: press@redfin.com
See Redfin’s data center to find out what’s happening in other cities.
To be added to Redfin’s press release distribution list, please click here.


