
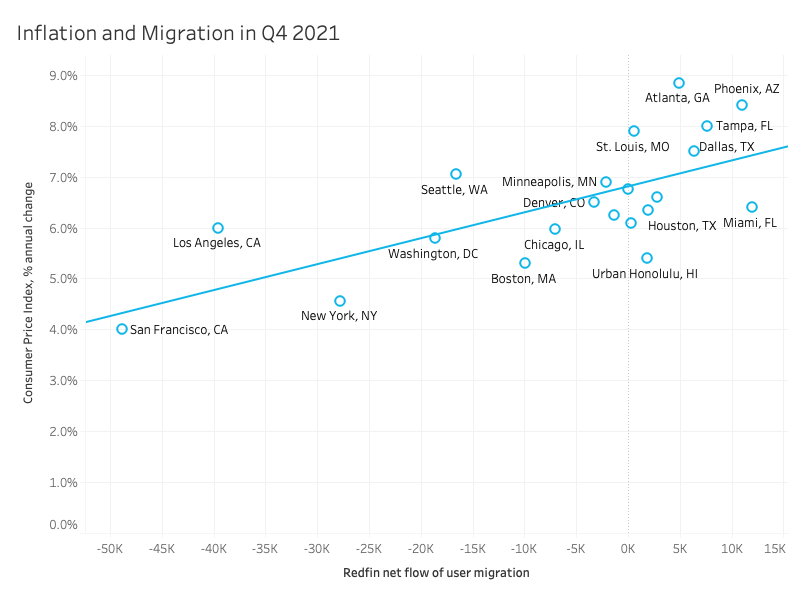
- Atlanta, Phoenix and Tampa have relatively high rates of inflation—between 8% and 9%—and they’re all popular migration destinations. That’s double the inflation rates in San Francisco and New York, places people are moving away from.
- Migration into those places is one reason for rapidly rising prices of consumer goods and services.
- Because of high inflation, including rising home prices, the financial advantage of living in what are now relatively affordable places is likely to diminish.
The most popular U.S. migration destinations tend to have high rates of inflation.
Atlanta, the 10th most popular migration destination in the fourth quarter, saw prices of goods and services increase by 8.9% year over year during the same period, the highest inflation rate of all the metros included in this analysis.
Phoenix, with an 8.4% year over year increase in prices, came in number two for both inflation and migration in the fourth quarter. In Tampa—the fifth most popular destination—prices rose 8% year over year, the third highest inflation rate.
On the flip side, San Francisco, the number-one place Americans moved away from during the fourth quarter, had the lowest inflation rate (4%). New York, which had the second-lowest inflation rate (4.6%), ranked number three on the list of places people are leaving, and Los Angeles—number two on the list of places people are leaving—had the seventh-lowest inflation rate (6%).
Home prices are rising particularly quickly in the most popular migration destinations, one contributor to inflation. For instance, Atlanta home prices were up 22.8% year over year in December, compared with a 10.3% increase in San Francisco.
This report is based on a Redfin analysis of the correlation between inflation (the rising prices of goods and services) and migration in metro areas where inflation data is available. The analysis measures the popularity of migration destinations by net inflow, or how many more Redfin.com users are looking to move into a metro area than move out of it. Inflation rates are measured by the Consumer Price Index, the average change over time in prices for goods and services such as fuel and energy.
National consumer prices jumped 7% in December from a year earlier, reaching their highest level in nearly 40 years. Policymakers consider 2% an acceptable level of inflation.
As an example of varying inflation rates in different areas, gas prices were up 67.2% year over year in December in the Phoenix metro, and prices of cars and trucks were up 34.4%. Prices also rose in the Los Angeles metro, the number-one origin for people moving to Phoenix, but not as much: gas prices were up 46.5%, and the price of cars and trucks increased by 13.7%.
“Migration is one reason among many why the cost of everything from food to fuel is rising,” said Redfin Deputy Chief Economist Taylor Marr. “An influx of people moving to a popular, relatively affordable place like Atlanta increases demand for housing and transportation, pushing up prices on those things and contributing to soaring prices on everything else, from food to utility bills.”
“A person moving from New York City to Atlanta will probably enjoy lower housing costs in their new hometown. That means they’re able to spend more on other things, which in turn means local businesses can charge higher prices,” Marr continued. “The new residents are winners because the cost of living is still low compared to where they came from, even with higher inflation. A lot of locals are also winners because they have more home equity, or maybe their business has improved because they have more customers. But some locals, especially renters and people with jobs that require them to commute, are worse off due to rising rents and soaring prices on everyday expenses like gas in the car and groceries and wages that haven’t kept up.”
Wages in Atlanta were up 3% year over year as of September 2021, compared with a 4.6% nationwide increase. With a nearly 9% inflation rate in Atlanta, locals have less disposable income than they did last year. But at the same time, Atlanta’s unemployment rate was just 2.2% as of November, compared with the national average of 3.9%, illustrating the area’s relatively strong economy.
| Popular migration destinations have relatively high inflation rates
Q4 2021 |
|||
| Atlanta | Phoenix | Tampa | |
| Ranking, YoY inflation rate | #1 | #2 | #3 |
| Inflation rate, YoY | 8.9% | 8.4% | 8% |
| Ranking on list of metros Redfin.com users are moving into | #10 | #2 | #5 |
| Net inflow* of Redfin.com users | 4,921 | 11,047 | 7,678 |
| Share of Redfin.com searchers from users outside the metro | 20% | 35.9% | 46.4% |
| Median home-sale price | $350,000 (+22.8% YoY) | $435,000 (+28% YoY) | $338,000 (+24.3% YoY) |
| Average monthly rent | $2,016 (+12.1% YoY) | $2,107 (+26% YoY) | $2,076 (+28.1% YoY) |
| Most popular out-of-state origin of home searchers coming from out of town, median home-sale price & average monthly rent | New York City
$640,000 (+8.5% YoY) $3,718 (+34.5% YoY) |
Los Angeles
$835,000 (+14.4% YoY) $3,394 (+9.6% YoY) |
New York City
$640,000 (+8.5% YoY) $3,718 (+34.5% YoY) |
| Median sale price/rental data is from December 2021
*Net inflow = how many more Redfin.com home searchers looked to move into a metro area than leave. |
|||
| Places people are leaving have relatively low migration rates
Q4 2021 |
|||
| San Francisco | New York | Los Angeles | |
| Ranking, YoY inflation rate | #23 | #22 | #17 |
| Inflation rate, YoY | 4% | 4.6% | 6% |
| Ranking on list of metros Redfin.com users are leaving | #1 | #3 | #2 |
| Net outflow* | 48,904 | 27,769 | 39,586 |
| Share of Redfin.com searchers from users outside the metro | 23.5% | 27.1% | 19.4% |
| Median home-sale price | $1,488,000 (+10.3% YoY) | $640,000 (+8.5% YoY) | $835,000 (+14.4% YoY) |
| Average monthly rent | $3,520 | $3,718 (+34.5% YoY) | $3,394 (+9.6% YoY) |
| Most popular out-of-state destination, median home-sale price & average monthly rent | Seattle
$727,000 (+16.9% YoY) $2,233 (+20.9% YoY) |
Philadelphia
$259,000 (+7.9% YoY) $2,724 (+13.2% YoY) |
Phoenix
$435,000 (+28% YoY) $2,107 (+26% YoY) |
| Median sale price/rental data is from December 2021
*Net outflow = how many more Redfin.com home searchers looked to leave a metro area than move in. |
|||
As more Americans move to affordable metros, rapidly rising prices will diminish the financial advantage of relocating
The financial advantage of living in places like Phoenix and Tampa is likely to fade as more and more people relocate, which will eventually slow migration.
“Residents moving away and less demand for goods and services is one reason why inflation is lower in places like New York and Los Angeles,” Marr said. “Over time, higher inflation in Phoenix than Los Angeles, for example, will diminish the financial advantage of living in Phoenix. The flow of people moving from traditionally expensive cities to more affordable areas will slow down because, quite simply, prices are rising so fast that those places won’t be as affordable anymore.”
Americans are showing significantly more interest in relocating than before the pandemic, with 31.2% of Redfin.com users looking to move to a different metro area in the fourth quarter, up from about 26% in 2019.
As of now, people moving to Atlanta, Phoenix and Tampa tend to come from cities where housing is more expensive, attracted to the current relatively low cost of housing and other goods and services.
For instance, the most popular out-of-town origin for Redfin.com users moving into both Atlanta and Tampa is New York City, where housing costs nearly twice as much. Los Angeles, where the median sale price is $835,000 and the average monthly rental payment is roughly $3,400, is the most popular origin for Redfin.com users moving into Phoenix ($435,000; $2,100).
Migration and inflation have become more correlated since the pandemic started
As the share of Americans moving to different parts of the country has increased over the last two years, so has the relationship between migration and inflation.
Although there was a small correlation between popular migration destinations and high inflation rates from 2010 to 2020, the relationship has grown since the start of the pandemic. Nearly half (43%) of the variation in inflation rates between metro areas in 2021 can be explained by domestic migration. In the preceding decade, a much smaller share–24%–of the variation could be explained by migration.


