
The inflation rate in Phoenix, which attracted scores of out-of-town homebuyers during the pandemic, is more than double the inflation rate in the Bay Area, which saw an exodus of residents.
The four U.S. metropolitan areas with the highest inflation rates in the third quarter are migration hotspots. Phoenix, Atlanta, Tampa, FL and Miami experienced double-digit inflation and all ranked near the top of Redfin’s list of most popular destinations for relocating homebuyers.
In Phoenix, the price of goods and services rose 13% year over year on average, the highest inflation rate among the metros for which the U.S. Bureau of Labor Statistics (BLS) provides inflation data. Phoenix was the sixth-most popular destination for Redfin.com users looking to move from one metro to another in the third quarter.
Atlanta, the 15th most popular destination, had the second highest inflation rate, at 11.7%, and Tampa (10.9%) clocked in at number three for inflation and number five for migration. Miami had the fourth highest inflation rate (10.7%) and was the second most popular migration destination. Nationwide, the inflation rate was 8.3% in the third quarter.

The places homebuyers are leaving have the lowest inflation rates. Prices in San Francisco rose 5.7% in the third quarter, the lowest inflation rate among the metros Redfin analyzed and less than half the rate of Phoenix. The Bay Area was number one on the list of places Redfin.com users looked to leave in the third quarter. New York had the second-lowest inflation rate (6.4%) and was number three on the list of metros homebuyers looked to leave.
Inflation and migration have become increasingly linked. Remote work allowed scores of Americans to move to the Sun Belt during the pandemic in search of affordability and warm weather, which drove up housing prices, a key contributor to inflation. That’s why migration hotspots now have the highest inflation rates—a trend that was much less acute before the pandemic. In 2019, for example, Los Angeles had the second highest inflation rate, but it was losing residents.
“The pandemic triggered a great rebalancing of affordability,” said Redfin Deputy Chief Economist Taylor Marr. “Americans left pricey coastal job centers and moved to more affordable places in the Sun Belt, but now those more affordable places are seeing affordability erode faster than anywhere else in the country. Some of these areas may lose their titles as top migration destinations in 2023 as a result.”
Popular migration destinations have also seen inflation accelerate relatively quickly. For example, Phoenix’s inflation rate has more than quadrupled in the past three years, rising from 3% in the third quarter of 2019 to 13% in the third quarter of 2022. Meanwhile, San Francisco’s inflation rate has roughly doubled, rising from 2.7% to 5.7%.
Housing costs are a bigger inflation driver in popular migration destinations
The increase in housing costs is a bigger contributor to inflation in migration hotspots than in the places homebuyers are leaving.
In Phoenix, for instance, shelter costs rose 18.2% year over year in October, one of the top inflation drivers. That compares with Phoenix’s overall inflation rate of 12.1%. Gas and food were also major contributors to inflation, with prices up 40.8% and 12.6%, respectively.
By comparison, San Francisco only saw shelter costs increase 2.6% year over year, one of the smallest inflation drivers. Fuel, transportation and food were much bigger contributors to the region’s overall inflation rate, which was 6%.
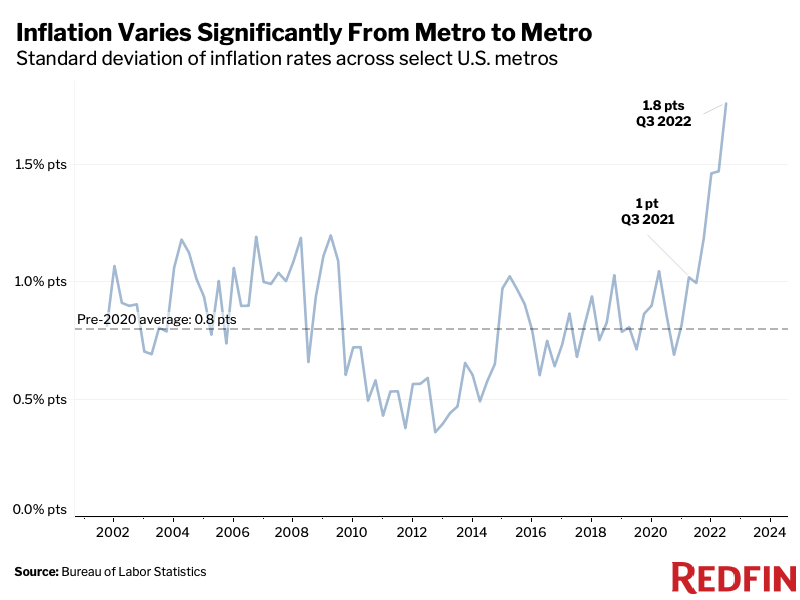
Variance in inflation rates across the country is at a record high
The discrepancy in inflation rates across the U.S. is at the most extreme level on record because so many places surged in popularity during the pandemic while so many others plummeted in popularity.
The typical variability in the inflation rate among the metros Redfin analyzed in the third quarter was 1.8 percentage points, up from 1 percentage point a year earlier and a pre-2020 average of 0.8 percentage points.
Phoenix’s 13% third-quarter inflation rate, the highest among the metros Redfin analyzed, was more than double San Francisco’s 5.7% rate, which was the lowest among the metros Redfin analyzed. That’s a gap of 7.3 percentage points. By comparison, there was only a 2.1-percentage-point gap between the highest and lowest inflation metros in the third quarter of 2019; Seattle had an inflation rate of 3.2%, while Washington, D.C. had an inflation rate of 1.1%.
Metro-Level Summary of Inflation and Migration: Q3 2022
The table below includes metros for which BLS inflation data and Redfin migration data were available, and is ranked by highest to lowest inflation rate.
| U.S. Metro Area | Consumer Price Index, Annual Change (%) | Net Flow of Redfin.com Users |
| Phoenix, AZ | 13.0% | 5,227 |
| Atlanta, GA | 11.7% | 2,982 |
| Tampa, FL | 10.9% | 6,669 |
| Miami, FL | 10.7% | 7,994 |
| Houston, TX | 9.5% | 3,074 |
| Dallas, TX | 9.3% | 4,114 |
| Seattle, WA | 9.0% | -3,528 |
| Chicago, IL | 8.8% | -5,681 |
| Detroit, MI | 8.6% | -4,554 |
| Philadelphia, PA | 8.1% | -901 |
| Denver, CO | 8.0% | -3,686 |
| Minneapolis, MN | 7.8% | -2,159 |
| San Diego, CA | 7.8% | 6,837 |
| Los Angeles, CA | 7.7% | -33,627 |
| Anchorage, AK | 7.6% | 53 |
| Boston, MA | 7.6% | -9,329 |
| St. Louis, MO | 7.5% | 451 |
| Washington, D.C. | 7.0% | -18,873 |
| Honolulu, HI | 6.7% | 1,283 |
| New York, NY | 6.4% | -23,551 |
| San Francisco/San Jose, CA | 5.7% | -37,788 |
Methodology
This report is based on a Redfin analysis of the correlation between inflation (the rising prices of goods and services) and migration in metro areas where inflation and migration data is available. Redfin migration data is aggregated to the combined statistical area (CSA). This analysis measures the popularity of migration destinations by net inflow, or how many more Redfin.com users are looking to move into a metro area than move out. Inflation rates are measured by the Bureau of Labor Statistics at the core-based statistical area (CBSA) by the Consumer Price Index, the average change over time in prices of goods and services such as fuel, energy and food. We calculated the quarterly average of the monthly inflation rates published by the BLS. The metro-level inflation rates cover one, two or three months during the quarter depending on the CBSA, as the BLS has different data release schedules for different CBSAs.


