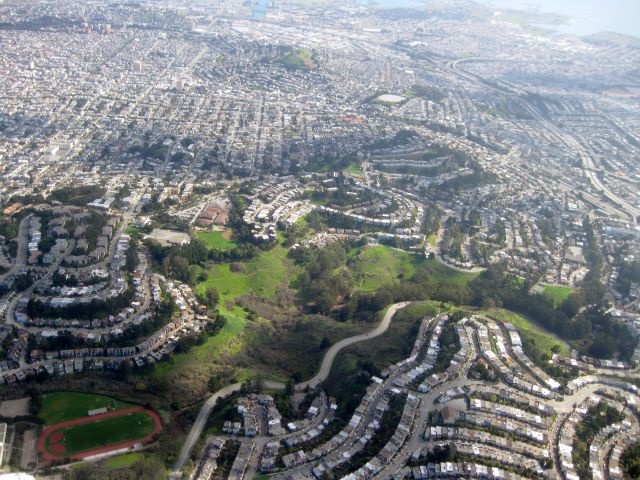
In San Francisco’s Sunset District, nearly 9 out of 10 homes sold for more than asking price; 66 percent of homes sold in the Fremont, California neighborhood of Ardenwood went for all cash.
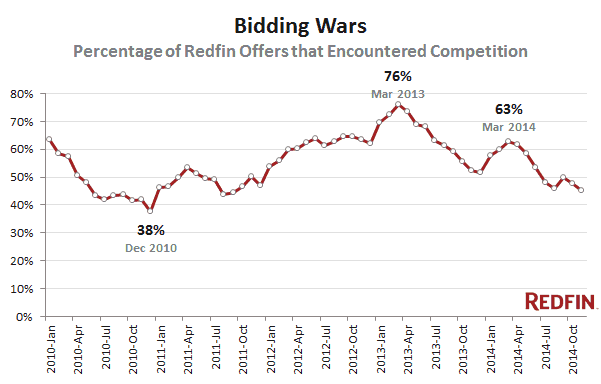
While home-buying competition eased nationally in 2014, only moderate relief came to buyers in some of the most competitive areas, including San Jose, Oakland, Los Angeles, Seattle and Portland. In 2014, 54 percent of all offers written by Redfin agents faced bidding wars, down from 64 percent in 2013. The percentage of homes that sold above list price dropped to 19 percent from 24 percent; fewer homes sold in under two weeks; and slightly fewer were purchased with cash.

But competition remained fierce in pockets across Redfin markets. Using Offer Insights data from Redfin agents about offers they wrote this year, as well as 2014 sales transactions from the MLS, we ranked the most competitive neighborhoods to buy a home in 2014. The neighborhood rank is based on the percentage of Redfin offers that encountered competition and the percentage of homes that sold above the list price.
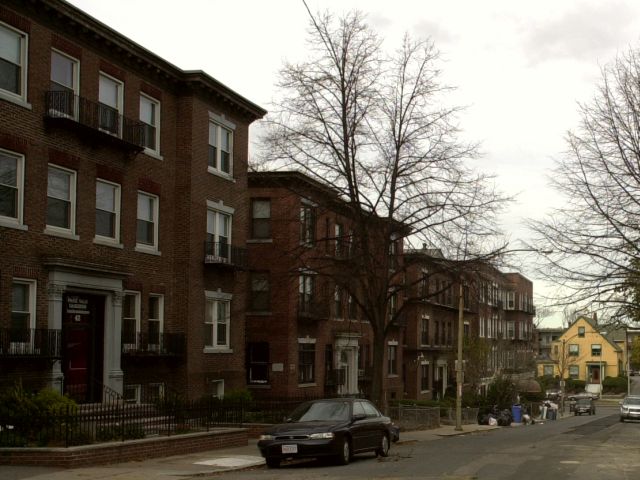
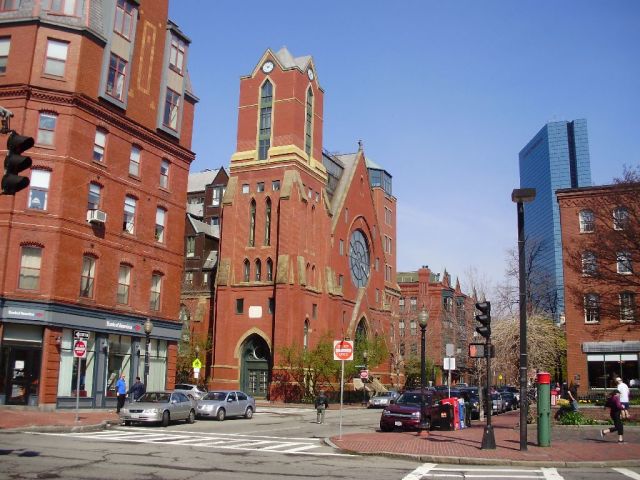
Noteworthy among the top 10 are trendy, expensive places like “Redfin Hottest Neighborhood” alum Bernal Heights in San Francisco, which earned its hype this year with 78 percent of homes selling above list price and 58 percent of Redfin offers facing a bidding war. In the Allston/Brighton neighborhood of Boston, which is between Harvard and Boston University, more than half of homes sold for all cash, driven in part by foreign buyers seeking housing for their college-bound kids and as investment properties for themselves. This made the local market extremely competitive for buyers, with seven of every 10 offers Redfin agents wrote facing multiple bids.
The 30 Most Competitive Neighborhoods to Buy a Home in 2014
| 1 |
Sunset District (San Francisco) |
 |
|
|
|
|
| Median Sale Price: |
$955,000 |
| 2014 Price Growth: |
12.5% |
| Homes sold: |
455 |
| |
|
| Days on Market: |
14 |
| Multiple Offers: |
54.2% |
| Average Number of Offers: |
5.5 |
| Sold Above Asking: |
87.9% |
| All Cash Offers: |
28.8% |
|
| “Formerly a neighborhood of last resort for San Francisco buyers, the Sunset is getting due respect for its density of good schools and relative affordability,” said Redfin agent Derrick Lee. “Older residents who have paid off their homes are cashing in while new families and renters are moving in. Cafes and trendy restaurants are popping up to cater to their tastes. Surfing and events like the free Stern Grove concert series and Outside Lands music festival are also drawing attention to the western most neighborhood in the city as well.” |
| 2 |
Castro (San Francisco) |
 |
|
|
|
|
| Median Sale Price: |
$1,294,500 |
| 2014 Price Growth: |
7.9% |
| Homes sold: |
128 |
| |
|
| Days on Market: |
13 |
| Multiple Offers: |
52.9% |
| Average Number of Offers: |
3.3 |
| Sold Above Asking: |
84.6% |
| All Cash Offers: |
28.2% |
|
| “I was recently able to help my clients buy a $2 million home in the Castro using the preemptive offer strategy, which means submitting a very competitive offer before the offer deadline to get the sellers to accept before reviewing all the other anticipated bids,” said Redfin agent Mark Colwell. “I’ve found that the bordering neighborhoods of Mission-Dolores and Duboce Triangle are certainly beginning to encroach on Castro’s territory, which can exasperate the inventory crunch issue for some Castro buyers who view the neighborhood as part of their identity.” |
| 3 |
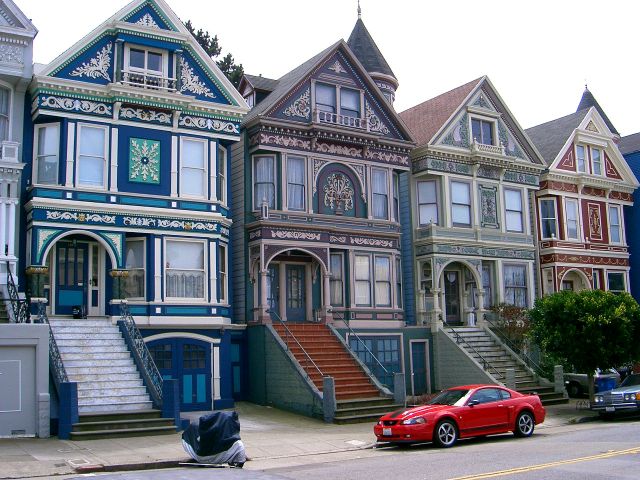
Bernal Heights (San Francisco) |
 |
|
|
|
|
| Median Sale Price: |
$1,050,000 |
| 2014 Price Growth: |
13.5% |
| Homes sold: |
171 |
| |
|
| Days on Market: |
13 |
| Multiple Offers: |
58.1% |
| Average Number of Offers: |
3.6 |
| Sold Above Asking: |
78.1% |
| All Cash Offers: |
19.4% |
|
| Redfin agent Miriam Westeberg said about Bernal Heights: “Nestled between 101 and 280, Bernal is a great location for those commuting south to Silicon Valley. However, unlike some southern neighborhoods, it maintains the San Francisco vibe with a variety of local cafes, boutiques, bars and Bernal Heights Park. Due to this draw, many Bernal properties are receiving multiple offers and some are selling for as much as 30 percent over their asking price.” |
| 4 |
Jamaica Plain (Boston) |
 |
|
|
|
|
| Median Sale Price: |
$457,000 |
| 2014 Price Growth: |
8.8% |
| Homes sold: |
355 |
| |
|
| Days on Market: |
16 |
| Multiple Offers: |
72.9% |
| Average Number of Offers: |
2.9 |
| Sold Above Asking: |
60.9% |
| All Cash Offers: |
13.9% |
|
| “Buyers are drawn to Jamaica Plain by the lifestyle of feeling like you’re not in the city with the arboretum and lots of outdoor space nearby with the convenience of three local T stops and being just a few miles from Fenway Park,” said Katie Gustafson, a Redfin agent in Boston. “In 2014, buyers had to waive mortgage and inspection contingencies just to get their foot in the door of this trendy neighborhood with a plethora of yoga and pilates studios and fair-trade coffee shops. In August and September, however, the local market reached a tipping point, as buyers became wary of overpaying, making it noticeably less competitive in Jamaica Plain as we head into 2015.” |
| 5 |
Silver Lake (Los Angeles) |
 |
|
|
|
|
| Median Sale Price: |
$822,000 |
| 2014 Price Growth: |
14.2% |
| Homes sold: |
213 |
| |
|
| Days on Market: |
15 |
| Multiple Offers: |
71.9% |
| Average Number of Offers: |
3.6 |
| Sold Above Asking: |
55.6% |
| All Cash Offers: |
29.2% |
|
| “Everyone wants to live in Silver Lake for several reasons,” said Earnest Watts, Redfin agent in Los Angeles. “Its location is very convenient to downtown, with access to several freeways, but it has several of its own local business corridors with popular restaurants, bars and shops. People who live in Silver Lake also enjoy a lot of lush, green outdoor space, set on hills surrounding a large reservoir and urban park. Another thing driving people to Silver Lake is Ivanhoe, a highly rated public elementary school, that a lot of buyers push to get into each spring and summer.” |
| 6 |
Almaden Valley (San Jose) |
 |
|
|
|
|
| Median Sale Price: |
$1,080,000 |
| 2014 Price Growth: |
15.1% |
| Homes sold: |
477 |
| |
|
| Days on Market: |
11 |
| Multiple Offers: |
56.7% |
| Average Number of Offers: |
2.3 |
| Sold Above Asking: |
65.7% |
| All Cash Offers: |
15.4% |
|
| “Almaden Valley is still hot, and demand stayed strong even at this normally slow time of year,” said Angela Langone, a Redfin agent in San Jose. “It’s common for listing agents here to price homes below market value and set offer deadlines to drum up initial interest. It’s not uncommon for my clients to compete with 15 to 20 other bidders for homes in this neighborhood. Prices here are slightly lower than other Silicon Valley neighborhoods because it’s located further from the freeway, but Almaden Valley is still attractive due to its long-established charm.” |
| 7 |
Ardenwood (Fremont, CA) |
 |
|
|
|
|
| Median Sale Price: |
$780,000 |
| 2014 Price Growth: |
11.3% |
| Homes sold: |
181 |
| |
|
| Days on Market: |
10 |
| Multiple Offers: |
44.7% |
| Average Number of Offers: |
5.6 |
| Sold Above Asking: |
75.7% |
| All Cash Offers: |
65.5% |
|
| “What is happening in Ardenwood is indicative of what is happening in all of Fremont,” said Redfin agent Bita Salamat in Oakland. “One of the biggest reasons homes sell high is because of schools; many have very high ratings and Ardenwood is no exception. That’s what brings people there. Its multicultural identity makes the area a little different although the people here are mostly Silicon Valley engineers. Many cannot afford Sunnyvale or Cupertino where they often work so good schools and proximity to those places are driving factors in Ardenwood.” |
| 8 |
Cambrian Park (San Jose) |
 |
|
|
|
|
| Median Sale Price: |
$812,000 |
| 2014 Price Growth: |
11.1% |
| Homes sold: |
894 |
| |
|
| Days on Market: |
13 |
| Multiple Offers: |
52.5% |
| Average Number of Offers: |
4.1 |
| Sold Above Asking: |
67.9% |
| All Cash Offers: |
14.2% |
|
| According to Angela Langone, Redfin agent in San Jose, “Buyers here enjoy being able to pay much less of a premium than in places like Cupertino or up the Peninsula, and they are confident they’re making a good investment here.” |
| 9 |
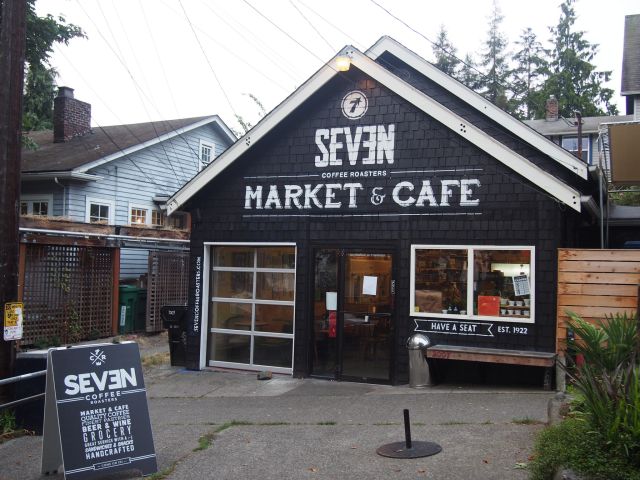
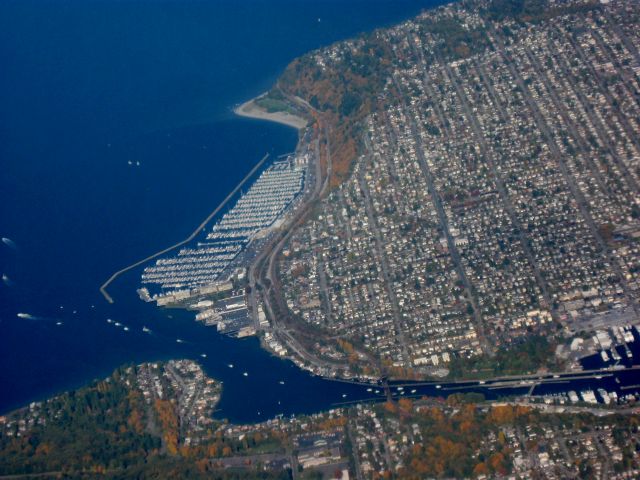
Ravenna (Seattle) |
 |
|
|
|
|
| Median Sale Price: |
$582,500 |
| 2014 Price Growth: |
11.5% |
| Homes sold: |
123 |
| |
|
| Days on Market: |
7 |
| Multiple Offers: |
62.9% |
| Average Number of Offers: |
4.2 |
| Sold Above Asking: |
57.3% |
| All Cash Offers: |
24.1% |
|
| Christy Kim, Redfin agent in Seattle, said, “Two major factors influenced real estate in Ravenna this year: Older homes being remodeled and flipped by investors and growing interest from international buyers paying in all cash. It was common for an international buyer to drop half a million for a town home so their children could have a place to live while attending college.” |
| 10 |
Allston / Brighton (Boston) |
 |
|
|
|
|
| Median Sale Price: |
$336,225 |
| 2014 Price Growth: |
8.5% |
| Homes sold: |
393 |
| |
|
| Days on Market: |
17 |
| Multiple Offers: |
70.0% |
| Average Number of Offers: |
3.4 |
| Sold Above Asking: |
49.5% |
| All Cash Offers: |
51.2% |
|
| Redfin agent Shawn Flynn shared an example of a competitive situation in Boston: “Among the offers we received for a two-bedroom, one-bathroom condo were ultimately three serious contenders. We didn’t go with the highest offer, but with the least risky. Still at $14,000 above list price, the winning buyer’s offer waived the mortgage, inspection and other contingencies so we knew the transaction would close without any issues.” |
| 11 |
Highland Park (Los Angeles) |
 |
|
|
|
|
| Median Sale Price: |
$520,000 |
| 2014 Price Growth: |
23.8% |
| Homes sold: |
262 |
| |
|
| Days on Market: |
15 |
| Multiple Offers: |
62.2% |
| Average Number of Offers: |
3.6 |
| Sold Above Asking: |
53.4% |
| All Cash Offers: |
26.2% |
|
|
| 12 |
NoMa (Washington, D.C.) |
 |
|
|
|
|
| Median Sale Price: |
$645,000 |
| 2014 Price Growth: |
7.2% |
| Homes sold: |
82 |
| |
|
| Days on Market: |
6 |
| Multiple Offers: |
62.5% |
| Average Number of Offers: |
4.4 |
| Sold Above Asking: |
48.8% |
| All Cash Offers: |
11.3% |
|
|
| 13 |
South End (Boston) |
 |
|
|
|
|
| Median Sale Price: |
$724,300 |
| 2014 Price Growth: |
8.8% |
| Homes sold: |
462 |
| |
|
| Days on Market: |
18 |
| Multiple Offers: |
60.0% |
| Average Number of Offers: |
3.1 |
| Sold Above Asking: |
48.9% |
| All Cash Offers: |
23.3% |
|
|
| 14 |
Hill East (Washington, D.C.) |
 |
|
|
|
|
| Median Sale Price: |
$642,000 |
| 2014 Price Growth: |
3.5% |
| Homes sold: |
198 |
| |
|
| Days on Market: |
7 |
| Multiple Offers: |
62.5% |
| Average Number of Offers: |
3.1 |
| Sold Above Asking: |
44.6% |
| All Cash Offers: |
10.8% |
|
|
| 15 |
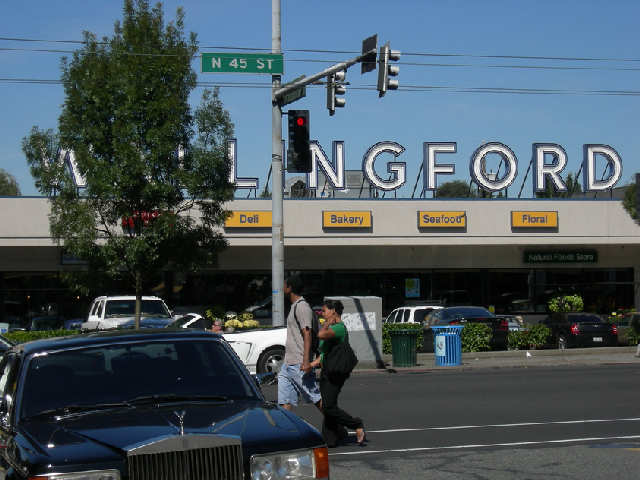
Wallingford (Seattle) |
 |
|
|
|
|
| Median Sale Price: |
$640,000 |
| 2014 Price Growth: |
15.3% |
| Homes sold: |
192 |
| |
|
| Days on Market: |
7 |
| Multiple Offers: |
53.8% |
| Average Number of Offers: |
2.7 |
| Sold Above Asking: |
52.3% |
| All Cash Offers: |
28.9% |
|
|
| 16 |
Capitol Hill (Washington, D.C.) |
 |
|
|
|
|
| Median Sale Price: |
$739,000 |
| 2014 Price Growth: |
-0.1% |
| Homes sold: |
339 |
| |
|
| Days on Market: |
8 |
| Multiple Offers: |
59.8% |
| Average Number of Offers: |
2.8 |
| Sold Above Asking: |
45.7% |
| All Cash Offers: |
18.1% |
|
|
| 17 |
Brookland (Washington, D.C.) |
 |
|
|
|
|
| Median Sale Price: |
$480,000 |
| 2014 Price Growth: |
6.7% |
| Homes sold: |
541 |
| |
|
| Days on Market: |
12 |
| Multiple Offers: |
69.1% |
| Average Number of Offers: |
3.1 |
| Sold Above Asking: |
33.0% |
| All Cash Offers: |
15.5% |
|
|
| 18 |
Back Bay, Beacon Hill (Boston) |
 |
|
|
|
|
| Median Sale Price: |
$862,000 |
| 2014 Price Growth: |
13.6% |
| Homes sold: |
474 |
| |
|
| Days on Market: |
25 |
| Multiple Offers: |
63.3% |
| Average Number of Offers: |
3.3 |
| Sold Above Asking: |
34.7% |
| All Cash Offers: |
41.5% |
|
|
| 19 |
Seward Park (Seattle) |
 |
|
|
|
|
| Median Sale Price: |
$520,100 |
| 2014 Price Growth: |
12.6% |
| Homes sold: |
121 |
| |
|
| Days on Market: |
8 |
| Multiple Offers: |
55.9% |
| Average Number of Offers: |
2.5 |
| Sold Above Asking: |
41.9% |
| All Cash Offers: |
15.9% |
|
|
| 20 |
Cardozo / Shaw (Washington, D.C.) |
 |
|
|
|
|
| Median Sale Price: |
$600,000 |
| 2014 Price Growth: |
4.4% |
| Homes sold: |
478 |
| |
|
| Days on Market: |
7 |
| Multiple Offers: |
51.2% |
| Average Number of Offers: |
2.9 |
| Sold Above Asking: |
44.1% |
| All Cash Offers: |
13.9% |
|
|
| 21 |
Education Hill (Redmond, WA) |
 |
|
|
|
|
| Median Sale Price: |
$500,000 |
| 2014 Price Growth: |
1.0% |
| Homes sold: |
231 |
| |
|
| Days on Market: |
8 |
| Multiple Offers: |
50.0% |
| Average Number of Offers: |
2.7 |
| Sold Above Asking: |
45.0% |
| All Cash Offers: |
24.8% |
|
|
| 22 |
Glen Park (San Francisco) |
 |
|
|
|
|
| Median Sale Price: |
$1,225,000 |
| 2014 Price Growth: |
7.5% |
| Homes sold: |
68 |
| |
|
| Days on Market: |
14 |
| Multiple Offers: |
– |
| Average Number of Offers: |
– |
| Sold Above Asking: |
84.7% |
| All Cash Offers: |
25.9% |
|
|
| 23 |
Westlake (San Francisco) |
 |
|
|
|
|
| Median Sale Price: |
$749,000 |
| 2014 Price Growth: |
11.8% |
| Homes sold: |
124 |
| |
|
| Days on Market: |
15 |
| Multiple Offers: |
– |
| Average Number of Offers: |
– |
| Sold Above Asking: |
84.5% |
| All Cash Offers: |
24.0% |
|
|
| 24 |
Brookvale (Fremont, CA) |
 |
|
|
|
|
| Median Sale Price: |
$800,000 |
| 2014 Price Growth: |
12.0% |
| Homes sold: |
54 |
| |
|
| Days on Market: |
10 |
| Multiple Offers: |
– |
| Average Number of Offers: |
– |
| Sold Above Asking: |
83.6% |
| All Cash Offers: |
5.4% |
|
|
| 25 |
Noe Valley (San Francisco) |
 |
|
|
|
|
| Median Sale Price: |
$1,599,500 |
| 2014 Price Growth: |
23.0% |
| Homes sold: |
194 |
| |
|
| Days on Market: |
13 |
| Multiple Offers: |
– |
| Average Number of Offers: |
– |
| Sold Above Asking: |
83.3% |
| All Cash Offers: |
29.3% |
|
|
| 26 |
Ballard (Seattle) |
 |
|
|
|
|
| Median Sale Price: |
$505,000 |
| 2014 Price Growth: |
12.5% |
| Homes sold: |
620 |
| |
|
| Days on Market: |
7 |
| Multiple Offers: |
43.9% |
| Average Number of Offers: |
2.5 |
| Sold Above Asking: |
48.7% |
| All Cash Offers: |
21.3% |
|
|
| 27 |
Petworth (Washington, D.C.) |
 |
|
|
|
|
| Median Sale Price: |
$571,500 |
| 2014 Price Growth: |
5.1% |
| Homes sold: |
209 |
| |
|
| Days on Market: |
12 |
| Multiple Offers: |
60.9% |
| Average Number of Offers: |
2.4 |
| Sold Above Asking: |
31.7% |
| All Cash Offers: |
15.5% |
|
|
| 28 |
Phinney Ridge (Seattle) |
 |
|
|
|
|
| Median Sale Price: |
$553,500 |
| 2014 Price Growth: |
10.2% |
| Homes sold: |
141 |
| |
|
| Days on Market: |
7 |
| Multiple Offers: |
47.8% |
| Average Number of Offers: |
2.0 |
| Sold Above Asking: |
44.4% |
| All Cash Offers: |
30.1% |
|
|
| 29 |
North Hollywood (Los Angeles) |
 |
|
|
|
|
| Median Sale Price: |
$410,000 |
| 2014 Price Growth: |
12.9% |
| Homes sold: |
491 |
| |
|
| Days on Market: |
17 |
| Multiple Offers: |
53.3% |
| Average Number of Offers: |
2.6 |
| Sold Above Asking: |
38.1% |
| All Cash Offers: |
27.8% |
|
|
| 30 |
Haight-Ashbury (San Francisco) |
 |
|
|
|
|
| Median Sale Price: |
$1,235,000 |
| 2014 Price Growth: |
8.6% |
| Homes sold: |
66 |
| |
|
| Days on Market: |
13 |
| Multiple Offers: |
– |
| Average Number of Offers: |
– |
| Sold Above Asking: |
80.9% |
| All Cash Offers: |
– |
|
|
The Most Competitive Places in Each Metro Area
Below, you can see the city or suburb, ZIP code and, in some cases, the neighborhood that was the most competitive in each of 38 areas.
| Atlanta |
| City / Suburb |
Neighborhood |
Zip Code |
|
Atlanta, GA
|
| Median Sale Price: |
| $223,000 |
|
| Homes sold: |
| 8,708 |
|
| Median Sale-to-list Difference: |
| -3.6% |
|
| 2014 Price Change: |
| 14.4% |
|
| Days on Market: |
| 32 |
|
| Sold Above Asking: |
| 16.3% |
|
| Multiple Offers: |
| 31.9% |
|
| Average Number of Offers: |
| 1.4 |
|
|
|
Oakhurst
|
| Median Sale Price: |
| $405,950 |
|
| Homes sold: |
| 74 |
|
| Median Sale-to-list Difference: |
| -1.1% |
|
| 2014 Price Change: |
| 17.7% |
|
| Days on Market: |
| 20 |
|
| Sold Above Asking: |
| 27.0% |
|
| Multiple Offers: |
| – |
|
| Average Number of Offers: |
| – |
|
|
|
30093
|
| Median Sale Price: |
| $108,500 |
|
| Homes sold: |
| 248 |
|
| Median Sale-to-list Difference: |
| 0.0% |
|
| 2014 Price Change: |
| 44.7% |
|
| Days on Market: |
| 34 |
|
| Sold Above Asking: |
| 42.1% |
|
| Multiple Offers: |
| – |
|
| Average Number of Offers: |
| – |
|
|
| Austin |
| City / Suburb |
Neighborhood |
Zip Code |
|
Austin, TX
|
| Median Sale Price: |
| $295,000 |
|
| Homes sold: |
| 11,882 |
|
| Median Sale-to-list Difference: |
| -1.3% |
|
| 2014 Price Change: |
| 9.6% |
|
| Days on Market: |
| 13 |
|
| Sold Above Asking: |
| 28.6% |
|
| Multiple Offers: |
| 37.0% |
|
| Average Number of Offers: |
| 1.4 |
|
|
|
Milwood
|
| Median Sale Price: |
| $265,000 |
|
| Homes sold: |
| 74 |
|
| Median Sale-to-list Difference: |
| 0.0% |
|
| 2014 Price Change: |
| 16.2% |
|
| Days on Market: |
| 7 |
|
| Sold Above Asking: |
| 48.0% |
|
| Multiple Offers: |
| – |
|
| Average Number of Offers: |
| – |
|
|
|
78613
|
| Median Sale Price: |
| $250,000 |
|
| Homes sold: |
| 1,440 |
|
| Median Sale-to-list Difference: |
| -1.6% |
|
| 2014 Price Change: |
| 9.4% |
|
| Days on Market: |
| 13 |
|
| Sold Above Asking: |
| 24.5% |
|
| Multiple Offers: |
| 36.7% |
|
| Average Number of Offers: |
| 1.3 |
|
|
| Baltimore |
| City / Suburb |
Zip Code |
|
Ellicott City, MD
|
| Median Sale Price: |
| $489,900 |
|
| Homes sold: |
| 812 |
|
| Median Sale-to-list Difference: |
| -2.6% |
|
| 2014 Price Change: |
| 6.0% |
|
| Days on Market: |
| 23 |
|
| Sold Above Asking: |
| 17.3% |
|
| Multiple Offers: |
| 44.9% |
|
| Average Number of Offers: |
| 1.6 |
|
|
|
21043
|
| Median Sale Price: |
| $415,000 |
|
| Homes sold: |
| 419 |
|
| Median Sale-to-list Difference: |
| -2.4% |
|
| 2014 Price Change: |
| 1.5% |
|
| Days on Market: |
| 24 |
|
| Sold Above Asking: |
| 20.3% |
|
| Multiple Offers: |
| 42.4% |
|
| Average Number of Offers: |
| 1.5 |
|
|
| Boston |
| City / Suburb |
Neighborhood |
Zip Code |
|
Cambridge, MA
|
| Median Sale Price: |
| $615,000 |
|
| Homes sold: |
| 691 |
|
| Median Sale-to-list Difference: |
| 2.3% |
|
| 2014 Price Change: |
| 12.6% |
|
| Days on Market: |
| 16 |
|
| Sold Above Asking: |
| 62.4% |
|
| Multiple Offers: |
| 71.6% |
|
| Average Number of Offers: |
| 3.0 |
|
|
|
Jamaica Plain
|
| Median Sale Price: |
| $457,000 |
|
| Homes sold: |
| 355 |
|
| Median Sale-to-list Difference: |
| 2.0% |
|
| 2014 Price Change: |
| 8.8% |
|
| Days on Market: |
| 16 |
|
| Sold Above Asking: |
| 60.9% |
|
| Multiple Offers: |
| 72.9% |
|
| Average Number of Offers: |
| 2.9 |
|
|
|
02139
|
| Median Sale Price: |
| $595,000 |
|
| Homes sold: |
| 200 |
|
| Median Sale-to-list Difference: |
| 4.8% |
|
| 2014 Price Change: |
| 10.6% |
|
| Days on Market: |
| 15 |
|
| Sold Above Asking: |
| 70.6% |
|
| Multiple Offers: |
| 75.8% |
|
| Average Number of Offers: |
| 3.8 |
|
|
| Boulder |
| City / Suburb |
Zip Code |
|
Louisville, CO
|
| Median Sale Price: |
| $436,500 |
|
| Homes sold: |
| 257 |
|
| Median Sale-to-list Difference: |
| 0.0% |
|
| 2014 Price Change: |
| 4.1% |
|
| Days on Market: |
| 10 |
|
| Sold Above Asking: |
| 37.5% |
|
| Multiple Offers: |
| – |
|
| Average Number of Offers: |
| – |
|
|
|
80026
|
| Median Sale Price: |
| $354,000 |
|
| Homes sold: |
| 507 |
|
| Median Sale-to-list Difference: |
| -0.6% |
|
| 2014 Price Change: |
| 18.0% |
|
| Days on Market: |
| 12 |
|
| Sold Above Asking: |
| 36.0% |
|
| Multiple Offers: |
| – |
|
| Average Number of Offers: |
| – |
|
|
| Chicago |
| City / Suburb |
Neighborhood |
Zip Code |
|
Skokie, IL
|
| Median Sale Price: |
| $240,000 |
|
| Homes sold: |
| 680 |
|
| Median Sale-to-list Difference: |
| -4.3% |
|
| 2014 Price Change: |
| 15.9% |
|
| Days on Market: |
| 20 |
|
| Sold Above Asking: |
| 20.1% |
|
| Multiple Offers: |
| 41.9% |
|
| Average Number of Offers: |
| 1.2 |
|
|
|
West Loop
|
| Median Sale Price: |
| $344,000 |
|
| Homes sold: |
| 589 |
|
| Median Sale-to-list Difference: |
| -1.1% |
|
| 2014 Price Change: |
| 10.6% |
|
| Days on Market: |
| 11 |
|
| Sold Above Asking: |
| 37.3% |
|
| Multiple Offers: |
| 41.8% |
|
| Average Number of Offers: |
| 1.4 |
|
|
|
60607
|
| Median Sale Price: |
| $331,950 |
|
| Homes sold: |
| 612 |
|
| Median Sale-to-list Difference: |
| -1.4% |
|
| 2014 Price Change: |
| 8.1% |
|
| Days on Market: |
| 15 |
|
| Sold Above Asking: |
| 33.6% |
|
| Multiple Offers: |
| 39.3% |
|
| Average Number of Offers: |
| 1.4 |
|
|
| Denver |
| City / Suburb |
Zip Code |
|
Lakewood, CO
|
| Median Sale Price: |
| $247,000 |
|
| Homes sold: |
| 2,240 |
|
| Median Sale-to-list Difference: |
| -0.9% |
|
| 2014 Price Change: |
| 5.1% |
|
| Days on Market: |
| 10 |
|
| Sold Above Asking: |
| 27.4% |
|
| Multiple Offers: |
| 44.1% |
|
| Average Number of Offers: |
| 1.9 |
|
|
|
80239
|
| Median Sale Price: |
| $186,750 |
|
| Homes sold: |
| 348 |
|
| Median Sale-to-list Difference: |
| 0.0% |
|
| 2014 Price Change: |
| 19.7% |
|
| Days on Market: |
| 9 |
|
| Sold Above Asking: |
| 49.2% |
|
| Multiple Offers: |
| – |
|
| Average Number of Offers: |
| – |
|
|
| Fort Lauderdale |
| City / Suburb |
Zip Code |
|
Pembroke Pines, FL
|
| Median Sale Price: |
| $208,750 |
|
| Homes sold: |
| 2,144 |
|
| Median Sale-to-list Difference: |
| -4.0% |
|
| 2014 Price Change: |
| 16.0% |
|
| Days on Market: |
| 45 |
|
| Sold Above Asking: |
| 18.6% |
|
| Multiple Offers: |
| 56.8% |
|
| Average Number of Offers: |
| 1.3 |
|
|
|
33023
|
| Median Sale Price: |
| $130,000 |
|
| Homes sold: |
| 609 |
|
| Median Sale-to-list Difference: |
| -3.9% |
|
| 2014 Price Change: |
| 18.2% |
|
| Days on Market: |
| 43 |
|
| Sold Above Asking: |
| 26.3% |
|
| Multiple Offers: |
| – |
|
| Average Number of Offers: |
| – |
|
|
| Fresno |
| City / Suburb |
Zip Code |
|
Coalinga, CA
|
| Median Sale Price: |
| $133,000 |
|
| Homes sold: |
| 75 |
|
| Median Sale-to-list Difference: |
| 0.0% |
|
| 2014 Price Change: |
| 15.7% |
|
| Days on Market: |
| 25 |
|
| Sold Above Asking: |
| 8.6% |
|
| Multiple Offers: |
| – |
|
| Average Number of Offers: |
| – |
|
|
|
93737
|
| Median Sale Price: |
| $270,000 |
|
| Homes sold: |
| 87 |
|
| Median Sale-to-list Difference: |
| 0.0% |
|
| 2014 Price Change: |
| 8.0% |
|
| Days on Market: |
| 49 |
|
| Sold Above Asking: |
| 12.2% |
|
| Multiple Offers: |
| – |
|
| Average Number of Offers: |
| – |
|
|
| Hampton Roads |
| City / Suburb |
Neighborhood |
Zip Code |
|
Suffolk, VA
|
| Median Sale Price: |
| $230,000 |
|
| Homes sold: |
| 1,118 |
|
| Median Sale-to-list Difference: |
| -1.6% |
|
| 2014 Price Change: |
| 2.2% |
|
| Days on Market: |
| 54 |
|
| Sold Above Asking: |
| 19.1% |
|
| Multiple Offers: |
| – |
|
| Average Number of Offers: |
| – |
|
|
|
East Ocean View
|
| Median Sale Price: |
| $359,900 |
|
| Homes sold: |
| 103 |
|
| Median Sale-to-list Difference: |
| -1.0% |
|
| 2014 Price Change: |
| -14.3% |
|
| Days on Market: |
| 65 |
|
| Sold Above Asking: |
| 20.4% |
|
| Multiple Offers: |
| – |
|
| Average Number of Offers: |
| – |
|
|
|
23523
|
| Median Sale Price: |
| $85,500 |
|
| Homes sold: |
| 61 |
|
| Median Sale-to-list Difference: |
| -4.8% |
|
| 2014 Price Change: |
| 3.0% |
|
| Days on Market: |
| 68 |
|
| Sold Above Asking: |
| 27.4% |
|
| Multiple Offers: |
| – |
|
| Average Number of Offers: |
| – |
|
|
| Houston |
| City / Suburb |
Neighborhood |
Zip Code |
|
Katy, TX
|
| Median Sale Price: |
| $238,000 |
|
| Homes sold: |
| 4,967 |
|
| Median Sale-to-list Difference: |
| -1.6% |
|
| 2014 Price Change: |
| 13.3% |
|
| Days on Market: |
| 16 |
|
| Sold Above Asking: |
| 26.0% |
|
| Multiple Offers: |
| 56.3% |
|
| Average Number of Offers: |
| 1.5 |
|
|
|
Greater Heights
|
| Median Sale Price: |
| $407,000 |
|
| Homes sold: |
| 1,434 |
|
| Median Sale-to-list Difference: |
| -0.5% |
|
| 2014 Price Change: |
| 16.3% |
|
| Days on Market: |
| 16 |
|
| Sold Above Asking: |
| 29.2% |
|
| Multiple Offers: |
| 60.5% |
|
| Average Number of Offers: |
| 1.7 |
|
|
|
77043
|
| Median Sale Price: |
| $258,000 |
|
| Homes sold: |
| 233 |
|
| Median Sale-to-list Difference: |
| 0.0% |
|
| 2014 Price Change: |
| 42.1% |
|
| Days on Market: |
| 12 |
|
| Sold Above Asking: |
| 41.0% |
|
| Multiple Offers: |
| – |
|
| Average Number of Offers: |
| – |
|
|
| Indianapolis |
| City / Suburb |
Zip Code |
|
Sheridan, IN
|
| Median Sale Price: |
| $104,750 |
|
| Homes sold: |
| 76 |
|
| Median Sale-to-list Difference: |
| -1.5% |
|
| 2014 Price Change: |
| -12.7% |
|
| Days on Market: |
| 96 |
|
| Sold Above Asking: |
| 13.2% |
|
| Multiple Offers: |
| – |
|
| Average Number of Offers: |
| – |
|
|
|
46218
|
| Median Sale Price: |
| $23,100 |
|
| Homes sold: |
| 177 |
|
| Median Sale-to-list Difference: |
| -7.9% |
|
| 2014 Price Change: |
| 10.0% |
|
| Days on Market: |
| 91 |
|
| Sold Above Asking: |
| 22.9% |
|
| Multiple Offers: |
| – |
|
| Average Number of Offers: |
| – |
|
|
| Las Vegas |
| City / Suburb |
Zip Code |
|
Las Vegas, NV
|
| Median Sale Price: |
| $177,400 |
|
| Homes sold: |
| 21,638 |
|
| Median Sale-to-list Difference: |
| -2.9% |
|
| 2014 Price Change: |
| 14.5% |
|
| Days on Market: |
| 70 |
|
| Sold Above Asking: |
| 21.6% |
|
| Multiple Offers: |
| 15.4% |
|
| Average Number of Offers: |
| 1.1 |
|
|
|
89101
|
| Median Sale Price: |
| $85,000 |
|
| Homes sold: |
| 191 |
|
| Median Sale-to-list Difference: |
| -1.4% |
|
| 2014 Price Change: |
| 30.8% |
|
| Days on Market: |
| 74 |
|
| Sold Above Asking: |
| 32.5% |
|
| Multiple Offers: |
| – |
|
| Average Number of Offers: |
| – |
|
|
| Long Island |
| City / Suburb |
Zip Code |
|
Lake Grove, NY
|
| Median Sale Price: |
| $348,250 |
|
| Homes sold: |
| 72 |
|
| Median Sale-to-list Difference: |
| -3.5% |
|
| 2014 Price Change: |
| -5.4% |
|
| Days on Market: |
| 59 |
|
| Sold Above Asking: |
| 21.6% |
|
| Multiple Offers: |
| – |
|
| Average Number of Offers: |
| – |
|
|
|
11755
|
| Median Sale Price: |
| $348,250 |
|
| Homes sold: |
| 72 |
|
| Median Sale-to-list Difference: |
| -3.5% |
|
| 2014 Price Change: |
| -5.4% |
|
| Days on Market: |
| 59 |
|
| Sold Above Asking: |
| 21.6% |
|
| Multiple Offers: |
| – |
|
| Average Number of Offers: |
| – |
|
|
| Los Angeles |
| City / Suburb |
Neighborhood |
Zip Code |
|
La Canada Flintridge, CA
|
| Median Sale Price: |
| $1,315,000 |
|
| Homes sold: |
| 230 |
|
| Median Sale-to-list Difference: |
| 0.0% |
|
| 2014 Price Change: |
| 6.5% |
|
| Days on Market: |
| 16 |
|
| Sold Above Asking: |
| 49.6% |
|
| Multiple Offers: |
| 64.1% |
|
| Average Number of Offers: |
| 4.1 |
|
|
|
Silver Lake
|
| Median Sale Price: |
| $822,000 |
|
| Homes sold: |
| 213 |
|
| Median Sale-to-list Difference: |
| 0.8% |
|
| 2014 Price Change: |
| 14.2% |
|
| Days on Market: |
| 15 |
|
| Sold Above Asking: |
| 55.6% |
|
| Multiple Offers: |
| 71.9% |
|
| Average Number of Offers: |
| 3.6 |
|
|
|
90026
|
| Median Sale Price: |
| $685,000 |
|
| Homes sold: |
| 182 |
|
| Median Sale-to-list Difference: |
| 0.8% |
|
| 2014 Price Change: |
| 6.3% |
|
| Days on Market: |
| 14 |
|
| Sold Above Asking: |
| 54.3% |
|
| Multiple Offers: |
| 68.6% |
|
| Average Number of Offers: |
| 3.1 |
|
|
| Miami |
| City / Suburb |
Zip Code |
|
Opa-Locka, FL
|
| Median Sale Price: |
| $73,724 |
|
| Homes sold: |
| 142 |
|
| Median Sale-to-list Difference: |
| -5.9% |
|
| 2014 Price Change: |
| 12.6% |
|
| Days on Market: |
| 46 |
|
| Sold Above Asking: |
| 34.9% |
|
| Multiple Offers: |
| – |
|
| Average Number of Offers: |
| – |
|
|
|
33055
|
| Median Sale Price: |
| $141,687 |
|
| Homes sold: |
| 254 |
|
| Median Sale-to-list Difference: |
| -2.3% |
|
| 2014 Price Change: |
| 26.2% |
|
| Days on Market: |
| 36 |
|
| Sold Above Asking: |
| 34.8% |
|
| Multiple Offers: |
| – |
|
| Average Number of Offers: |
| – |
|
|
| Minneapolis-St. Paul |
| City / Suburb |
Neighborhood |
Zip Code |
|
Isanti, MN
|
| Median Sale Price: |
| $148,470 |
|
| Homes sold: |
| 149 |
|
| Median Sale-to-list Difference: |
| 0.0% |
|
| 2014 Price Change: |
| 18.8% |
|
| Days on Market: |
| 34 |
|
| Sold Above Asking: |
| 27.6% |
|
| Multiple Offers: |
| – |
|
| Average Number of Offers: |
| – |
|
|
|
Minnehaha
|
| Median Sale Price: |
| $189,500 |
|
| Homes sold: |
| 88 |
|
| Median Sale-to-list Difference: |
| -2.2% |
|
| 2014 Price Change: |
| 8.5% |
|
| Days on Market: |
| 30 |
|
| Sold Above Asking: |
| 28.9% |
|
| Multiple Offers: |
| – |
|
| Average Number of Offers: |
| – |
|
|
|
55415
|
| Median Sale Price: |
| $430,608 |
|
| Homes sold: |
| 179 |
|
| Median Sale-to-list Difference: |
| 3.1% |
|
| 2014 Price Change: |
| 88.0% |
|
| Days on Market: |
| 2 |
|
| Sold Above Asking: |
| 66.8% |
|
| Multiple Offers: |
| – |
|
| Average Number of Offers: |
| – |
|
|
| Oakland |
| City / Suburb |
Neighborhood |
Zip Code |
|
Alameda, CA
|
| Median Sale Price: |
| $705,000 |
|
| Homes sold: |
| 455 |
|
| Median Sale-to-list Difference: |
| 4.8% |
|
| 2014 Price Change: |
| 17.5% |
|
| Days on Market: |
| 14 |
|
| Sold Above Asking: |
| 71.9% |
|
| Multiple Offers: |
| 81.0% |
|
| Average Number of Offers: |
| 3.6 |
|
|
|
Ardenwood (Fremont)
|
| Median Sale Price: |
| $780,000 |
|
| Homes sold: |
| 181 |
|
| Median Sale-to-list Difference: |
| 3.7% |
|
| 2014 Price Change: |
| 11.3% |
|
| Days on Market: |
| 10 |
|
| Sold Above Asking: |
| 75.7% |
|
| Multiple Offers: |
| 44.7% |
|
| Average Number of Offers: |
| 5.6 |
|
|
|
94602
|
| Median Sale Price: |
| $685,900 |
|
| Homes sold: |
| 273 |
|
| Median Sale-to-list Difference: |
| 12.4% |
|
| 2014 Price Change: |
| 9.9% |
|
| Days on Market: |
| 14 |
|
| Sold Above Asking: |
| 78.8% |
|
| Multiple Offers: |
| 75.8% |
|
| Average Number of Offers: |
| 4.5 |
|
|
| Orange County |
| City / Suburb |
Neighborhood |
Zip Code |
|
Fountain Valley, CA
|
| Median Sale Price: |
| $647,000 |
|
| Homes sold: |
| 351 |
|
| Median Sale-to-list Difference: |
| -1.5% |
|
| 2014 Price Change: |
| 7.8% |
|
| Days on Market: |
| 15 |
|
| Sold Above Asking: |
| 24.7% |
|
| Multiple Offers: |
| 54.8% |
|
| Average Number of Offers: |
| 1.9 |
|
|
|
North Park (Irvine, CA)
|
| Median Sale Price: |
| $663,000 |
|
| Homes sold: |
| 263 |
|
| Median Sale-to-list Difference: |
| -2.5% |
|
| 2014 Price Change: |
| 7.1% |
|
| Days on Market: |
| 19 |
|
| Sold Above Asking: |
| 11.0% |
|
| Multiple Offers: |
| 54.5% |
|
| Average Number of Offers: |
| 1.8 |
|
|
|
92708
|
| Median Sale Price: |
| $647,000 |
|
| Homes sold: |
| 351 |
|
| Median Sale-to-list Difference: |
| -1.5% |
|
| 2014 Price Change: |
| 7.8% |
|
| Days on Market: |
| 15 |
|
| Sold Above Asking: |
| 25.1% |
|
| Multiple Offers: |
| 57.6% |
|
| Average Number of Offers: |
| 2.0 |
|
|
| Orlando |
| City / Suburb |
Zip Code |
|
Mascotte, FL
|
| Median Sale Price: |
| $90,000 |
|
| Homes sold: |
| 62 |
|
| Median Sale-to-list Difference: |
| -0.8% |
|
| 2014 Price Change: |
| 6.0% |
|
| Days on Market: |
| 56 |
|
| Sold Above Asking: |
| 32.3% |
|
| Multiple Offers: |
| – |
|
| Average Number of Offers: |
| – |
|
|
|
32805
|
| Median Sale Price: |
| $45,500 |
|
| Homes sold: |
| 122 |
|
| Median Sale-to-list Difference: |
| -1.3% |
|
| 2014 Price Change: |
| 19.7% |
|
| Days on Market: |
| 43 |
|
| Sold Above Asking: |
| 32.5% |
|
| Multiple Offers: |
| – |
|
| Average Number of Offers: |
| – |
|
|
| Philadelphia |
| City / Suburb |
Neighborhood |
Zip Code |
|
Telford, PA
|
| Median Sale Price: |
| $235,000 |
|
| Homes sold: |
| 155 |
|
| Median Sale-to-list Difference: |
| -2.8% |
|
| 2014 Price Change: |
| -3.9% |
|
| Days on Market: |
| 68 |
|
| Sold Above Asking: |
| 25.2% |
|
| Multiple Offers: |
| – |
|
| Average Number of Offers: |
| – |
|
|
|
Newbold
|
| Median Sale Price: |
| $178,500 |
|
| Homes sold: |
| 197 |
|
| Median Sale-to-list Difference: |
| -3.4% |
|
| 2014 Price Change: |
| 13.7% |
|
| Days on Market: |
| 46 |
|
| Sold Above Asking: |
| 20.9% |
|
| Multiple Offers: |
| – |
|
| Average Number of Offers: |
| – |
|
|
|
18969
|
| Median Sale Price: |
| $235,500 |
|
| Homes sold: |
| 160 |
|
| Median Sale-to-list Difference: |
| -2.8% |
|
| 2014 Price Change: |
| -2.7% |
|
| Days on Market: |
| 71 |
|
| Sold Above Asking: |
| 24.7% |
|
| Multiple Offers: |
| – |
|
| Average Number of Offers: |
| – |
|
|
| Phoenix |
| City / Suburb |
Zip Code |
|
Phoenix, AZ
|
| Median Sale Price: |
| $173,000 |
|
| Homes sold: |
| 15,154 |
|
| Median Sale-to-list Difference: |
| -4.2% |
|
| 2014 Price Change: |
| 11.6% |
|
| Days on Market: |
| 33 |
|
| Sold Above Asking: |
| 13.2% |
|
| Multiple Offers: |
| 20.4% |
|
| Average Number of Offers: |
| 1.1 |
|
|
|
85033
|
| Median Sale Price: |
| $100,000 |
|
| Homes sold: |
| 392 |
|
| Median Sale-to-list Difference: |
| -2.4% |
|
| 2014 Price Change: |
| 25.1% |
|
| Days on Market: |
| 28 |
|
| Sold Above Asking: |
| 26.3% |
|
| Multiple Offers: |
| – |
|
| Average Number of Offers: |
| – |
|
|
| Portland |
| City / Suburb |
Neighborhood |
Zip Code |
|
Portland, OR
|
| Median Sale Price: |
| $317,762 |
|
| Homes sold: |
| 10,003 |
|
| Median Sale-to-list Difference: |
| -0.7% |
|
| 2014 Price Change: |
| 7.4% |
|
| Days on Market: |
| 15 |
|
| Sold Above Asking: |
| 31.3% |
|
| Multiple Offers: |
| 48.3% |
|
| Average Number of Offers: |
| 2.1 |
|
|
|
Woodstock
|
| Median Sale Price: |
| $320,000 |
|
| Homes sold: |
| 159 |
|
| Median Sale-to-list Difference: |
| 0.1% |
|
| 2014 Price Change: |
| 14.5% |
|
| Days on Market: |
| 6 |
|
| Sold Above Asking: |
| 52.2% |
|
| Multiple Offers: |
| – |
|
| Average Number of Offers: |
| – |
|
|
|
97217
|
| Median Sale Price: |
| $310,000 |
|
| Homes sold: |
| 533 |
|
| Median Sale-to-list Difference: |
| 0.0% |
|
| 2014 Price Change: |
| 14.4% |
|
| Days on Market: |
| 10 |
|
| Sold Above Asking: |
| 41.7% |
|
| Multiple Offers: |
| 66.7% |
|
| Average Number of Offers: |
| 3.3 |
|
|
| Providence |
| City / Suburb |
Neighborhood |
Zip Code |
|
Smithfield, RI
|
| Median Sale Price: |
| $242,250 |
|
| Homes sold: |
| 187 |
|
| Median Sale-to-list Difference: |
| -3.0% |
|
| 2014 Price Change: |
| 17.0% |
|
| Days on Market: |
| 28 |
|
| Sold Above Asking: |
| 20.5% |
|
| Multiple Offers: |
| – |
|
| Average Number of Offers: |
| – |
|
|
|
Mount Pleasant
|
| Median Sale Price: |
| $129,500 |
|
| Homes sold: |
| 58 |
|
| Median Sale-to-list Difference: |
| -4.1% |
|
| 2014 Price Change: |
| 6.6% |
|
| Days on Market: |
| 50 |
|
| Sold Above Asking: |
| 18.3% |
|
| Multiple Offers: |
| – |
|
| Average Number of Offers: |
| – |
|
|
|
02917
|
| Median Sale Price: |
| $252,500 |
|
| Homes sold: |
| 110 |
|
| Median Sale-to-list Difference: |
| -2.7% |
|
| 2014 Price Change: |
| 20.2% |
|
| Days on Market: |
| 25 |
|
| Sold Above Asking: |
| 26.1% |
|
| Multiple Offers: |
| – |
|
| Average Number of Offers: |
| – |
|
|
| Raleigh-Durham |
| City / Suburb |
Zip Code |
|
Morrisville, NC
|
| Median Sale Price: |
| $258,250 |
|
| Homes sold: |
| 445 |
|
| Median Sale-to-list Difference: |
| -1.3% |
|
| 2014 Price Change: |
| 12.0% |
|
| Days on Market: |
| 47 |
|
| Sold Above Asking: |
| 27.8% |
|
| Multiple Offers: |
| – |
|
| Average Number of Offers: |
| – |
|
|
|
27560
|
| Median Sale Price: |
| $270,000 |
|
| Homes sold: |
| 454 |
|
| Median Sale-to-list Difference: |
| -1.3% |
|
| 2014 Price Change: |
| 17.2% |
|
| Days on Market: |
| 47 |
|
| Sold Above Asking: |
| 27.7% |
|
| Multiple Offers: |
| – |
|
| Average Number of Offers: |
| – |
|
|
| Riverside-San Bernardino |
| City / Suburb |
Neighborhood |
Zip Code |
|
Chino, CA
|
| Median Sale Price: |
| $388,000 |
|
| Homes sold: |
| 695 |
|
| Median Sale-to-list Difference: |
| -1.4% |
|
| 2014 Price Change: |
| 12.5% |
|
| Days on Market: |
| 19 |
|
| Sold Above Asking: |
| 25.7% |
|
| Multiple Offers: |
| 58.8% |
|
| Average Number of Offers: |
| 2.0 |
|
|
|
Southridge Village
|
| Median Sale Price: |
| $276,000 |
|
| Homes sold: |
| 263 |
|
| Median Sale-to-list Difference: |
| 0.0% |
|
| 2014 Price Change: |
| 20.0% |
|
| Days on Market: |
| 11 |
|
| Sold Above Asking: |
| 45.4% |
|
| Multiple Offers: |
| – |
|
| Average Number of Offers: |
| – |
|
|
|
92882
|
| Median Sale Price: |
| $388,000 |
|
| Homes sold: |
| 568 |
|
| Median Sale-to-list Difference: |
| -1.0% |
|
| 2014 Price Change: |
| 10.5% |
|
| Days on Market: |
| 16 |
|
| Sold Above Asking: |
| 29.6% |
|
| Multiple Offers: |
| 50.0% |
|
| Average Number of Offers: |
| 1.3 |
|
|
| Sacramento |
| City / Suburb |
Neighborhood |
Zip Code |
|
Elk Grove, CA
|
| Median Sale Price: |
| $308,000 |
|
| Homes sold: |
| 1,965 |
|
| Median Sale-to-list Difference: |
| -0.7% |
|
| 2014 Price Change: |
| 13.2% |
|
| Days on Market: |
| 41 |
|
| Sold Above Asking: |
| 35.3% |
|
| Multiple Offers: |
| 32.8% |
|
| Average Number of Offers: |
| 1.4 |
|
|
|
Robla
|
| Median Sale Price: |
| $199,000 |
|
| Homes sold: |
| 72 |
|
| Median Sale-to-list Difference: |
| 0.0% |
|
| 2014 Price Change: |
| 15.2% |
|
| Days on Market: |
| 139 |
|
| Sold Above Asking: |
| 40.8% |
|
| Multiple Offers: |
| – |
|
| Average Number of Offers: |
| – |
|
|
|
95765
|
| Median Sale Price: |
| $403,750 |
|
| Homes sold: |
| 515 |
|
| Median Sale-to-list Difference: |
| -1.2% |
|
| 2014 Price Change: |
| 10.6% |
|
| Days on Market: |
| – |
|
| Sold Above Asking: |
| 24.3% |
|
| Multiple Offers: |
| 42.9% |
|
| Average Number of Offers: |
| 1.7 |
|
|
| San Antonio |
| City / Suburb |
Neighborhood |
Zip Code |
|
Selma, TX
|
| Median Sale Price: |
| $161,000 |
|
| Homes sold: |
| 73 |
|
| Median Sale-to-list Difference: |
| -1.2% |
|
| 2014 Price Change: |
| 8.1% |
|
| Days on Market: |
| 20 |
|
| Sold Above Asking: |
| 23.3% |
|
| Multiple Offers: |
| – |
|
| Average Number of Offers: |
| – |
|
|
|
Great Northwest
|
| Median Sale Price: |
| $127,000 |
|
| Homes sold: |
| 175 |
|
| Median Sale-to-list Difference: |
| -0.8% |
|
| 2014 Price Change: |
| 9.5% |
|
| Days on Market: |
| 15 |
|
| Sold Above Asking: |
| 30.4% |
|
| Multiple Offers: |
| – |
|
| Average Number of Offers: |
| – |
|
|
|
78222-3457
|
| Median Sale Price: |
| $164,900 |
|
| Homes sold: |
| 50 |
|
| Median Sale-to-list Difference: |
| 0.0% |
|
| 2014 Price Change: |
| – |
|
| Days on Market: |
| 7 |
|
| Sold Above Asking: |
| 36.5% |
|
| Multiple Offers: |
| – |
|
| Average Number of Offers: |
| – |
|
|
| San Diego |
| City / Suburb |
Neighborhood |
Zip Code |
|
San Marcos, CA
|
| Median Sale Price: |
| $469,000 |
|
| Homes sold: |
| 991 |
|
| Median Sale-to-list Difference: |
| -2.5% |
|
| 2014 Price Change: |
| 11.2% |
|
| Days on Market: |
| 18 |
|
| Sold Above Asking: |
| 15.3% |
|
| Multiple Offers: |
| 51.6% |
|
| Average Number of Offers: |
| 1.6 |
|
|
|
Rancho del Rey
|
| Median Sale Price: |
| $445,000 |
|
| Homes sold: |
| 182 |
|
| Median Sale-to-list Difference: |
| -1.6% |
|
| 2014 Price Change: |
| 11.3% |
|
| Days on Market: |
| 20 |
|
| Sold Above Asking: |
| 28.4% |
|
| Multiple Offers: |
| – |
|
| Average Number of Offers: |
| – |
|
|
|
92126
|
| Median Sale Price: |
| $428,450 |
|
| Homes sold: |
| 558 |
|
| Median Sale-to-list Difference: |
| -2.3% |
|
| 2014 Price Change: |
| 10.1% |
|
| Days on Market: |
| 16 |
|
| Sold Above Asking: |
| 18.6% |
|
| Multiple Offers: |
| 65.1% |
|
| Average Number of Offers: |
| 2.1 |
|
|
| San Francisco |
| City / Suburb |
Neighborhood |
Zip Code |
|
Daly City, CA
|
| Median Sale Price: |
| $660,000 |
|
| Homes sold: |
| 486 |
|
| Median Sale-to-list Difference: |
| 5.3% |
|
| 2014 Price Change: |
| 10.9% |
|
| Days on Market: |
| 17 |
|
| Sold Above Asking: |
| 75.7% |
|
| Multiple Offers: |
| 65.6% |
|
| Average Number of Offers: |
| 4.5 |
|
|
|
Sunset District
|
| Median Sale Price: |
| $955,000 |
|
| Homes sold: |
| 455 |
|
| Median Sale-to-list Difference: |
| 13.5% |
|
| 2014 Price Change: |
| 12.5% |
|
| Days on Market: |
| 14 |
|
| Sold Above Asking: |
| 87.9% |
|
| Multiple Offers: |
| 54.2% |
|
| Average Number of Offers: |
| 5.5 |
|
|
|
94110
|
| Median Sale Price: |
| $1,050,000 |
|
| Homes sold: |
| 384 |
|
| Median Sale-to-list Difference: |
| 11.9% |
|
| 2014 Price Change: |
| 15.2% |
|
| Days on Market: |
| 13 |
|
| Sold Above Asking: |
| 79.1% |
|
| Multiple Offers: |
| 61.7% |
|
| Average Number of Offers: |
| 3.0 |
|
|
| San Jose |
| City / Suburb |
Neighborhood |
Zip Code |
|
Santa Clara, CA
|
| Median Sale Price: |
| $752,000 |
|
| Homes sold: |
| 771 |
|
| Median Sale-to-list Difference: |
| 4.8% |
|
| 2014 Price Change: |
| 13.1% |
|
| Days on Market: |
| 11 |
|
| Sold Above Asking: |
| 75.3% |
|
| Multiple Offers: |
| 71.8% |
|
| Average Number of Offers: |
| 7.7 |
|
|
|
Almaden Valley
|
| Median Sale Price: |
| $1,080,000 |
|
| Homes sold: |
| 477 |
|
| Median Sale-to-list Difference: |
| 2.8% |
|
| 2014 Price Change: |
| 15.1% |
|
| Days on Market: |
| 11 |
|
| Sold Above Asking: |
| 65.7% |
|
| Multiple Offers: |
| 56.7% |
|
| Average Number of Offers: |
| 2.3 |
|
|
|
95051
|
| Median Sale Price: |
| $775,500 |
|
| Homes sold: |
| 355 |
|
| Median Sale-to-list Difference: |
| 6.1% |
|
| 2014 Price Change: |
| 14.7% |
|
| Days on Market: |
| 10 |
|
| Sold Above Asking: |
| 77.8% |
|
| Multiple Offers: |
| 70.7% |
|
| Average Number of Offers: |
| 8.7 |
|
|
| Seattle |
| City / Suburb |
Neighborhood |
Zip Code |
|
Kenmore, WA
|
| Median Sale Price: |
| $425,000 |
|
| Homes sold: |
| 315 |
|
| Median Sale-to-list Difference: |
| -0.3% |
|
| 2014 Price Change: |
| 11.3% |
|
| Days on Market: |
| 14 |
|
| Sold Above Asking: |
| 31.6% |
|
| Multiple Offers: |
| 51.4% |
|
| Average Number of Offers: |
| 2.6 |
|
|
|
Ravenna
|
| Median Sale Price: |
| $582,500 |
|
| Homes sold: |
| 123 |
|
| Median Sale-to-list Difference: |
| 1.2% |
|
| 2014 Price Change: |
| 11.5% |
|
| Days on Market: |
| 7 |
|
| Sold Above Asking: |
| 57.3% |
|
| Multiple Offers: |
| 62.9% |
|
| Average Number of Offers: |
| 4.2 |
|
|
|
98008
|
| Median Sale Price: |
| $520,000 |
|
| Homes sold: |
| 273 |
|
| Median Sale-to-list Difference: |
| 0.0% |
|
| 2014 Price Change: |
| 10.6% |
|
| Days on Market: |
| 9 |
|
| Sold Above Asking: |
| 46.4% |
|
| Multiple Offers: |
| 50.6% |
|
| Average Number of Offers: |
| 4.4 |
|
|
| Tacoma |
| City / Suburb |
Zip Code |
|
Tacoma, WA
|
| Median Sale Price: |
| $181,950 |
|
| Homes sold: |
| 3,349 |
|
| Median Sale-to-list Difference: |
| -2.8% |
|
| 2014 Price Change: |
| 10.3% |
|
| Days on Market: |
| 37 |
|
| Sold Above Asking: |
| 22.5% |
|
| Multiple Offers: |
| 25.4% |
|
| Average Number of Offers: |
| 1.3 |
|
|
|
98404
|
| Median Sale Price: |
| $160,000 |
|
| Homes sold: |
| 462 |
|
| Median Sale-to-list Difference: |
| -1.0% |
|
| 2014 Price Change: |
| 18.8% |
|
| Days on Market: |
| 34 |
|
| Sold Above Asking: |
| 32.0% |
|
| Multiple Offers: |
| – |
|
| Average Number of Offers: |
| – |
|
|
| Tampa |
| City / Suburb |
Neighborhood |
Zip Code |
|
Seffner, FL
|
| Median Sale Price: |
| $130,000 |
|
| Homes sold: |
| 317 |
|
| Median Sale-to-list Difference: |
| -3.5% |
|
| 2014 Price Change: |
| 5.1% |
|
| Days on Market: |
| 44 |
|
| Sold Above Asking: |
| 20.7% |
|
| Multiple Offers: |
| – |
|
| Average Number of Offers: |
| – |
|
|
|
Highland Grove
|
| Median Sale Price: |
| $65,000 |
|
| Homes sold: |
| 68 |
|
| Median Sale-to-list Difference: |
| -3.5% |
|
| 2014 Price Change: |
| 3.2% |
|
| Days on Market: |
| 40 |
|
| Sold Above Asking: |
| 31.0% |
|
| Multiple Offers: |
| – |
|
| Average Number of Offers: |
| – |
|
|
|
33625
|
| Median Sale Price: |
| $177,000 |
|
| Homes sold: |
| 356 |
|
| Median Sale-to-list Difference: |
| -1.5% |
|
| 2014 Price Change: |
| 14.2% |
|
| Days on Market: |
| 30 |
|
| Sold Above Asking: |
| 26.5% |
|
| Multiple Offers: |
| – |
|
| Average Number of Offers: |
| – |
|
|
| Tucson |
| City / Suburb |
Neighborhood |
Zip Code |
|
Vail, AZ
|
| Median Sale Price: |
| $217,870 |
|
| Homes sold: |
| 389 |
|
| Median Sale-to-list Difference: |
| -3.6% |
|
| 2014 Price Change: |
| 3.7% |
|
| Days on Market: |
| 55 |
|
| Sold Above Asking: |
| 14.0% |
|
| Multiple Offers: |
| – |
|
| Average Number of Offers: |
| – |
|
|
|
Cherry Avenue
|
| Median Sale Price: |
| $91,900 |
|
| Homes sold: |
| 58 |
|
| Median Sale-to-list Difference: |
| -1.8% |
|
| 2014 Price Change: |
| 30.8% |
|
| Days on Market: |
| 21 |
|
| Sold Above Asking: |
| 35.0% |
|
| Multiple Offers: |
| – |
|
| Average Number of Offers: |
| – |
|
|
|
85714
|
| Median Sale Price: |
| $75,000 |
|
| Homes sold: |
| 66 |
|
| Median Sale-to-list Difference: |
| -4.7% |
|
| 2014 Price Change: |
| 29.0% |
|
| Days on Market: |
| 23 |
|
| Sold Above Asking: |
| 28.6% |
|
| Multiple Offers: |
| – |
|
| Average Number of Offers: |
| – |
|
|
| Ventura County |
| City / Suburb |
Neighborhood |
Zip Code |
|
Simi Valley, CA
|
| Median Sale Price: |
| $462,000 |
|
| Homes sold: |
| 1,211 |
|
| Median Sale-to-list Difference: |
| -2.2% |
|
| 2014 Price Change: |
| 8.7% |
|
| Days on Market: |
| 25 |
|
| Sold Above Asking: |
| 18.9% |
|
| Multiple Offers: |
| 46.4% |
|
| Average Number of Offers: |
| 1.5 |
|
|
|
RiverPark
|
| Median Sale Price: |
| $329,000 |
|
| Homes sold: |
| 71 |
|
| Median Sale-to-list Difference: |
| -2.4% |
|
| 2014 Price Change: |
| 6.4% |
|
| Days on Market: |
| 43 |
|
| Sold Above Asking: |
| 8.5% |
|
| Multiple Offers: |
| – |
|
| Average Number of Offers: |
| – |
|
|
|
93065
|
| Median Sale Price: |
| $464,000 |
|
| Homes sold: |
| 682 |
|
| Median Sale-to-list Difference: |
| -2.2% |
|
| 2014 Price Change: |
| 7.7% |
|
| Days on Market: |
| 27 |
|
| Sold Above Asking: |
| 19.0% |
|
| Multiple Offers: |
| 55.6% |
|
| Average Number of Offers: |
| 1.6 |
|
|
| Washington, D.C. |
| City / Suburb |
Neighborhood |
Zip Code |
|
Washington, DC
|
| Median Sale Price: |
| $499,900 |
|
| Homes sold: |
| 6,749 |
|
| Median Sale-to-list Difference: |
| 0.0% |
|
| 2014 Price Change: |
| 5.2% |
|
| Days on Market: |
| 11 |
|
| Sold Above Asking: |
| 33.5% |
|
| Multiple Offers: |
| 53.2% |
|
| Average Number of Offers: |
| 2.4 |
|
|
|
NoMa
|
| Median Sale Price: |
| $645,000 |
|
| Homes sold: |
| 82 |
|
| Median Sale-to-list Difference: |
| 0.0% |
|
| 2014 Price Change: |
| 7.2% |
|
| Days on Market: |
| 6 |
|
| Sold Above Asking: |
| 48.8% |
|
| Multiple Offers: |
| 62.5% |
|
| Average Number of Offers: |
| 4.4 |
|
|
|
20003
|
| Median Sale Price: |
| $605,000 |
|
| Homes sold: |
| 400 |
|
| Median Sale-to-list Difference: |
| 0.0% |
|
| 2014 Price Change: |
| 0.8% |
|
| Days on Market: |
| 8 |
|
| Sold Above Asking: |
| 41.6% |
|
| Multiple Offers: |
| 61.2% |
|
| Average Number of Offers: |
| 2.8 |
|
|
| West Palm Beach |
| City / Suburb |
Zip Code |
|
Palm Springs, FL
|
| Median Sale Price: |
| $85,000 |
|
| Homes sold: |
| 235 |
|
| Median Sale-to-list Difference: |
| -4.9% |
|
| 2014 Price Change: |
| 21.3% |
|
| Days on Market: |
| 37 |
|
| Sold Above Asking: |
| 24.6% |
|
| Multiple Offers: |
| – |
|
| Average Number of Offers: |
| – |
|
|
|
33406
|
| Median Sale Price: |
| $122,500 |
|
| Homes sold: |
| 293 |
|
| Median Sale-to-list Difference: |
| -3.1% |
|
| 2014 Price Change: |
| 26.3% |
|
| Days on Market: |
| 38 |
|
| Sold Above Asking: |
| 29.7% |
|
| Multiple Offers: |
| – |
|
| Average Number of Offers: |
| – |
|
|
Which neighborhoods will be most competitive in 2015? Next month, we’ll be publishing our Hottest Neighborhoods in 2015 report, an analysis of Redfin.com user activity data and local Redfin agent insights to look ahead at which neighborhoods will be the hottest in the year to come.


