
Introducing the new national & regional metrics
Redfin releases data on a variety of housing indicators each month on our Data Center. Most of the data for these metrics come directly from the local Multiple Listing Services (MLS). Additionally, a handful of metrics are verified with public records data. Historically, all of Redfin’s housing metrics were first calculated at the county and metropolitan division level, then a weighted average (by the number of home sales transactions) was used for each month to derive the national estimates.
As of February 2020, Redfin actively imports data across more than 145 MLS in about 1,200 counties, covering roughly 80% of the U.S. population. As is common with most data from the private sector, our data coverage is slightly biased toward the Northeast and West regions of the country, where we cover a greater portion of the population at 90% and 88%, respectively. In contrast, we only cover 70% of the population in the South and Midwest regions. Additionally, the year in which our data begins in each county varies considerably, which impacts the year-over-year or month-over-month comparisons that we provide. For example, when measuring growth in new listings or home sales, growth rates were biased upward due to expanding coverage of the market. Our home prices were also biased in favor of more expensive markets, since that is where we have the most data coverage.
Historically Consistent
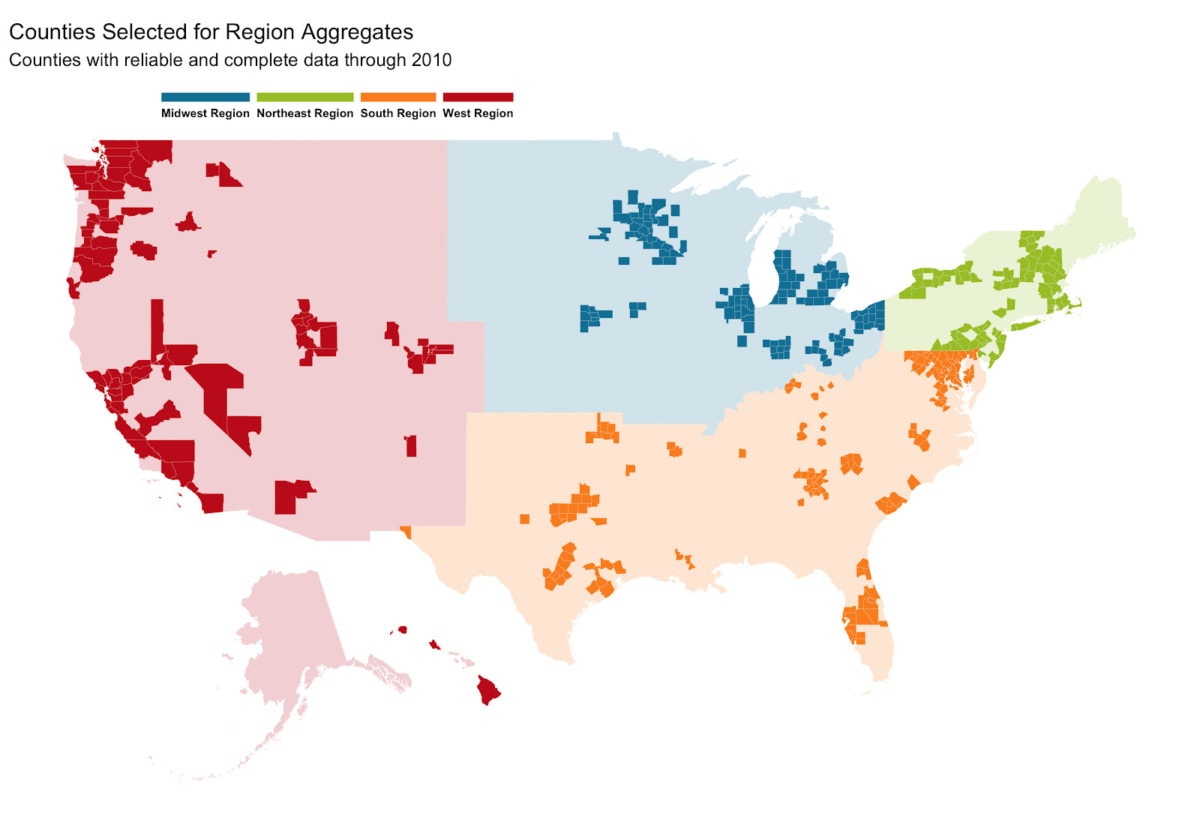
For the reasons above, we have revised our methodology for calculating national housing market metrics. As of March 2020, we first subset the counties for which we have the most complete historical dataset through January 2010. Then, of these counties, we choose the ones with the most reliable data. This provides a consistent base of counties for which to build reliable estimates for each of the four Census Regions as well as a national figure. Currently, this includes nearly 450 counties, representing more than 80 MLS feeds and about half the U.S. population.
Representative Sample
The counties selected within each region are sufficiently representative of each of their respective regions. This means that the home sales growth of the subset of counties in the West Region closely represents the true home sales growth for all counties in the West Region when we compare our estimates with other national housing data providers. Using this breakdown, we also capture more existing home listings and sales transactions than new construction and the market coverage of this breakdown varies within each region.
Region Specific Weighting
Our new method first creates aggregated metrics for each of the four Census Regions for existing and new construction properties separately. Then, these eight components are combined with distinct weights given to each region to make up the national metrics for the existing, new, or the overall market. The regional weighting for existing home sales was calculated by computing the average percent of raw home sales as reported by the National Association of Realtors (NAR) in each region between 2016 and 2018. The new construction weights were derived from comparing the percent of single-family new construction transactions we capture in our data as compared with the total reported by Census/HUD between 2016 and 2018.
| Region | Existing | New Construction |
|---|---|---|
| Northeast Region | 2.60 | 2.77 |
| Midwest Region | 3.15 | 3.77 |
| South Region | 3.37 | 3.52 |
| West Region | 1.89 | 3.89 |
We then report the overall combined national values, which includes all property types (single-family, condos, townhomes, and multi-family 2-4 unit properties) for each new construction and existing homes in contrast with both the NAR and Census/HUD releases. We believe these new national metrics to be more nationally representative of the overall U.S. housing market and provide more insights by having regional breakouts for each property type for both new and existing homes. We will revisit the counties selected for the sample as well as the overall weights assigned to each region annually in January for future revisions.
Seasonal Adjustment Methodology
In addition to creating new raw regional and national series, we will also seasonally adjust all the metrics. We currently seasonally adjust all housing metrics for counties, metro areas, regions and our national series. The seasonal adjustment is done using the United States Census Bureau’s X-13 ARIMA-SEATS Seasonal Adjustment Program. This model breaks the components of each time series into a trend, seasonal, and irregular component and controls for additional factors such as calendar/trading day effects. Seasonality can be additive or multiplicative and change over time, which can be common in housing markets.
This process allows us to compare recent development in key metrics of competition (e.g., the average sale-to-list ratio) or changes in new listing activity with recent months rather than the previous year. Controlling for seasonality and calendar effects also allows us to better compare sales activity to the previous year. For example, home sales may vary by as much as 10% simply due to one month having a different number of weekdays (minus holidays) than that same month the year before. We currently do not seasonally adjust data at the neighborhood, zip code, or city levels due to smaller levels of activity, which result in small sample sizes for a given month.


