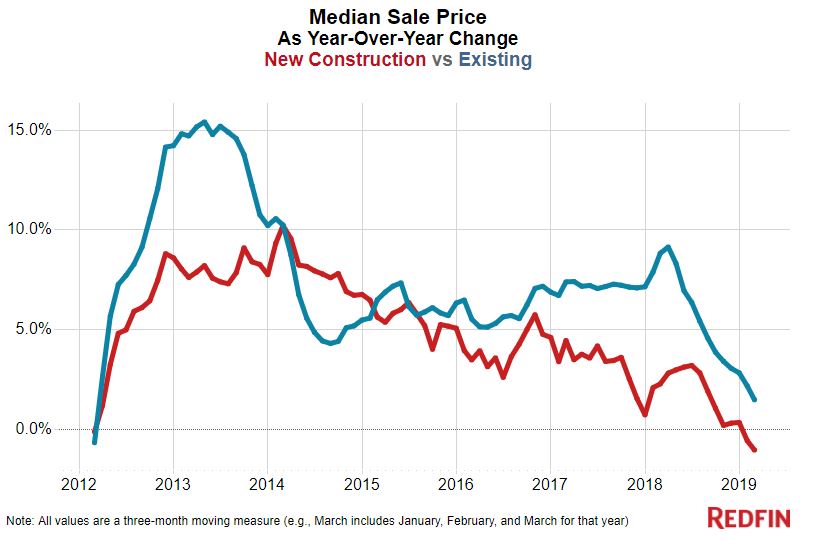
The slight drop in new-home prices is due in part to a trend toward smaller lot sizes, smaller newly built homes and a move away from high-end finishes, all of which allow builders to offer homes for lower prices.
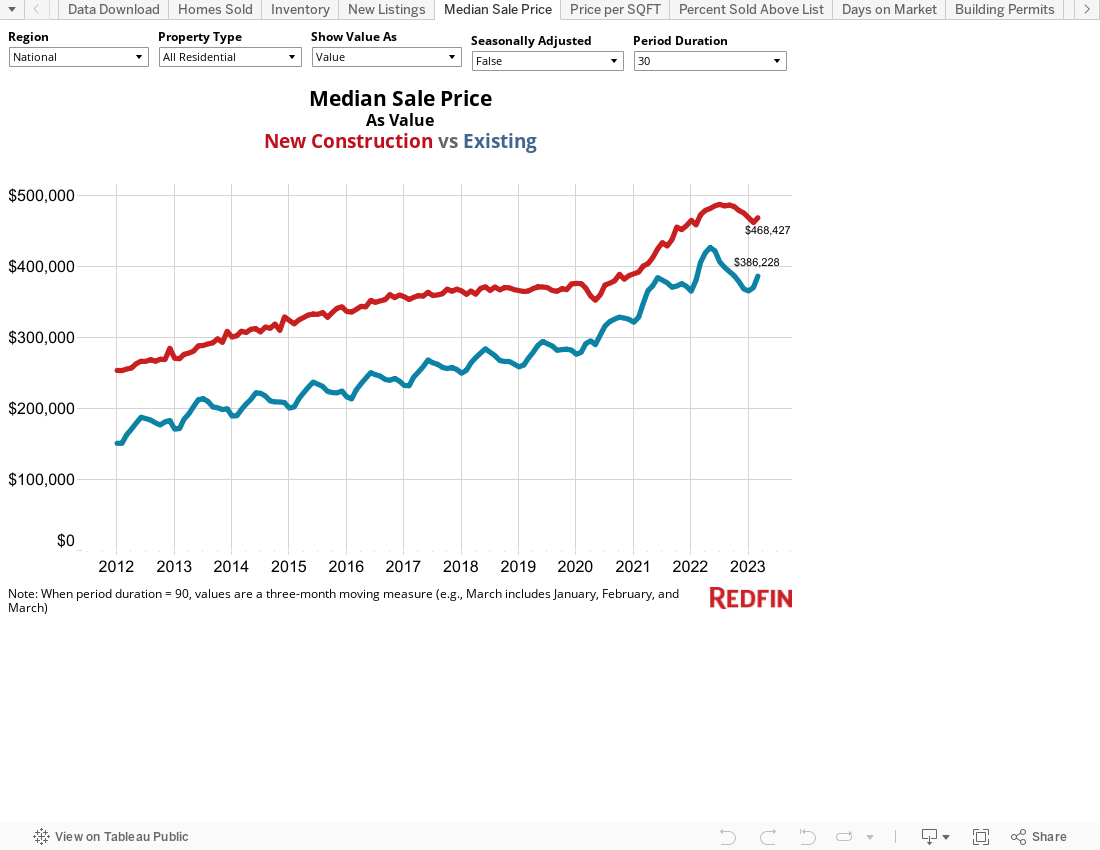
Sale prices for newly built homes fell 1 percent year over year to a median of $363,900 in the first quarter, the first such drop in seven years. Meanwhile, the median sale price for existing homes continued to grow, but at its slowest pace in seven years, up just 1.5 percent to $282,900 in the first quarter.
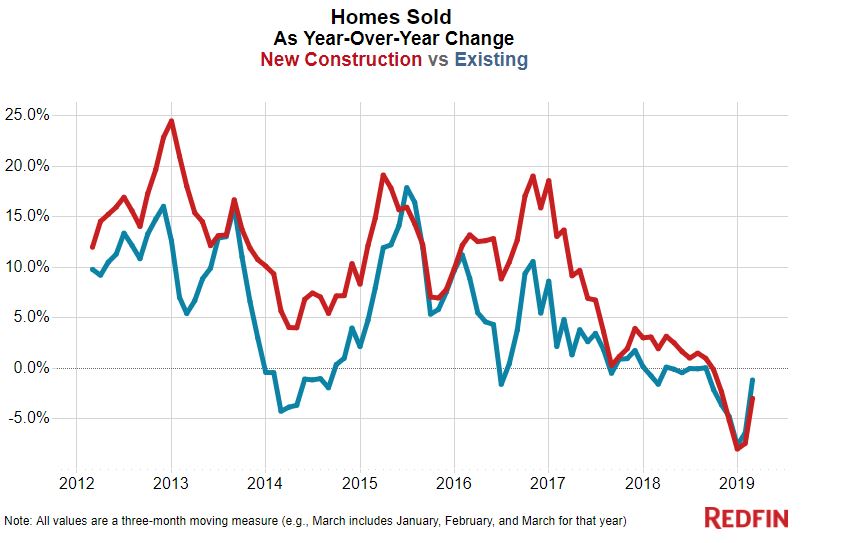
Sales of new homes were down 3.1 percent year over year in the first quarter, the third consecutive quarter of declines. Existing home sales, which were down 1.2 percent, have followed a similar trend of annual declines—which are now shrinking—since the second half of 2018.
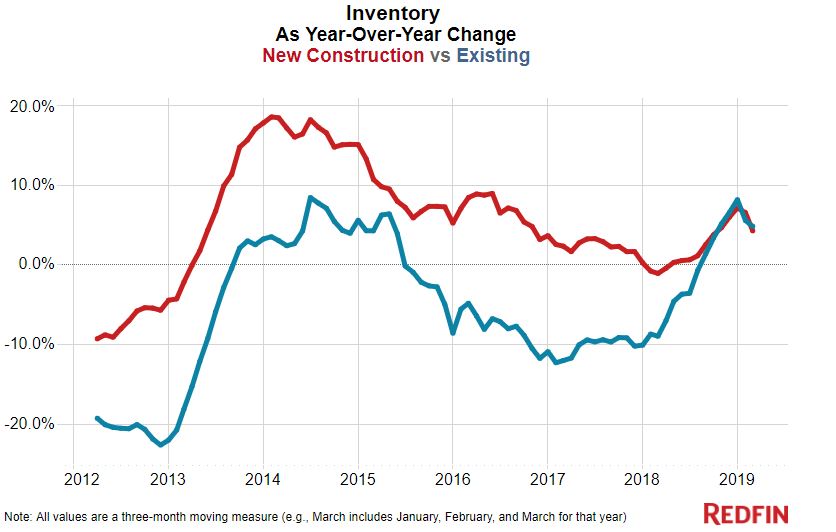
While prices and sales were down, supply of new homes was up 4.2 percent in the first quarter, the fourth consecutive period of increases.
For existing homes, supply was up 4.8 percent. Inventory growth rates for new and existing homes have been trending toward convergence since the middle of 2018.
The small decline in new-home sale prices and sales and the rise in supply were expected. We first reported that demand for new homes was cooling in the second half of 2018 as builders started dropping prices and offering incentives to agents and buyers showing interest in new construction, such as free design upgrades.
Connie Durnal, a Redfin agent in Dallas, said builders are now using other methods to lower prices for new homes in her area, such as smaller lot sizes and including fewer upgrades in spec homes (those that are built without a buyer lined up). Lowering prices is part of an effort to sell some of the new-home inventory that’s been piling up in Dallas (supply of new homes in the Dallas metro was up 14.7% in the first quarter).
“The market for new homes is shifting. Builders are readjusting their pricing to be more competitive, both in low-end and high-end homes. Some of my clients have been able to buy new homes at prices we never could have negotiated a year ago,” Durnal said. “One reason builders are able to offer homes for lower prices is because in some cases, they’re building on smaller lots farther away from the city center, like in the northern suburbs. They’re also reducing monetary incentives such as design center credits and built-in blinds in favor of offering the home for sale at a lower price. That way, builders end up netting the same amount of money on a sale but homebuyers may feel that they’re getting a better price.”
“Builders are also reducing list prices by cutting down on upgrades inside new homes. They’re using smaller baseboards for the floor trim and fewer built-in recessed lights, for example, and fireplaces are often no longer standard features,” Durnal continued. “I recently helped a buyer close on a new home that had several features that weren’t ideal—vinyl flooring, no gutters and no sprinkler system—but it kept the price point low and she was able to afford the home. Those are all items that can be added later.”
Although the median sale price for new homes dropped on a national level during the first quarter, it didn’t drop in every metro area. Below is a look at the metro areas driving the declines, followed by the metros with the biggest increases in new home prices. The nationwide price change is calculated using a weighted average of each metro area Redfin tracks, with home sales as the weight. To be included in these tables, there must have been at least 50 new homes sold during the first quarter.
| Metros with the biggest sale-price declines for new homes in the first quarter of 2019 | |||
| Metro area | Year-over-year decrease in sale price for new homes | Median sale price for new homes | Number of new homes sold |
| Chicago, IL | -16.4% | $445,000 | 403 |
| Los Angeles, CA | -14.2% | $1,698,800 | 293 |
| Bridgeport, CT | -14% | $952,500 | 55 |
| West Palm Beach, FL | -13.3% | $533,108 | 114 |
| Birmingham, AL | -9.9% | $236,605 | 357 |
| Miami, FL | -8.7% | $376,000 | 105 |
| Tampa, FL | -8.7% | $274,490 | 1,647 |
| Fort Lauderdale, FL | -7.1% | $675,000 | 79 |
| Denver, CO | -6.8% | $498,000 | 915 |
| Newark, NJ | -6.7% | $750,000 | 54 |
| Metros with the biggest sale-price increases for new homes in the first quarter of 2019 | |||
| Metro area | Year-over-year increase in sale price for new homes | Median sale price for new homes | Number of new homes sold |
| San Jose, CA | 50.8% | $2,374,500 | 64 |
| Oakland, CA | 39.5% | $1,129,250 | 91 |
| Fresno, CA | 13.3% | $317,145 | 98 |
| Milwaukee, WI | 12.3% | $429,900 | 82 |
| Grand Rapids, MI | 12% | $319,950 | 184 |
| Louisville, KY | 11.7% | $310,500 | 207 |
| Baton Rouge, LA | 11.5% | $265,146 | 312 |
| Atlanta, GA | 11% | $299,900 | 2,991 |
| Stockton, CA | 10.6% | $495,000 | 89 |
| Detroit, MI | 9.7% | $339,023 | 111 |
National new construction trends in the first quarter:
- For new homes, the median price per square foot was $172, up 1 percent from the year before. The median price per square foot for existing homes was identical at $172, up 1.4 percent year over year. (Price per square foot doesn’t necessarily provide a direct comparison for new and existing homes, as new homes are often located in less expensive neighborhoods away from city centers.)
- New listings for new homes were down 2.8 percent in the first quarter, the first year-over-year decline in at least seven years. New listings for existing homes were down 0.6 percent.
- For all types of residential construction, building permits were down 5.4 percent year over year. For single-family homes, permits were down 7.6 percent, the first year-over-year decline since the second quarter of 2014.
- Building permits per 10,000 people fell 8 percent annually, the first drop since the last quarter of 2016.
- The typical new home was on the market 112 days before going under contract, up just one day from 111 days the year before. Existing homes were on the market for 52 days, two more days than a year ago.
Metro-level highlights for new construction in the first quarter:
- In Raleigh, NC, 31.6 percent of all homes sold were new construction, the highest portion of all the metros Redfin tracks. That’s followed by El Paso, TX (30.1%) and Austin (28.4%).
- In Buffalo, NY, just 0.9 percent of all homes sold were new construction, the lowest share of any metro. Next comes Newark, NJ (1%) and Fort Lauderdale, FL (2%).
- In the majority of markets, the rate of building permits dropped. San Diego, which saw a 59.7 percent year-over-year decline, fell the most, followed by Salt Lake City (-43%) and St. Louis (-42%).
- Allentown, PA experienced the biggest annual increase in building permits (106.3%), followed by Milwaukee (95.7%) and Camden, NJ (89.9%).
- Miami experienced a 43.6 percent year-over-year increase in price per square foot for new homes, more than any other metro in the U.S. It’s followed by Dayton, OH (43%) and San Jose (36.9%).
- On the other end of the spectrum is Pittsburgh, the metro with the biggest drop in price per square foot for new homes (-19.5%). Next comes Chicago (-14.6%) and Fort Lauderdale (-13%).
- San Jose saw the biggest year-over-year rise in supply of new homes, with a 177% increase. It’s followed by Seattle (97.1%) and McAllen, TX (68.9%).
- Albuquerque, NM experienced the biggest annual decline in supply, with a 29.8% dip. Next comes El Paso (-26%) and Hartford, CT (-21.4%).
See below for a downloadable set of monthly data on new construction prices, sales, inventory and other new residential market statistics. The dataset goes back to 2012.