
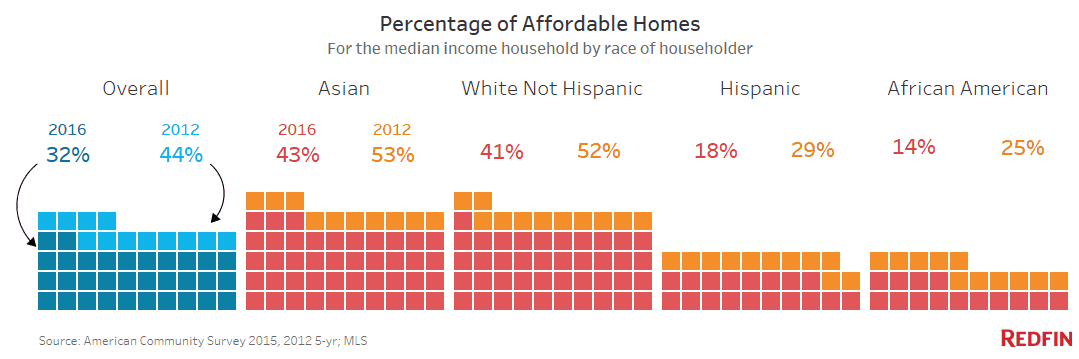
Housing affordability is a growing problem for the middle class. As home prices across the nation’s 30 largest metro areas have increased by 26 percent since the market bottomed in 2012 and the median household income edged up just 1.6 percent nationally, housing affordability for the middle class has dwindled. In 2012, a family earning the area median income could afford 44 percent of the homes for sale. By 2016, the share of affordable listings declined 12 percentage points to just 32 percent.
Add to the equation that the number of homes for sale has declined by 6 percent. New construction, particularly for affordable starter homes, has failed to keep up with buyer demand. Meanwhile, rents have risen 18 percent in the past five years, making it hard for families to save for a down payment.
Taken together, all of these factors leave us with a growing homeownership divide. With the availability of affordable homes dwindling, the middle class is increasingly finding itself on the have-not side of the line, with an even greater divide growing among middle-class African-American and Hispanic families.
From 2012 to 2016, the percentage of affordable homes across the 30 metros decreased by about the same amount for white families as it did for Hispanic and African-American families. However, given the already lower rate of homeownership among minority families, the decrease has left those groups with so few affordable homes for sale that they’re essentially priced out of the market in several major cities.
- In 2016, just 18 percent of homes in the 30 largest metros were affordable for those earning the median income for Hispanic households, and 14 percent were affordable for families earning the median income for African-American households. Both rates were down 11 percentage points from 2012. This is compared to 30 percent affordable for those earning the median income for white households, down 12 percentage points since 2012.
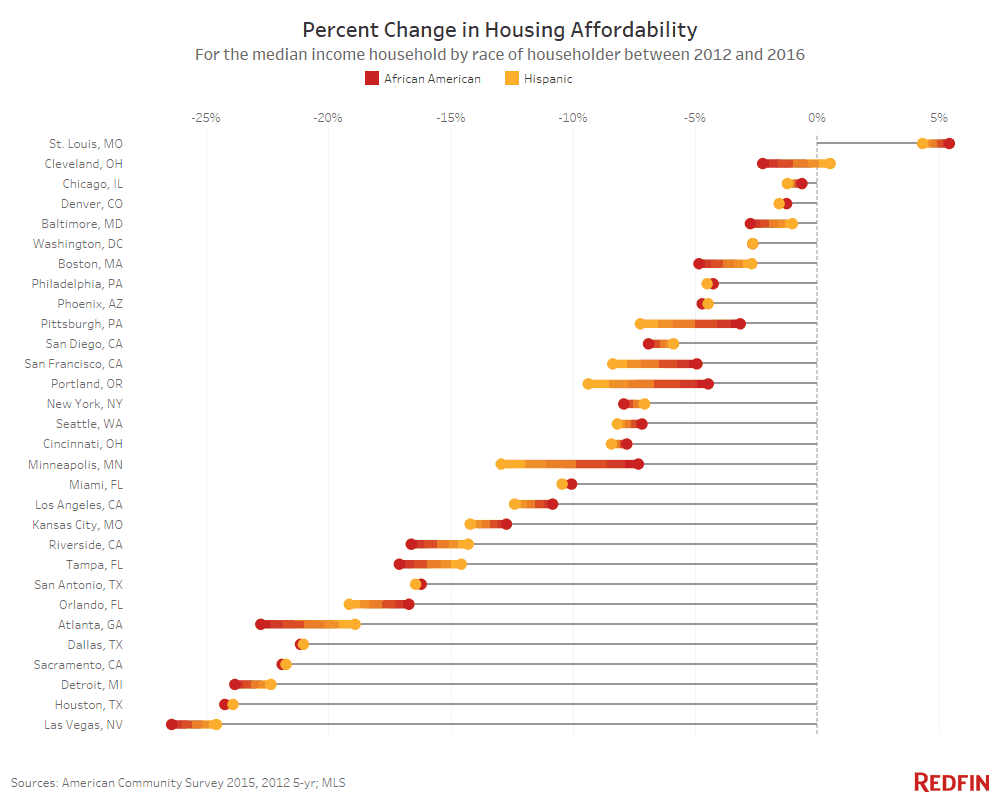
- St. Louis was the only market out of the 30 in this study that became more affordable for both median-income Hispanic and African-American households.
- The racial gap in affordability was largest in Minneapolis, where the typical white family could afford 66 percent of the homes for sale, compared to 5.2 percent and 24.8 percent for families earning the median income for African-American and Hispanic households, respectively. The smallest racial gap was in Denver, where less than 2 percent of homes for sale were affordable to families earning the median income for African-American and Hispanic households compared to just 8.3 percent for families earning the median income for white households.
- Lack of affordability in Denver, Los Angeles, Portland, San Francisco, San Diego and Phoenix is especially severe. Each of these markets has fewer than 5 percent of homes for sale affordable for those at the median income level for African-American and Hispanic families.
Metros where Middle-Class Affordability Decreased the Most
In almost every major metro area home prices are surging rapidly ahead of income growth. The cause has both national and local roots. At the national level, mortgage rules put in place after the housing bust restrict access to mortgage credit, thereby cutting off a key pathway to affluence for the middle class. Zoning restriction are another culprit. Last year the Obama Administration linked zoning and land use restrictions to the lack of affordable housing. The Administration also warned that zoning laws in major cities exacerbate income inequality and reduce economic growth.
The chart below ranks metros from least affordable (San Diego, where just 5.6 percent of listings are affordable) to most affordable (Minneapolis, where 61.3 percent are affordable) for median-income households.
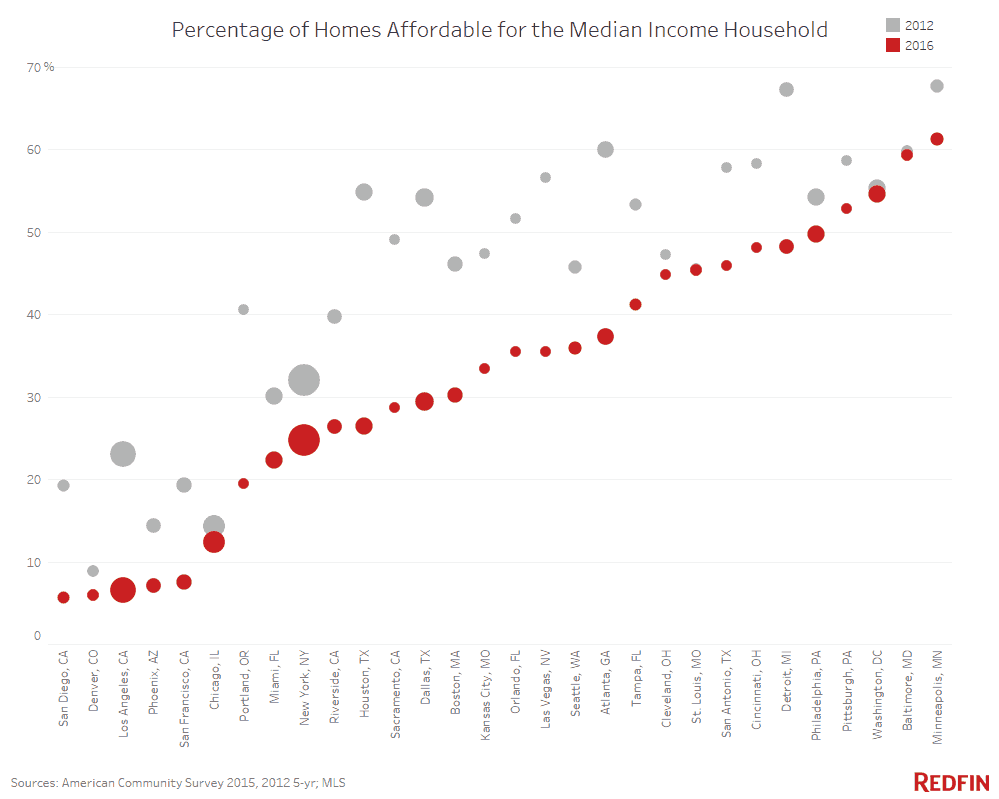
The double whammy of rapid price increases and sluggish income growth has driven affordability down in every large metro. Houston experienced the largest decline in the number of listings affordable to middle class families. The median list price in Houston rose 55.8 percent to $295,880 in 2016 from $189,900 in 2012. This price increase is 14 times the rate of income growth, which only increased 3.9 percent over this time period. In 2016, only 26.4 percent of Houston’s listings were affordable to the middle class, less than half of the 54.8 percent that were affordable there in 2012.
Houston’s story is not unique. Nineteen of the 30 metros we studied saw the number of affordable listings decline by 20 percent or more.
St. Louis was the only metro where overall affordability did not change significantly. The share of affordable listings was mostly flat over the past four years, down just 0.1 percent overall. Baltimore (down 0.6 percent) and Washington, D.C. (down 0.8 percent) had the second and third smallest declines in affordability, respectively.
Affordability and Race
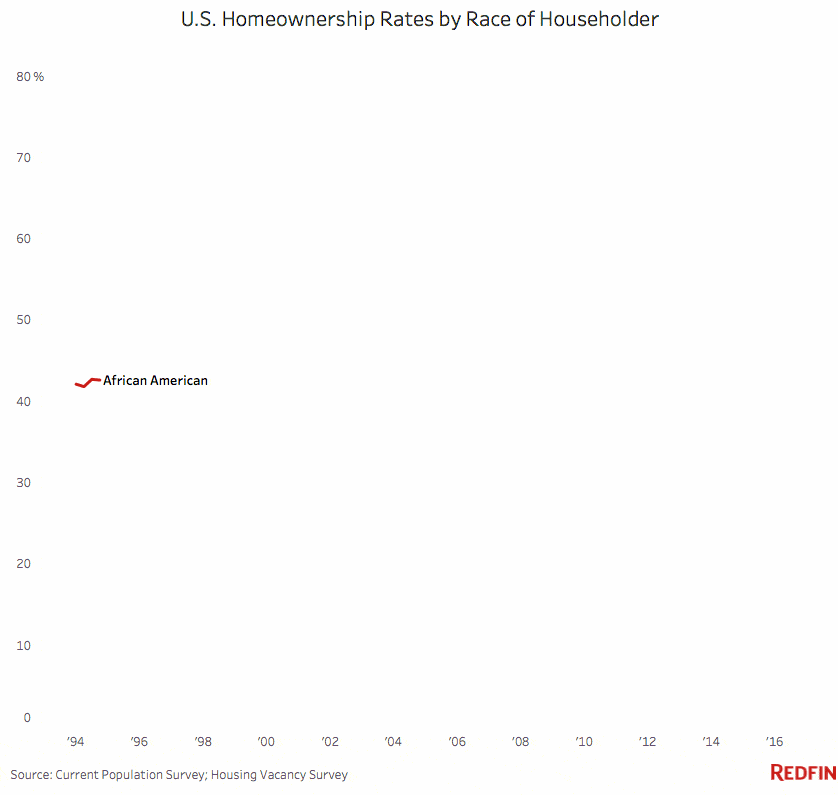
For African-American and Hispanic families, declining affordability has been especially dire because of historically lower levels of homeownership for these two groups. Homeownership among African Americans and Hispanics has not gained any ground since its peak just prior to the housing bust in 2004. Wide disparities in homeownership rates continue to persist nine years after the housing crisis. In the first quarter of 2017, 72 percent of white households were homeowners, compared to 43 percent of African Americans,and 47 percent of Hispanic families.
The portions of listings affordable for both Black and Hispanic families earning the median income for their racial groups have fallen to below 20 percent of the homes for sale in the last four years.
The least affordable metros for minorities are on the West Coast as shown in the chart below. In these fast-growing metros, African American and Hispanic middle-class families are essentially priced out of homeownership. In Denver, Los Angeles, Portland, San Francisco, San Diego and Phoenix, fewer than 5 percent of listings last year were affordable to Black and Hispanic families earning the median income for their group in these metros.
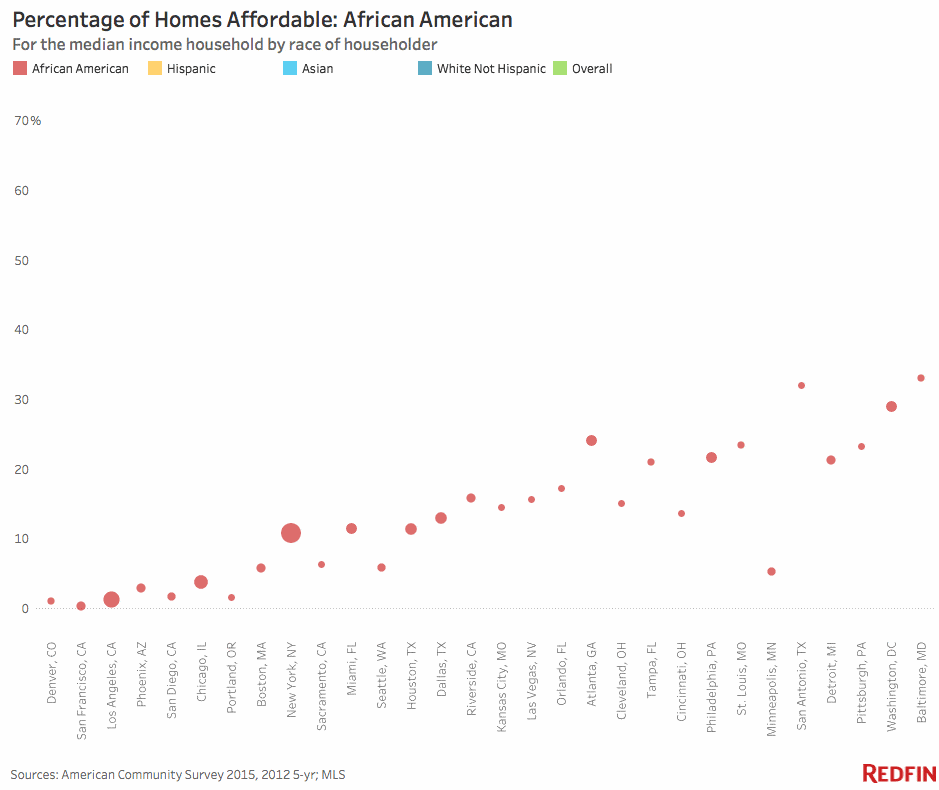
Across the 30 largest metros, Las Vegas had the largest declines in affordability for families making the median African American or Hispanic household incomes. The share of listings affordable to a typical African American household went from 42.1 percent in 2012 to 15.6 percent in 2016, a 26.5 percentage-point drop. Incomes for this group declined 8.2 percent and median list prices rose 38.3 percent.
The typical Hispanic family could afford 47.1 percent of the listings on the Las Vegas market in 2012, compared to 22.5 percent in 2016, a 24.6-point drop. The median income for Hispanic families declined by 3.3 percent during the same time period.
The typical white family in Las Vegas could afford 62.3 percent of homes for sale in 2012 compared to 44.7 percent in 2016, a 17.6-point drop. Incomes for this group declined 5.4 percent.
In Detroit, a small 1.3 percent increase in median incomes overall was no match for the dramatic growth in prices over the past four years. Detroit’s 61.9-percent increase in median list prices cratered the share of homes affordable to typical Black and Hispanic families by more than 20 percentage points and by 16.4 percentage points for white families, for whom 56 percent of homes were still affordable in 2016.
Metros known for their relative affordability, like Atlanta, Tampa and Kansas City, have seen double-digit declines in the share of listings that were affordable on African American and Hispanic median incomes.
St. Louis is the only metro that saw increases in affordability for Hispanic and African-American families, though the percentage affordable remained unchanged for white families over this time period. The share of affordable listings grew 5.4 percentage points to 23.4 percent for African Americans, and 4.3 percentage points to 35.3 percent for Hispanics from 2012 to 2016.
The Upshot
American cities are at risk of losing both the economic and racial diversity that has been their hallmark. Middle-class homebuyers are being priced out of America’s largest cities at an alarming rate as the home affordability gap gets wider. In the 30 largest U.S. metros, incomes are much lower for typical African-American and Hispanic families than for their white and Asian counterparts. Between 2012 and 2016, the percentage of affordable listings dropped considerably for each race, but given the significantly lower rates of homeownership among African-American and Hispanic families, the reduction in affordable listings has even more dire consequences for income inequality when broken out by race.
The U.S. is also at risk of becoming a renter nation in our largest and wealthiest metros, where middle-class and working-class families are increasingly unable to achieve the American dream of homeownership. Without policy change, fast-growing U.S. cities will continue to cement a slow-growth economy where people decline to move to where the good jobs are because it’s too expensive to live there.
Looking to Solutions
But there are solutions. For one, federal and state governments can do much more to be influential in local housing policy. That’s where the crisis starts–at the neighborhood level–when people vote against inclusionary zoning policies, making it difficult or impossible to build higher-density, affordable housing in a community. Federal and states governments can reward communities that change to inclusionary zoning practices by offering them infrastructure investments to improve the neighborhoods. That way, inclusionary zoning is more appealing to longtime residents.
Additionally, current tax policies, like the Mortgage Interest Deduction (MID), help those who need it the least, high-income homeowners who itemize their tax returns. Homeowners received an estimated $77 billion from the MID in 2016. Converting the MID into a 15 percent tax credit would reduce cost of this subsidy and free up federal funds for downpayment and mortgage assistance to qualified families. The government could also limit the number of mortgages for which a household could deduct interest to just their primary residence, preventing vacation homes from offering a tax benefit. It could also reduce the amount of eligible mortgage to $500,000 instead of the current 1 million, limiting the amount of interest that the very wealthiest Americans can deduct. This approach preserves the good part of the MID in supporting middle-class homeowners who might be struggling with affording their homes.
With policy changes like these, the U.S. can turn the tides on housing affordability for everyone while keeping our cities both economically and racially diverse.
Methodology
We gathered median household incomes by race and ethnicity for each metropolitan statistical area (MSA) from the American Community Survey (5-year) for 2015 and 2012. Hispanic in the report represents the ethnicity Hispanic or Latino—as reported by the census. Race throughout the report, therefore, represents both race and/or ethnicity. Based on these household incomes, we calculated the maximum monthly mortgage payment, at a 3.4 percent interest rate, using a 30 percent of gross income threshold.
Next, we gathered all multiple listing service (MLS) listings active on the market in the 30 largest metros for which data was available as of Oct. 1, 2016. Using the list price, current homeowners association (HOA) dues, and the property tax rate for each listing, we calculated the estimated monthly mortgage cost with a 3.4 percent interest rate and 20 percent down payment of the current list price and determined the percentage of homes where the monthly mortgage payment was equal to or less than the max monthly mortgage payment possible for the household income in each metro.
We then performed the same analysis for the same date in 2012 to make a four-year comparison in incomes and affordable listings by area. You can download the complete spreadsheet with the results of our analysis here.


