
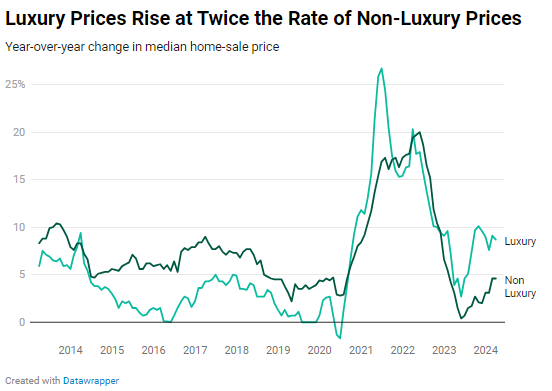
- Luxury home prices in the first quarter rose 9% year over year, twice as fast as non-luxury prices.
- Sales of luxury homes rose 2%, compared to a 4% decline in sales for non-luxury homes. Luxury sales are outperforming partly because elevated mortgage rates aren’t a deterrent for many luxury buyers, as a record 47% of luxury homes were bought in cash at the start of 2024.
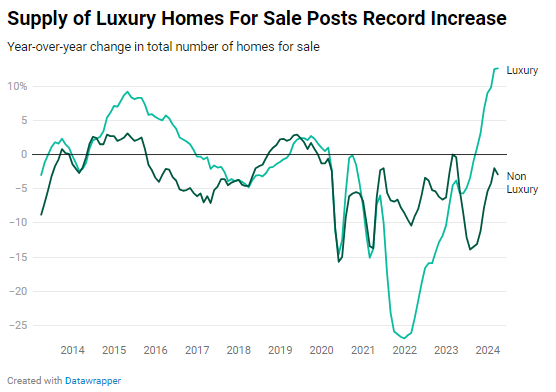
- Total supply of luxury homes rose 13% year over year, the biggest increase on record, and new listings soared nearly 20%. Still, supply remains below pre-pandemic levels, which is part of the reason prices remain elevated.
The median-priced U.S. luxury home sold for a record $1,225,000 in the first quarter, up 8.7% from a year earlier. Prices of non-luxury homes rose at roughly half the pace; they were up 4.6% to a median of $345,000, also a record high.
This is according to an analysis that divided all U.S. residential properties into tiers based on Redfin Estimates of the homes’ market values as of March 2024. Redfin’s price-tier data is calculated in rolling 3-month periods; the 3-month period in this report (January-March) coincides with the first quarter. This report defines luxury homes as those estimated to be in the top 5% of their respective metro area based on market value, and non-luxury homes as those estimated to be in the 35th-65th percentile based on market value.
Luxury prices are rising largely because demand for high-end homes has held up better than demand for middle-of-the-road homes. Sales of luxury homes are on the upswing, partly because many high-end buyers are undeterred by high mortgage rates, with the share of luxury homes bought in cash sitting at record highs. New listings of luxury homes are soaring–but not enough to curb the price growth that comes with rising demand; the total supply of luxury homes is still far below pre-pandemic levels.
“People with the means to buy high-end homes are jumping in now because they feel confident prices will continue to rise,” said David Palmer, a Redfin Premier agent in the Seattle metro, where the median-priced luxury home sells for $2.7 million. “They’re ready to buy with more optimism and less apprehension. It’s a similar sentiment on the selling side: Prices continue to increase for high-end homes, so homeowners feel it’s a good time to cash in on their equity. Even though mortgage rates remain elevated and demand isn’t as high as it was during the pandemic, many homebuyers and sellers feel the worst of the housing downturn is behind us.”
Luxury home sales rise for first time since 2021 as record share of affluent buyers pay cash
Sales of luxury homes rose 2.1% year over year in the first quarter. Luxury sales started posting year-over-year increases in January for the first time since August 2021.
Sales of non-luxury homes decreased 4.2% year over year. Non-luxury sales haven’t posted an increase since the end of 2021.
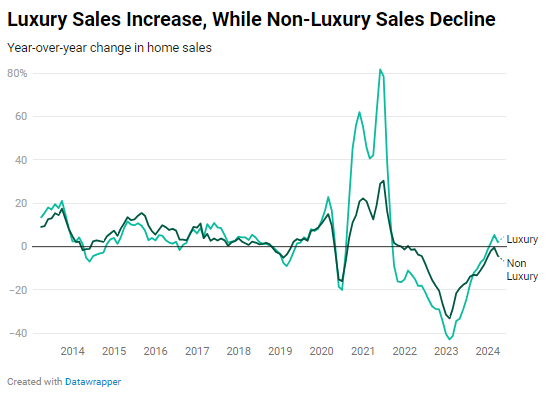
Sales are growing for luxury homes and declining for non-luxury homes largely because so many affluent buyers are able to pay in cash, meaning today’s elevated mortgage rates don’t deter them from purchasing homes. Nearly half (46.8%) of luxury homes bought during the three months ending February 29 were purchased in cash. That’s the highest share in at least a decade and up from 44.1% a year earlier. (Note that the all-cash data covers a slightly different time period than the rest of the data in this report; February is the most recent month for which all-cash data is available).
The weekly average 30-year fixed mortgage rate has hovered between 6.6% and 7% since the beginning of 2024, more than double pandemic-era record lows. Elevated mortgage rates have driven down demand for the average American homebuyer, but rates are irrelevant to cash buyers.
Another reason for the uptick in luxury sales is the surge in luxury listings; the more homes on the market, the more can sell.
Supply of luxury homes for sale posts biggest year-over-year increase on record
The total number of luxury homes for sale rose 12.6% from a year earlier in the first quarter, the biggest increase on record. That’s compared with a 2.9% decline in non-luxury inventory.
New listings of luxury homes soared 18.5% from a year earlier in the first quarter, the second consecutive quarter of double-digit increases. That’s roughly seven times bigger than the 2.7% increase for non-luxury homes.
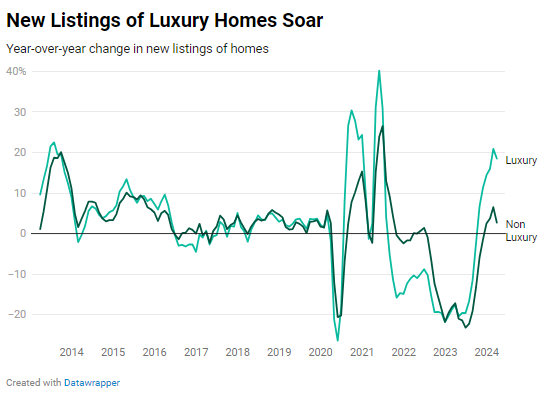
Supply of luxury homes is shooting up for several reasons. One, the mortgage-rate lock-in effect has a lesser impact on luxury homeowners because they’re more apt to buy their next home in cash or be in a financial position to take on a higher rate. Two, owners of luxury homes, many of whom have a lot of equity, are putting their houses on the market to cash in while prices are at record highs. Three, luxury supply had a lot of room to grow, as it was sitting at low levels during the first quarter of 2023.
It’s worth noting that while luxury inventory is on the rise, total supply and new listings are below typical pre-pandemic first-quarter levels. Relatively low inventory is one reason luxury prices are increasing.
Metro-Level Luxury Highlights: Q1 2024
Redfin’s metro-level luxury data includes the 50 most populous U.S. metros. Some metros are removed from time to time, to ensure data accuracy. All changes noted below are year-over-year changes.
- Prices: The median sale price of luxury homes rose most in Providence, RI (16.2% increase to $1,400,000) New Brunswick, NJ (15% increase to $1,900,000) and Virginia Beach, VA (12.8% increase to $1,100,000). It fell in just eight metros, with the biggest declines in New York (-9.9% to $3,250,000), Austin, TX (-6.9% to $1,629,300) and Minneapolis (-2% to $975,000).
- Sales: Luxury home sales rose in just over half the metros. They increased most in Seattle (36.9%), Austin, TX (25.5%) and San Francisco (23.9%). They decreased most in Newark, NJ (-23.6%), Philadelphia (-23%) and Detroit (-19.4%).
- Active listings: The total number of luxury homes for sale increased most in Austin, TX (40.5%), Jacksonville, FL (35.9%) and Fort Worth, TX (32%). Total inventory fell in 15 metros, with the biggest declines in Detroit (-16.8%), Atlanta (-14.1%) and Chicago (-13%).
- New listings: New listings of luxury homes increased most in Jacksonville, FL (63.6%), Fort Worth, TX (41.7%) and Nassau County, NY (40.5%). New listings fell in eight metros, with the biggest declines in Detroit (-17%), Atlanta (-8.2%) and Chicago (-7.7%).
- Speed of sales: Luxury homes sold fastest in Seattle, Oakland, CA and San Jose, CA with median days on market of 9, 12 and 12, respectively. They sold slowest in Miami (118 days), Austin, TX (106) and Nashville, TN (104).
10 Most Expensive U.S. Home Sales: Q1 2024
- Miami, FL (Surfside): $48M
- Seattle, WA (Medina): $38.9M
- Los Angeles, CA (Malibu): $38.5M
- Glenwood Springs, CO (Aspen): $37M
- Santa Maria, CA (Santa Barbara): $36.8M
- Hilton Head Island, SC (Yemassee): $35M
- Glenwood Springs, CO (Aspen): $33.5M
- West Palm Beach, FL (Lantana): $32.5M
- Santa Maria, CA (Santa Barbara): $32M
- Nashville, TN (Nashville): $32M
| Luxury Housing-Market Summary by Metro Area: Q1 2024
50 most populous U.S. metros |
||||||
| Region Name | Median sale price | Median sale price, YoY | Homes sold, YoY | Active listings, YoY | New listings, YoY | Median days on market |
| Anaheim, CA | $4,200.0K | 12.4% | 13.9% | 13.0% | 19.9% | 52 |
| Atlanta, GA | $1,278.8K | 6.6% | 7.7% | -14.1% | -8.2% | 52 |
| Austin, TX | $1,629.3K | -6.9% | 25.5% | 40.5% | 37.7% | 106 |
| Baltimore, MD | $1,175.0K | 11.6% | -11.9% | -7.0% | -4.3% | 34 |
| Boston, MA | $2,400.0K | 8.1% | 7.8% | 7.3% | 8.1% | 44 |
| Charlotte, NC | $1,320.0K | 4.4% | 20.7% | 15.5% | 22.3% | 46 |
| Chicago, IL | $1,196.0K | 8.7% | -7.4% | -13.0% | -7.7% | 80 |
| Cincinnati, OH | $799.0K | 3.1% | -14.2% | -9.3% | 3.0% | 39 |
| Cleveland, OH | $700.0K | 2.9% | -5.0% | -2.9% | -3.1% | 40 |
| Columbus, OH | $854.5K | 2.9% | -0.7% | 9.0% | 0.7% | 52 |
| Dallas, TX | $1,374.8K | 6.1% | 15.3% | 26.5% | 35.1% | 47 |
| Denver, CO | $1,724.1K | 0.5% | 6.7% | 18.6% | 16.1% | 31 |
| Detroit, MI | $615.0K | -0.8% | -19.4% | -16.8% | -17.0% | 19 |
| Fort Lauderdale, FL | $1,717.5K | 9.1% | -0.2% | 18.0% | 31.0% | 97 |
| Fort Worth, TX | $1,050.0K | -1.4% | 17.9% | 32.0% | 41.7% | 56 |
| Houston, TX | $1,150.0K | 5.6% | 0.2% | 13.0% | 19.9% | 46 |
| Indianapolis, IN | $842.9K | 2.9% | -8.8% | 7.6% | 5.1% | 48 |
| Jacksonville, FL | $1,399.0K | 11.9% | 2.2% | 35.9% | 63.6% | 52 |
| Kansas City, MO | $900.0K | 5.9% | -10.6% | 10.7% | 13.4% | 61 |
| Las Vegas, NV | $1,209.5K | 10.0% | 19.8% | 1.1% | 28.3% | 81 |
| Los Angeles, CA | $3,497.5K | -0.4% | -8.8% | 2.8% | -0.7% | 76 |
| Miami, FL | $3,100.0K | 11.3% | -2.8% | 13.6% | 22.6% | 118 |
| Milwaukee, WI | $880.0K | 5.2% | -4.6% | -5.0% | 0.4% | 66 |
| Minneapolis, MN | $975.0K | -2.0% | -1.3% | 11.2% | 16.9% | 59 |
| Montgomery County, PA | $1,343.0K | 7.4% | 0.5% | -1.5% | 13.0% | 46 |
| Nashville, TN | $1,685.0K | 0.4% | 8.2% | 23.1% | 20.2% | 104 |
| Nassau County, NY | $2,550.0K | 10.9% | 13.6% | 14.4% | 40.5% | 72 |
| New Brunswick, NJ | $1,900.0K | 15.0% | -7.9% | -4.2% | 25.5% | 49 |
| New York, NY | $3,250.0K | -9.9% | -12.9% | -2.1% | 35.5% | 90 |
| Newark, NJ | $1,658.0K | 7.5% | -23.6% | -12.2% | -7.1% | 21 |
| Oakland, CA | $2,900.0K | 7.4% | 18.4% | 6.2% | 16.7% | 12 |
| Orlando, FL | $1,218.7K | 10.8% | -1.3% | 23.0% | 28.5% | 44 |
| Philadelphia, PA | $1,061.6K | -1.3% | -23.0% | 7.6% | 4.4% | 59 |
| Phoenix, AZ | $1,650.0K | 8.2% | 10.1% | 20.5% | 25.0% | 57 |
| Pittsburgh, PA | $750.0K | 1.9% | 18.9% | 12.3% | 11.0% | 77 |
| Portland, OR | $1,280.0K | -1.5% | 3.2% | 14.7% | 13.6% | 62 |
| Providence, RI | $1,400.0K | 16.2% | 10.6% | 10.7% | 15.7% | 50 |
| Riverside, CA | $1,450.0K | 3.6% | 18.2% | 19.4% | 28.2% | 59 |
| Sacramento, CA | $1,450.0K | 2.5% | 13.0% | 13.6% | 21.5% | 67 |
| San Antonio, TX | $970.0K | 6.2% | -8.3% | 31.7% | 35.5% | 99 |
| San Diego, CA | $3,250.0K | 1.6% | 17.0% | 23.0% | 22.8% | 42 |
| San Francisco, CA | $4,800.0K | 0.0% | 23.9% | 12.3% | 16.6% | 27 |
| San Jose, CA | $4,700.0K | 6.5% | 8.0% | -1.2% | 0.5% | 12 |
| Seattle, WA | $2,700.0K | 4.9% | 36.9% | 8.7% | 19.9% | 9 |
| St. Louis, MO | $840.0K | 6.3% | -4.1% | -5.0% | 8.6% | 34 |
| Tampa, FL | $1,375.0K | 5.8% | 4.4% | 25.7% | 26.7% | 48 |
| The United States | $1,225.0K | 8.7% | 2.1% | 12.6% | 18.5% | 63 |
| Virginia Beach, VA | $1,100.0K | 12.8% | -18.3% | 0.9% | 1.8% | 48 |
| Warren, MI | $890.0K | 8.5% | -1.7% | -2.4% | 3.3% | 41 |
| Washington, DC | $1,747.5K | 4.5% | -0.9% | -2.0% | -2.9% | 41 |
| West Palm Beach, FL | $2,936.4K | 6.8% | 11.8% | 18.4% | 7.3% | 90 |


