A rise in new rentals hitting the market coincided with a slowdown in tenant demand, causing rent growth to cool for the 11th-straight month. The Sun Belt saw the biggest declines, allowing some renters to sign leases at more affordable rates than a year ago.
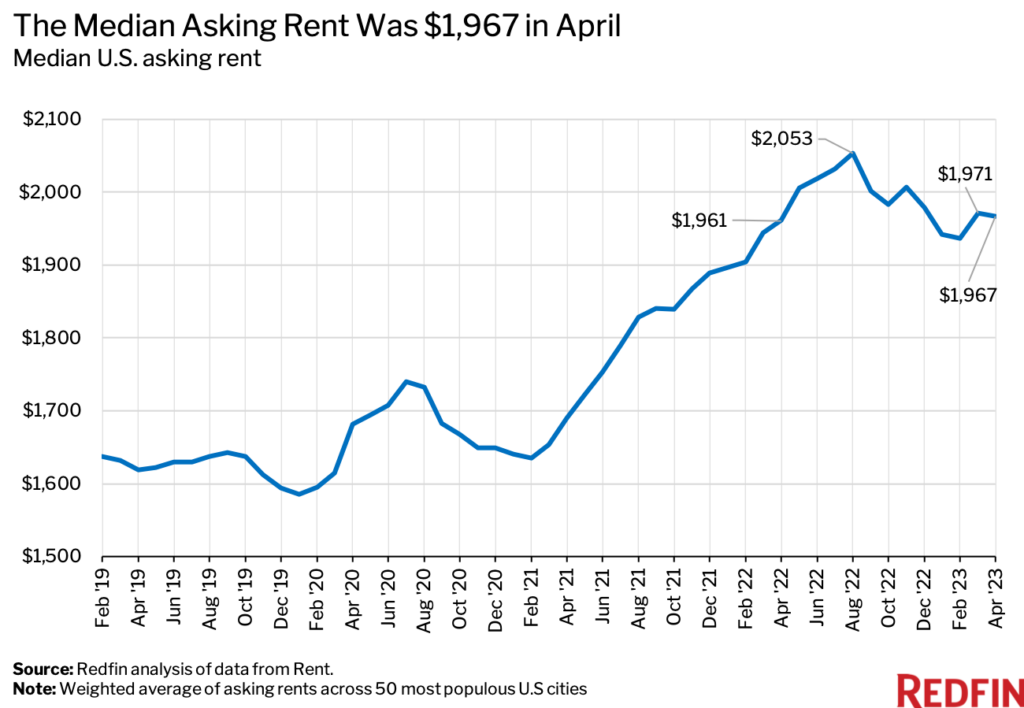
The median U.S. asking rent rose 0.3% year over year to $1,967 in April. That’s the 11th-consecutive month of slowing growth. It compares with a revised increase of 1.4% one month earlier and a 16% increase one year earlier.
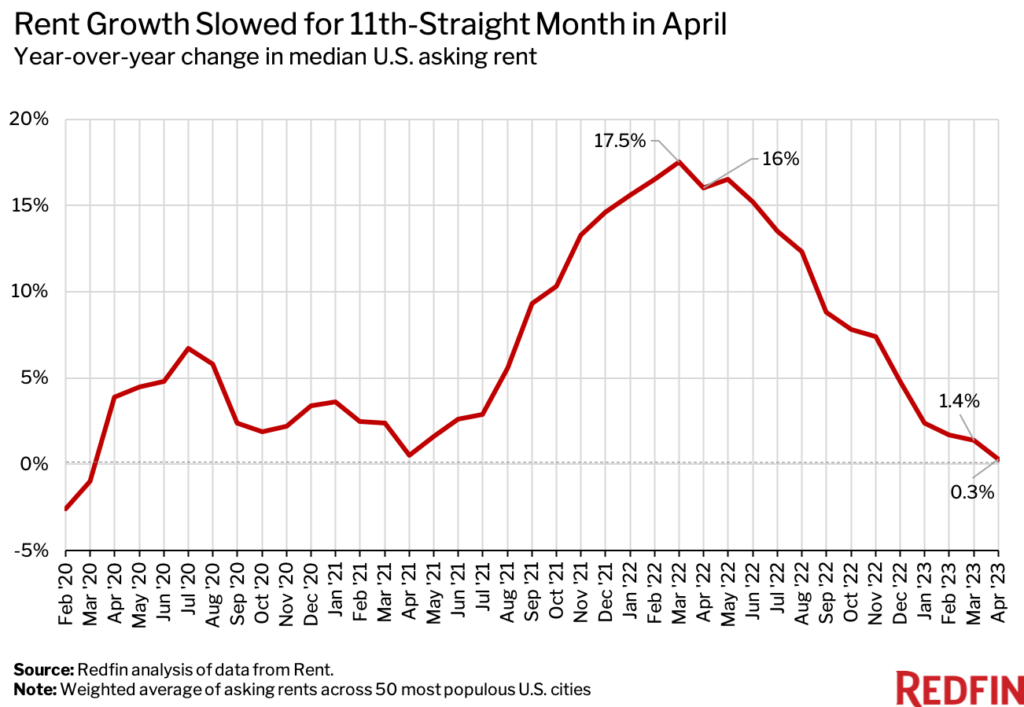
On a month-over-month basis, the median asking rent fell 0.2%, which is notable because rents typically rise at this time of year.
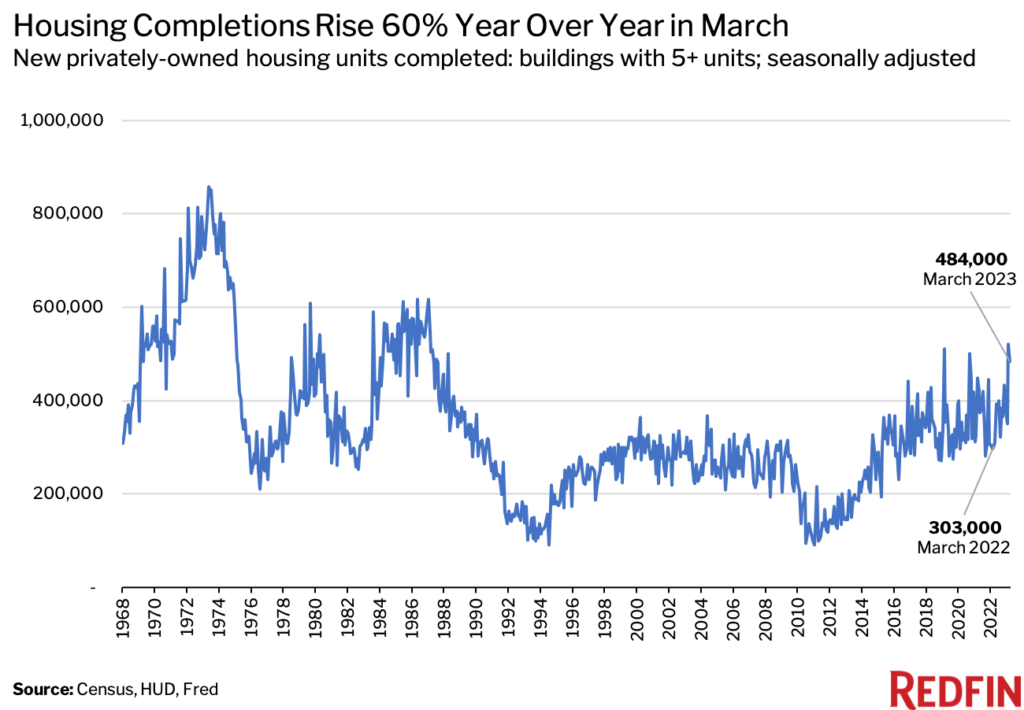
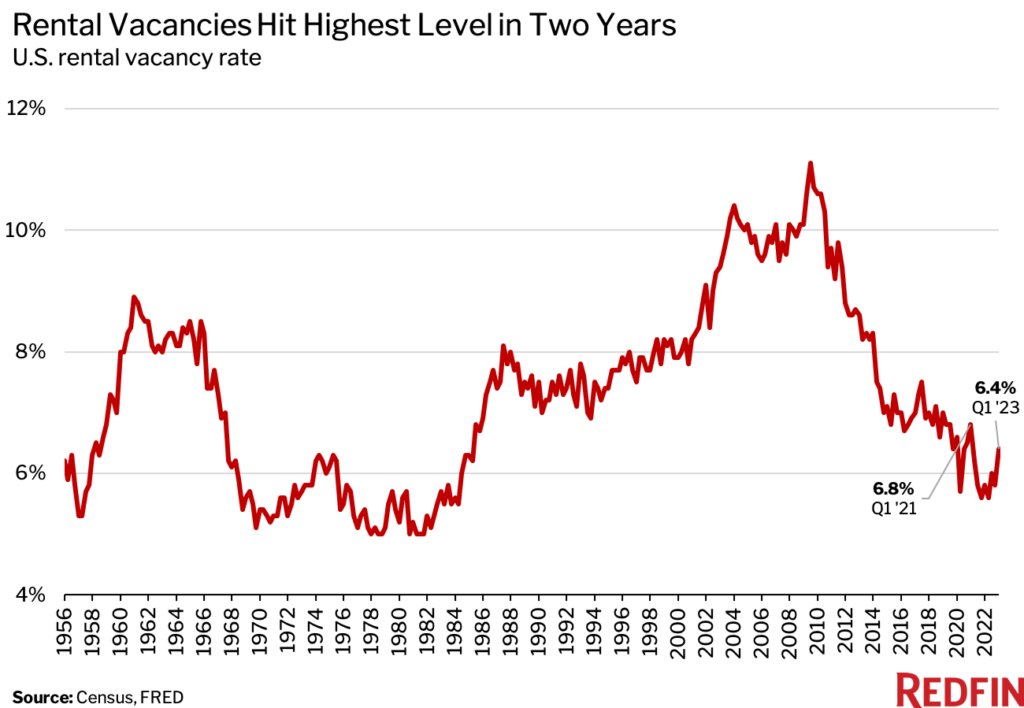
An expanding pool of rentals to choose from is a major contributor to the slowdown in rent growth. The homebuilding boom over the last decade-and-a-half has increased the number of new rentals on the market, and landlords are now grappling with rising vacancies. Completed residential projects in buildings with five or more units jumped 60% year over year on a seasonally-adjusted basis to 484,000 in March—the most recent month for which data is available. There are only three other instances since the 1980s when completions were higher. The rental vacancy rate ticked up to 6.4% in the first quarter—the highest level in two years.
“The balance of power in the rental market is tipping back in tenants’ favor as supply catches up with demand. That’s easing affordability challenges and giving renters a little wiggle room to negotiate in some areas,” said Redfin Deputy Chief Economist Taylor Marr. “The market has become more balanced, but the scales could tip back in favor of landlords if homebuilders pump the brakes on new construction in response to slowing rent growth.”
Rent growth is also decelerating because many people are opting to stay put. Fewer people are moving due to economic uncertainty, slowing household formation, still-high rental costs in many markets, and the rising cost of other goods and services due to inflation.
Rents Fell Across the Sun Belt in April
In Austin, TX, the median asking rent fell 14.3% year over year in April—the largest decrease among the major U.S. metropolitan areas Redfin analyzed. Next came Phoenix (-9.6%), Las Vegas (-7.1%), Oklahoma City, OK (-6.4%) and Chicago (-6%). All but two of the 10 metros with the largest declines are in Sun Belt states.
- Austin, TX (-14.3%)
- Phoenix, AZ (-9.6%)
- Las Vegas, NV (-7.1%)
- Oklahoma City, OK (-6.4%)
- Chicago, IL (-6%)
- Birmingham, AL (-4.5%)
- Sacramento, CA (-4%)
- Memphis, TN (-3.6%)
- Seattle, WA (-3.2%)
- Dallas, TX (-2.8%)
The Sun Belt exploded in popularity during the pandemic as scores of remote workers moved there in search of relatively affordable housing and warm weather. Rents surged and are now coming back down to earth as supply catches up to demand. Much of the nation’s homebuilding in recent years has taken place in the Sun Belt. Phoenix and Austin both ranked in the top five metros with the highest number of multifamily building permits in March.
“A lot of renters took on roommates or moved in with family when rents increased dramatically during the pandemic, which left more rentals and fewer renters needing places,” said Van Welborn, a Redfin Premier real estate agent in Phoenix. “Landlords who increased prices too quickly are now feeling the impact as the market calms and rents decrease to more reasonable levels.”
Welborn said the short-term rental market is also cooling due to an oversaturation of Airbnbs and new restrictions on hosts. The silver lining for landlords in Phoenix is that seasonal renters will still pay a premium in the winter, and the local job market is holding up—especially with a large new semiconductor plant moving in.
Rents Continued Climbing in the Midwest
In Providence, RI, the median asking rent rose 16% year over year in April—the biggest jump among the major metros Redfin analyzed. Next came Raleigh, NC (12.4%), Indianapolis (10.9%), Charlotte, NC (10.5%) and Cleveland, OH (9.7%). Five of the 10 metros that experienced the largest rent increases are in the Midwest.
Many midwestern housing markets have held up relatively well because they remain affordable compared to pandemic boomtowns like Austin and Phoenix. That’s in part because they haven’t seen large waves of people moving in and out, which is what drove the booms and busts in many southern and western markets, Marr said.
- Providence, RI (16%)
- Raleigh, NC (12.4%)
- Indianapolis, IN (10.9%)
- Charlotte, NC (10.5%)
- Cleveland, OH (9.7%)
- Columbus, OH (8.3%)
- Kansas City, MO (8%)
- Milwaukee, WI (8%)
- Pittsburgh, PA (7.9%)
- Nashville, TN (7%)
Median Asking Rents by Metro Area: April 2023
Redfin analyzed asking rents across the 50 most populous metro areas. Select metros may be excluded from time to time to ensure data accuracy.
| U.S. Metro Area | Median Asking Rent | Year-Over-Year Change in Median Asking Rent |
| Atlanta, GA | $2,129 | -0.6% |
| Austin, TX | $2,150 | -14.3% |
| Baltimore, MD | $2,005 | -2.5% |
| Birmingham, AL | $1,612 | -4.5% |
| Boston, MA | $3,911 | 2.5% |
| Buffalo, NY | $1,639 | 1.0% |
| Charlotte, NC | $1,960 | 10.5% |
| Chicago, IL | $2,337 | -6.0% |
| Cincinnati, OH | $1,562 | -1.9% |
| Cleveland, OH | $1,550 | 9.7% |
| Columbus, OH | $1,701 | 8.3% |
| Dallas, TX | $2,112 | -2.8% |
| Denver, CO | $2,724 | 3.2% |
| Detroit, MI | $1,655 | 0.0% |
| Hartford, CT | $2,069 | 3.9% |
| Houston, TX | $1,739 | -2.6% |
| Indianapolis, IN | $1,582 | 10.9% |
| Jacksonville, FL | $1,617 | -0.9% |
| Kansas City, MO | $1,577 | 8.0% |
| Las Vegas, NV | $1,693 | -7.1% |
| Los Angeles, CA | $3,544 | 4.2% |
| Louisville/Jefferson County, KY | $1,404 | 0.9% |
| Memphis, TN | $1,600 | -3.6% |
| Miami, FL | $3,066 | -1.9% |
| Milwaukee, WI | $1,782 | 8.0% |
| Minneapolis, MN | $1,849 | 3.7% |
| Nashville, TN | $2,183 | 7.0% |
| New York, NY | $4,046 | 2.1% |
| Oklahoma City, OK | $1,310 | -6.4% |
| Orlando, FL | $2,153 | -0.9% |
| Philadelphia, PA | $2,347 | 0.2% |
| Phoenix, AZ | $2,037 | -9.6% |
| Pittsburgh, PA | $2,050 | 7.9% |
| Portland, OR | $2,511 | 0.7% |
| Providence, RI | $2,590 | 16.0% |
| Raleigh, NC | $2,128 | 12.4% |
| Richmond, VA | $1,760 | 1.0% |
| Riverside, CA | $2,793 | 5.6% |
| Sacramento, CA | $2,636 | -4.0% |
| Salt Lake City, UT | $1,982 | 6.0% |
| San Antonio, TX | $1,457 | 0.2% |
| San Diego, CA | $3,443 | 3.9% |
| San Francisco, CA | $3,659 | -2.3% |
| San Jose, CA | $3,690 | 4.6% |
| Seattle, WA | $2,873 | -3.2% |
| St. Louis, MO | $1,546 | -1.7% |
| Tampa, FL | $2,255 | 3.3% |
| Virginia Beach, VA | $1,750 | 3.2% |
| Washington, D.C. | $2,685 | 2.5% |
Methodology
Redfin’s national rent figure represents a weighted average of median rents across the 50 most populous U.S. cities, weighted by number of rental listings. For the metro-level section of this report, we analyzed rents across the 50 most populous U.S. metro areas. Select metros may be excluded from time to time to ensure data accuracy. We analyzed rent prices from Rent.
Prices reflect the current costs of new leases during each time period. In other words, the amount shown as the median rent is not the median of what all renters are paying, but the median asking price of apartments that were available for new renters during the report month.