In dozens of American cities including Sacramento and Chicago, formerly redlined neighborhoods have a larger share of homes endangered by flooding than neighborhoods that weren’t targeted by the racist 1930s housing policy. Many of these at-risk neighborhoods remain predominantly nonwhite.
Modern flood-risk maps bear a striking resemblance to 1930s redlining maps. Americans living in formerly redlined neighborhoods—many of whom are people of color—are more likely than those living in non-redlined neighborhoods to see their homes jeopardized by water damage. And with sea levels rising and the frequency of major storms increasing at an alarming rate, families in flood-prone areas will grapple with intensifying financial and safety concerns in the years to come.
There are $107 billion worth of homes at high risk of flooding in parts of the U.S. that were designated undesirable for mortgage lending under the racist 1930s-era practice known as redlining, according to a Redfin analysis of flood risk by redlining grade in 38 major U.S. metropolitan areas. That compares with $85 billion worth of homes at high risk of flooding in places that were deemed desirable for lending. Put another way, 8.4% of homes in areas that were once deemed undesirable (redlined or yellowlined) face high flood risk, compared with 6.9% of homes in areas that were deemed desirable (greenlined or bluelined). The disparity is much larger in some metros, including Sacramento and Chicago. Metro-level data is covered in more detail later in this report.
This disproportionately impacts people of color, who are more likely to live in formerly redlined areas than in formerly greenlined areas. Today, 58.1% of households in neighborhoods that were once designated undesirable for mortgage lending are nonwhite, compared with 40.4% of households in neighborhoods that were labeled desirable for lending.
“Decades of segregation and economic inequality shoehorned many people of color—especially Black Americans—into living in neighborhoods that are more vulnerable to climate change,” said Redfin Senior Economist Sheharyar Bokhari. “Redlining kept home values in Black neighborhoods depressed, which in turn meant there was less money invested and reinvested in those neighborhoods for decades to come.”
“The cycle continues today,” Bokhari said. “As climate change fuels rising sea levels and powerful storms, many of these neighborhoods lack the funding for the infrastructure upgrades necessary to combat flooding.”
Redlining’s Legacy of Inequality
Redlining was a discriminatory lending practice in which the federally sponsored Home Owners’ Loan Corporation assigned grades to, and color coded, residential neighborhoods to indicate their “mortgage security.” Neighborhoods that received the highest grade of “A”—colored green on redlining maps—were considered “best,” while those that were assigned the grade of “B” were deemed “still desirable” and colored blue. Grade “C” neighborhoods, those designated “definitely declining,” were colored yellow, and grade “D” neighborhoods—the lowest grade—were deemed “hazardous” and colored red. In this report, we measure flood risk in two groups: greenlined and bluelined neighborhoods (grades A and B), and yellowlined and redlined neighborhoods (grades C and D).
Urban neighborhoods where Black families lived were likely to be redlined, while areas made up mostly of white families were likely to be colored green. In redlined neighborhoods, it was nearly impossible to get a loan, resulting in decades of diminished home equity and economic inequality for Black Americans. Although the Fair Housing Act of 1968 outlawed discimination in the housing market, the typical homeowner in a neighborhood that was redlined has gained 52% less in personal wealth generated by property value increases than one in a greenlined neighborhood over the last four decades.
“The lasting effects of redlining often prevent new businesses and homes from going into those areas,” said Kellee Bradford, a Redfin real estate agent in Sacramento. “Many investors just don’t see opportunities to turn quick profits in formerly redlined areas.”
Climate Change Has Intensified Racial Injustice
Due to decades of disinvestment, formerly redlined neighborhoods aren’t as financially equipped to prepare for and recover from natural disasters, which are becoming increasingly common. The 2020 Atlantic hurricane season was the worst on record, with 29 named storms. Global warming has caused sea levels to rise at an accelerated pace, enabling storm surges to move farther inland and causing even more destructive flooding.
History has shown that when storms hit, communities of color often suffer the most. Four of the seven zip codes that faced the costliest flood damage from Hurricane Katrina in 2005 were at least 75% Black. And after Hurricane Harvey hit Texas in 2017, Black and Hispanic Americans were about twice as likely as white Americans to say that they had fallen behind on their mortgage payments in the wake of the storm. Formerly redlined areas are also an average of 5 degrees hotter in the summer, in part because they have more pavement and fewer trees to cool the air— and soak up water when flooding occurs.
Historically, governments have focused flood-protection funds on areas with higher property values. This strategy is problematic because it disadvantages lower-income neighborhoods of color, many of which have lower property values stemming from the lingering impacts of redlining. A 2018 study found that Black residents tend to lose wealth after natural disasters, while white residents tend to gain wealth, in part because federal disaster money favors wealthier Americans.
“When major storms hit, Black communities are often forced to spend years rebuilding their homes instead of moving on and building home equity,” Bokhari said. “This perpetuates a cycle in which Black families lag financially.”
Some local and federal leaders are making strides in the fight against climate inequality. Officials in the frequently flooded Houston area recently opted to prioritize communities of color, instead of areas with the most property value, when spending on flood protection—a potential blueprint for other U.S. cities. On a national level, President Joe Biden has outlined an environmental-investment plan that calls for directing 40% of spending benefits to disadvantaged neighborhoods.
Sacramento Tops List of Metros Where Formerly Redlined Areas Face More Flood Risk
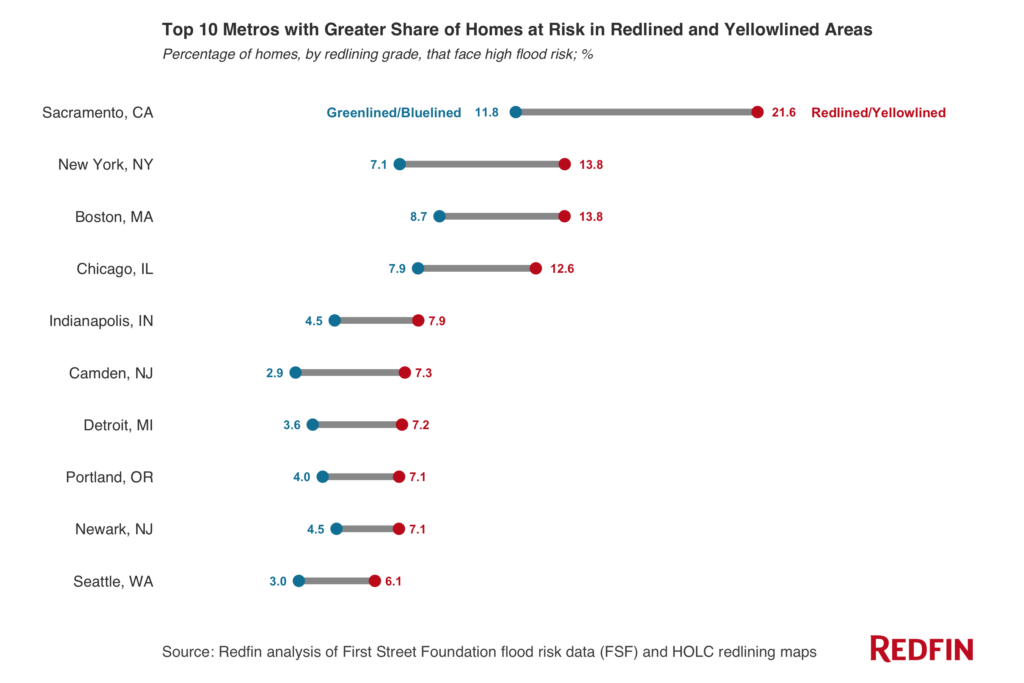
Nationally, redlined and yellowlined neighborhoods have a larger share of homes with high flood risk than greenlined and bluelined neighborhoods—but only by a small margin (8.4% versus 6.9%). The discrepancy is much larger in a handful of U.S. metros, including Sacramento, New York, Boston and Chicago.
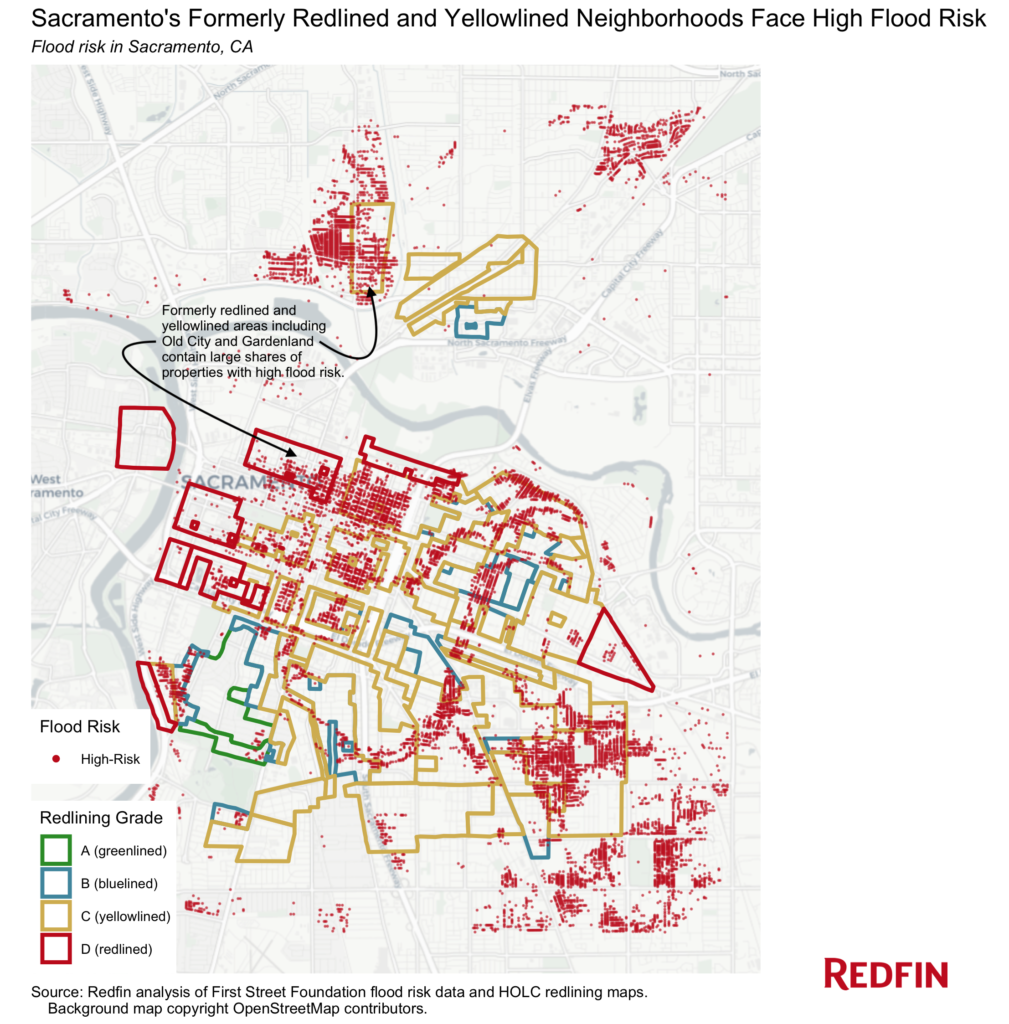
In Sacramento, 21.6% of homes ($2.6 billion worth) in redlined and yellowlined areas face high risk of flooding today. That compares with 11.8% of homes ($716.8 million worth) in greenlined and bluelined neighborhoods. That 9.8-percentage-point difference represents the biggest gap of any metro in this analysis that had a larger share of homes at risk in redlined and yellowlined neighborhoods.
Nearly half of the households in Sacramento’s redlined and yellowlined areas are occupied by people of color, compared with a third of households in greenlined and bluelined areas.
Sacramento’s Gardenland neighborhood—which was designated “definitely declining” (yellowlined) for mortgage lending—is an apt example. The area, which is minutes away from the American River and the Sacramento River, faces major flood risk. The Home Owners’ Loan Corporation noted in its description of the neighborhood that the area was subject to standing water during periods of excessive rainfall. It also said Gardenland’s lack of sewers and paved streets, inadequate transportation, distance to the city center and “heterogenous population” were among its “detrimental influences.” Three-quarters of Gardenland’s residents are nonwhite, according to a Redfin analysis of 2019 U.S. Census Bureau data.
“Gardenland is a mandatory flood-insurance area because it’s so close to the river and the levee,” Bradford said. “The neighborhood is mostly made up of apartment complexes, but there are also some older single-family homes. It’s popular with first-time homebuyers because the typical home goes for about $315,000—$85,000 less than the typical home in Sacramento.”
New York had the second biggest gap, with 13.8% of homes in redlined and yellowlined neighborhoods at high risk of flooding, compared with 7.1% of homes in greenlined and bluelined neighborhoods. Next came Boston, with a 5.1-percentage-point gap, and Chicago, with a 4.8-percentage-point discrepancy. For a breakdown of all 38 metro areas in this analysis, scroll down to the table at the bottom of this report.
In Chicago’s Bronzeville Neighborhood, Basement Flooding Plagues Black Homeowners
Chicago, which was built on a swamp, has significantly more homes at risk of flooding than previously thought. Nearly 13% of the city’s more than 600,000 properties are estimated to face 100-year flood risk, according to First Street Foundation—substantially higher than FEMA’s 0.3% estimate. And almost 90% of flood damage insurance payments in Chicago are made to households in communities of color, a 2019 study found.
In dollar terms, Chicago has $19.7 billion worth of homes with high flood risk in redlined and yellowlined areas, compared with $3.6 billion in greenlined and bluelined areas.
Bronzeville, a formerly redlined area in South Chicago, is one example of a predominantly Black neighborhood that faces major flood risk today.
“When the Great Migration happened between 1916 and 1970, Bronzeville became the center of Black culture in Chicago. It’s where Black professionals lived—the first Black doctors, jazz musicians and blues musicians. Many of these people had money but weren’t accepted in society, so they came to Bronzeville, which remains majority Black,” said local Redfin real estate agent Brittani Walker. “A lot of the single-family homes in Bronzeville were built in the 1900s and experience basement flooding due to sewer issues. My client there had to get her basement redone twice because of flooding. Eventually, she sold the property and moved into a nearby new-construction home that was much less likely to experience water damage.”
Redfin employee Lamar Austin lives in a 124-year-old rowhome in Bronzeville and has dealt with basement flooding twice in the last two years. The first time, there were 18 inches of standing water. When Chicago gets heavy rainfall, sewer drains that haven’t been upgraded in decades often overflow into people’s basements because they’re so corroded and filled with grime. Many of these outdated sewers are located in majority nonwhite neighborhoods on the south side, like Bronzeville, Austin said.
“When it comes to the city fixing the sewers, minority neighborhoods aren’t the priority,” said Austin, whose team recruits real estate agents for Redfin’s partner program. “The government prioritizes affluent neighborhoods on the north side, where homeowners already have the money to tear down aging homes and rebuild new ones that are resilient to flooding.”
Austin has flood insurance, but between sand bags, sump pumps and water-removal services, he has still spent an estimated $5,000 fixing and preventing water damage in his home.
Florida Bucks the National Trend, With High Flood Risk In Formerly Greenlined Areas
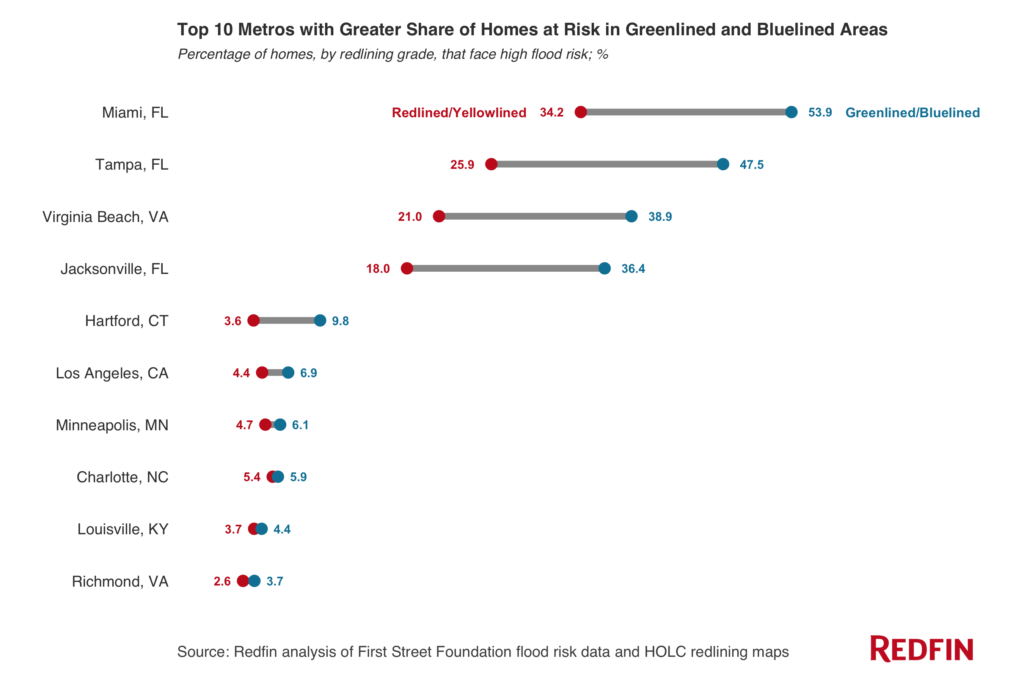
In 25 of the 38 metros in this analysis, redlined and yellowlined neighborhoods had a greater share of homes with high flood risk than greenlined and bluelined neighborhoods. But the remaining 13 metros—three of which are in Florida—bucked that trend.
In Tampa, FL, 47.5% of homes in greenlined and bluelined neighborhoods are at high risk of flooding, compared with 25.9% of homes in redlined and yellowlined neighborhoods. There are similarly large gaps in Miami, Jacksonville, FL and Virginia Beach, VA—all southeastern metros with access to the beach.
“As soon as people see the sun, the beach and the palm trees, they forget about the flooding,” said Cecilia Cordova, a Redfin real estate agent in Miami Beach. “If they find a house they like, they’re usually willing to live with the risk. Many buyers will also purchase a home and then renovate the property so it’s at a higher elevation, which minimizes much of the flood danger.”
Florida also has a large share of older residents, who are generally less likely to factor climate change into their homebuying decisions, Bokhari added.
“Still, some families have started moving farther inland to Miami’s formerly redlined neighborhoods as concern around sea-level rise has intensified, causing those higher-elevation areas to become increasingly gentrified,” Bokhari said.
Metro-Level Summary of Flood Risk By Redlining Category
| Metro Area | Share of Homes At High Flood Risk In Greenlined and Bluelined Areas | Share of Homes At High Flood Risk In Redlined and Yellowlined Areas | Percentage-Point Difference Between First Two Columns | Total Home Value At High Flood Risk In Greenlined and Bluelined Areas | Total Home Value At High Flood Risk In Redlined and Yellowlined Areas | Share of Nonwhite Households In Greenlined and Bluelined Areas | Share of Nonwhite Households In Redlined and Yellowlined Areas |
|---|---|---|---|---|---|---|---|
| Sacramento, CA | 11.8% | 21.6% | 9.8 pts | $716.8 million | $2.6 billion | 33.0% | 48.0% |
| New York, NY | 7.1% | 13.8% | 6.7 pts | $4.9 billion | $17.5 billion | 46.8% | 63.3% |
| Boston, MA | 8.7% | 13.8% | 5.1 pts | $3.8 billion | $8.5 billion | 26.8% | 45.2% |
| Chicago, IL | 7.9% | 12.6% | 4.8 pts | $3.6 billion | $19.7 billion | 43.6% | 57.8% |
| Camden, NJ | 2.9% | 7.3% | 4.4 pts | $123.6 million | $208.9 million | 35.9% | 55.5% |
| Detroit, MI | 3.6% | 7.2% | 3.6 pts | $873.7 million | $1.1 billion | 60.4% | 52.9% |
| Indianapolis, IN | 4.5% | 7.9% | 3.4 pts | $297.0 million | $1.4 billion | 25.8% | 42.4% |
| Portland, OR | 4.0% | 7.1% | 3.1 pts | $870.2 million | $2.1 billion | 14.5% | 23.8% |
| Seattle, WA | 3.0% | 6.1% | 3.1 pts | $3.0 billion | $2.6 billion | 23.1% | 38.3% |
| Newark, NJ | 4.5% | 7.1% | 2.5 pts | $831.8 million | $715.5 million | 37.5% | 75.7% |
| Elgin, IL | 3.4% | 6.0% | 2.5 pts | $22.1 million | $111.9 million | 41.4% | 57.8% |
| Dallas, TX | 1.9% | 4.3% | 2.4 pts | $738.6 million | $460.7 million | 30.6% | 67.9% |
| Milwaukee, WI | 2.9% | 5.1% | 2.2 pts | $224.4 million | $580.3 million | 32.5% | 43.3% |
| Birmingham, AL | 6.5% | 8.2% | 1.7 pts | $147.9 million | $394.5 million | 25.4% | 72.1% |
| Columbus, OH | 2.4% | 3.9% | 1.5 pts | $267.5 million | $384.8 million | 32.0% | 37.1% |
| San Diego, CA | 1.6% | 3.1% | 1.5 pts | $826.2 million | $1.3 billion | 26.4% | 54.7% |
| Warren, MI | 3.3% | 4.5% | 1.3 pts | $218.8 million | $650.4 million | 26.4% | 37.5% |
| St. Louis, MO | 4.2% | 5.5% | 1.2 pts | $18.5 million | $23.7 million | 38.6% | 54.6% |
| Nashville, TN | 8.6% | 9.8% | 1.2 pts | $1.3 billion | $1.2 billion | 15.4% | 46.0% |
| Baltimore, MD | 3.5% | 4.5% | 0.9 pts | $512.7 million | $646.2 million | 59.2% | 55.3% |
| Kansas City, MO | 3.7% | 4.6% | 0.9 pts | $280.5 million | $369.1 million | 20.3% | 46.3% |
| Cleveland, OH | 2.2% | 3.1% | 0.9 pts | $408.3 million | $462.3 million | 32.2% | 49.1% |
| San Francisco, CA | 1.9% | 2.6% | 0.7 pts | $1.6 billion | $2.4 billion | 48.9% | 50.4% |
| Oakland, CA | 4.2% | 4.6% | 0.3 pts | $2.5 billion | $2.9 billion | 38.3% | 62.4% |
| Lake County, IL | 2.8% | 3.1% | 0.3 pts | $88.1 million | $82.1 million | 8.4% | 22.3% |
| Atlanta, GA | 7.1% | 7.0% | -0.1 pts | $918.7 million | $1.1 billion | 26.7% | 55.5% |
| Tacoma, WA | 5.7% | 5.5% | -0.2 pts | $297.1 million | $515.3 million | 16.9% | 33.5% |
| San Jose, CA | 8.9% | 8.5% | -0.4 pts | $949.3 million | $1.6 billion | 43.7% | 65.1% |
| Charlotte, NC | 5.9% | 5.4% | -0.5 pts | $327.0 million | $176.3 million | 15.2% | 52.0% |
| Louisville, KY | 4.4% | 3.7% | -0.7 pts | $283.6 million | $207.0 million | 18.5% | 46.0% |
| Richmond, VA | 3.7% | 2.6% | -1.1 pts | $191.8 million | $162.1 million | 24.7% | 62.6% |
| Minneapolis, MN | 6.1% | 4.7% | -1.4 pts | $1.2 billion | $374.0 million | 20.5% | 39.3% |
| Los Angeles, CA | 6.9% | 4.4% | -2.4 pts | $21.2 billion | $21.1 billion | 49.0% | 70.3% |
| Hartford, CT | 9.8% | 3.6% | -6.2 pts | $130.0 million | $26.5 million | 35.0% | 47.5% |
| Virginia Beach, VA | 38.9% | 21.0% | -18 pts | $1.7 billion | $2.5 billion | 35.0% | 61.5% |
| Jacksonville, FL | 36.4% | 18.0% | -18.5 pts | $1.4 billion | $622.1 million | 24.6% | 61.3% |
| Miami, FL | 53.9% | 34.2% | -19.7 pts | $22.7 billion | $7.0 billion | 67.3% | 90.7% |
| Tampa, FL | 47.5% | 25.9% | -21.7 pts | $5.2 billion | $2.7 billion | 24.8% | 41.2% |
| National | 6.9% | 8.4% | 1.5 pts | $84.9 billion | $106.5 billion | 40.4% | 58.1% |
Methodology
Flood-risk data comes from First Street Foundation’s Flood Factor, which assigns six different flood-risk categories to properties across the U.S.—minimal, minor, moderate, major, severe and extreme. We matched flood-risk data with county records, allowing us to analyze more than 32 million properties across the most populous U.S. metropolitan areas. We then overlaid redlining maps from the Mapping Inequality website to determine which properties lie inside each historical redlining category. This allowed us to calculate the share of homes in each redlining grade that fall into at least one of three Flood Factor risk categories—major, severe and/or extreme. For the purposes of this report, we refer to homes in those categories as homes facing “high” flood risk. The value of homes at risk is the sum of the Redfin Estimates for homes facing “high” flood risk.
For the metro-level breakdown, we considered the 50 most populous U.S. metropolitan areas. We excluded 12 of those metros, including Houston and New Orleans, from the analysis because the parts of those metros facing high flood risk today don’t overlap with 1930s-era redlining maps. To calculate the national figures for this report, we aggregated data across the remaining 38 metros.
The data on the percent of nonwhite households was calculated by aggregating census tract counts (2019 five-year American Community Survey) by each redlining category—a method known as areal interpolation.