

On average, for every $1 billion increase in stock value of companies in a given area, the median sale price of nearby homes increases by $4,400. That doesn’t sound like much, until you consider an area like Silicon Valley, home to 45 publicly traded companies in this study, and about $1.1 trillion in valuation. When the aggregate stock value of these companies goes up, about three months later, home prices begin to rise at a corresponding rate. This means that an increase in stock value of just 1 percent for these Silicon Valley companies could lead to an increase of median sale price of more than $48,000.
So what? Certainly, we are not suggesting that homebuyers should make decisions about buying or selling based on how they believe nearby companies will perform on Wall Street. Nevertheless, in Las Vegas and Silicon Valley, homeowners live and die by the success or failure of their corporate neighbors.
This report takes a look at the relationship between local public company stock prices, or market capitalization, and median home sale prices over the past 20 years. Home price changes are most strongly correlated with local companies’ valuation changes in Las Vegas, Silicon Valley, and New York respectively.
Just imagine if back in 1990, someone guessed that Silicon Valley’s otherwise sleepy Mountain View, the home to computer chip maker Intel, would be a prime location for businesses capitalizing on the crazy new phenomenon called The Internet. Or, what if Bill Gates had decided to keep Microsoft in Alberquerque, where it was originally founded? Just consider this: Seattle’s median home price is $395,000 today, compared to $212,000 in Albuquerque. A $288 billion dollar company in New Mexico could have drastically changed its home price trajectory.
| Metro Area | Stock Market Influence Correlation |
Public Company Count |
|---|---|---|
| Las Vegas, NV |
0.56
|
10 |
| Silicon Valley, CA |
0.43
|
45 |
| New York, NY |
0.36
|
150 |
| Raleigh, NC |
0.33
|
6 |
| Los Angeles, CA |
0.33
|
82 |
| Atlanta, GA |
0.29
|
39 |
| San Diego, CA |
0.29
|
28 |
| Miami, FL |
0.28
|
24 |
| Baltimore, MD |
0.26
|
16 |
| Boston, MA |
0.24
|
75 |
| Portland, OR |
0.23
|
14 |
| Washington, DC |
0.22
|
43 |
| San Francisco, CA |
0.22
|
78 |
| Phoenix, AZ |
0.21
|
20 |
| Charlotte, NC |
0.19
|
17 |
| Chicago, IL |
0.13
|
80 |
| Seattle, WA |
0.11
|
21 |
| Philadelphia, PA |
0.08
|
47 |
| Denver, CO |
0.04
|
29 |
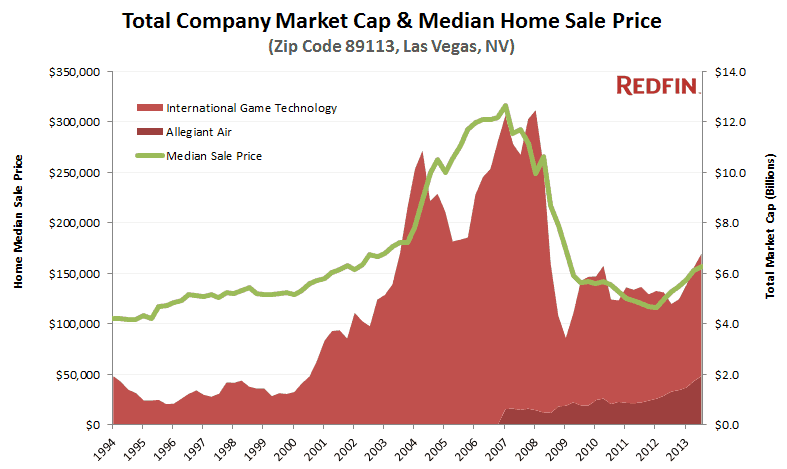
It’s no Gamble to Bet that Housing Moves with the Market in Las Vegas
We looked at 10 public companies across six zip codes in Las Vegas and found that Sin City had the highest correlation between home prices and stock prices. Zip code 89113 closely tracked the value of Allegiant Air and International Game Technology through the housing bubble, crash, and recovery.
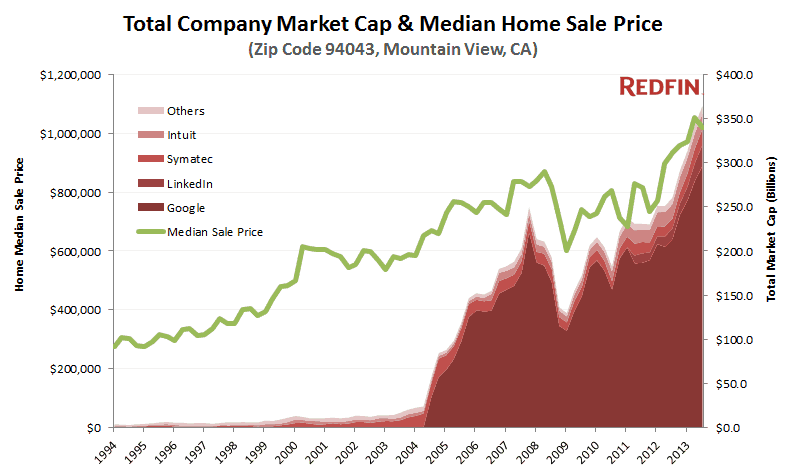
Google has Helped Drive Mountain View and Silicon Valley to New Highs
Zip code 94043 in the heart of Silicon Valley has seen substantial wealth created since Google went public in 2004. The nearly $300 billion Google valuation, among other local Silicon Valley companies, has helped drive home prices in Mountain View from $600,000 in 2009 to more than $1 million in 2013.
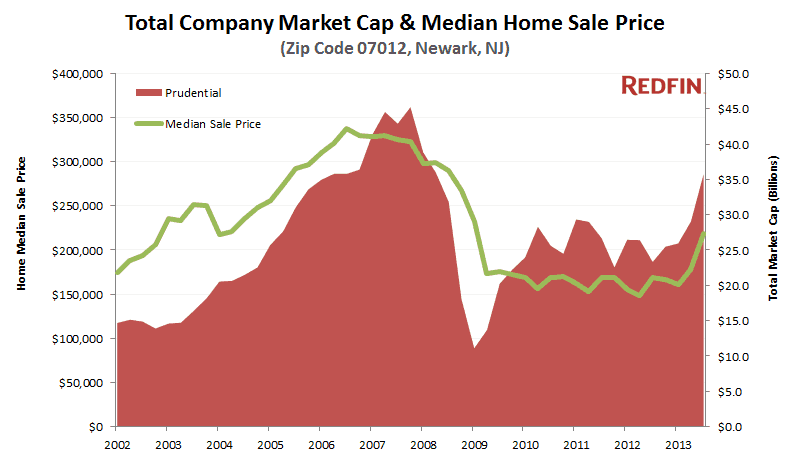
Prudential Pushes Newark Home Prices
Newark, New Jersey home prices have followed the performance of Prudential’s stock price for the past 10 years. The Tri-State area also saw many areas of strong correlation between house prices stock prices while it also included the most public company headquarters in the report.
Housing Market Will Continue to Move with the Stock Market
It’s not just the number of bedrooms, bathrooms and square feet that determines a home’s value. Local schools, buyer and seller psychology, fluctuating mortgage interest rates, and economic policy decisions are quantifiable forces in the housing market. With this analysis, we have found that public companies’ stock prices can can also move the housing market, with a particularly strong influence in certain markets. A rising economic tide will lift all boats, and housing and stock market equity are no exception. This year has proved especially strong for both housing and the stock market, but there are a few issues on the horizon, such as rising mortgage rates, the U.S. government shutdown, and the looming debt ceiling that could threaten these gains.
What Went Into This Report
This analysis takes a look at 824 public companies across 19 metro areas. We compared the year-over-year change in those public companies’ valuations with the year-over-year change in median home sale prices. We looked at homes in zip codes within 5 miles of the company headquarters’ zip code. We also offset our housing data by three months to reflect the time it takes to cash out the stock, and buy a house. We only included companies which currently have a total stock value of more than $500 million. At least five years of data was required for each zip code, although this did not preclude IPOs if there was another company which was public for at least five years.


