
Market trends suggest that many homebuyers are prioritizing affordability above walkability.
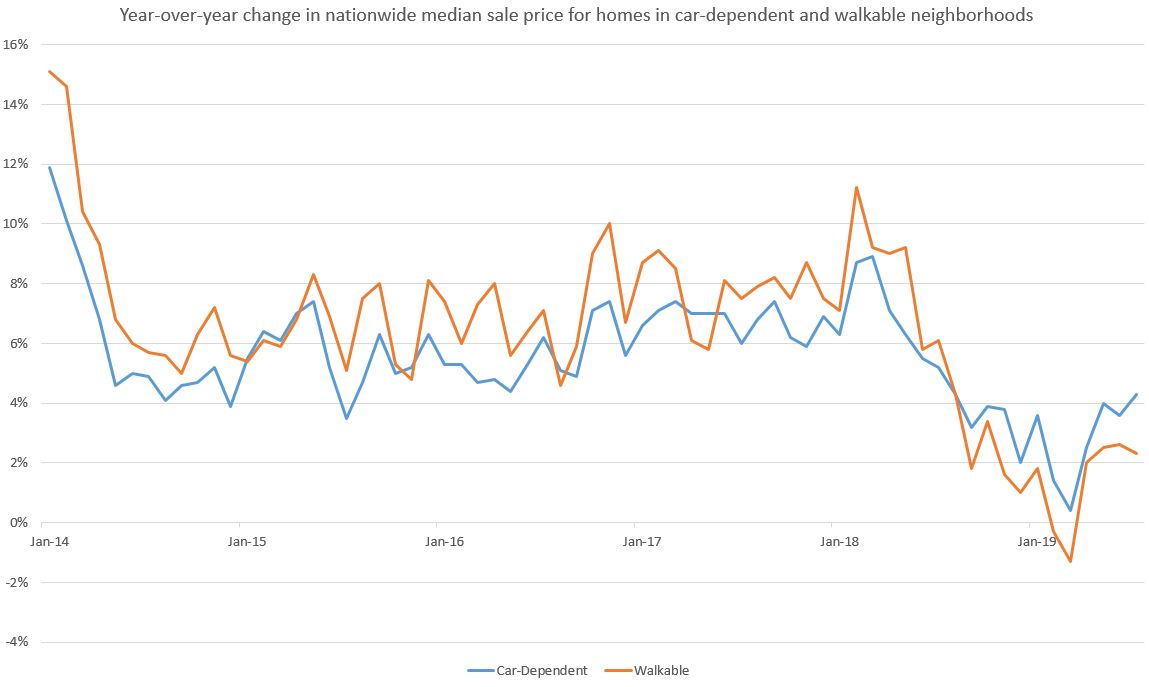
Home-sale prices in walkable neighborhoods across the country increased 2.3 percent year over year to a median $343,900 in July, compared to 4.3 percent annual growth to a median $312,100 for homes in car-dependent areas.
That’s according to data from Walk Score®, a Redfin company that rates the walkability of neighborhoods, cities and addresses. A place is deemed “walkable” if some or most errands can be accomplished on foot, while “car dependent” means most errands require a car.
Prices have been rising faster in car-dependent neighborhoods than in walkable neighborhoods since September 2018, around the time the overall market began to cool. For at least the four years prior, home prices generally increased faster in walkable neighborhoods than in car-dependent ones. The trend reversal likely reflects that many homebuyers, chasing affordability, have been priced out of the most walkable neighborhoods. As a result, demand has grown stronger in car-dependent neighborhoods.
“In the second half of 2018, homes in the hottest coastal markets became so expensive that most homebuyers became priced out of walkable neighborhoods, where homes tend to sell at a premium,” said Redfin chief economist Daryl Fairweather. “It’s not that people value walkability any less than they used to. Many homebuyers are simply relegated by their budgets to live in car-dependent areas, which have since seen demand and home prices grow at a faster rate. The trend also has implications for society, with families becoming further segregated by class and race, as well as for the environment, as more demand in car-dependent areas means more carbon emissions. Growing cities can combat these issues by adopting policies that encourage building more dense, affordable housing in walkable areas.”
Home sales were down in both walkable and car-dependent areas in July, but the decline was bigger in walkable areas, which posted a 7.1 percent annual drop nationwide. That’s compared to a more modest 3.3 percent decline in home sales in car-dependent neighborhoods. And while supply of homes in walkable areas was down 7.4 percent year over year, it declined more—10.6 percent—in car-dependent neighborhoods.
| Market summary for walkable versus car-dependent neighborhoods | ||||
| Walkable areas, July 2019 | Walkable areas, YoY Change | Car-dependent areas, July 2019 | Car-dependent areas, YoY Change | |
| Median sale price | $343,900 | 2.3% | $312,100 | 4.3% |
| Homes sold | 68,449 | -7.1% | 234,645 | -3.3% |
| Homes for sale | 208,119 | -7.4% | 607,163 | -10.6% |
| Median days on market | 39 | +3 | 38 | +1 |
| Sold above list | 27.3% | -15.3 pts. | 23% | -11.2 pts. |
| Average sale-to-list price ratio | 98.6% | -1.8 pts. | 98.6% | -1.1 pts. |
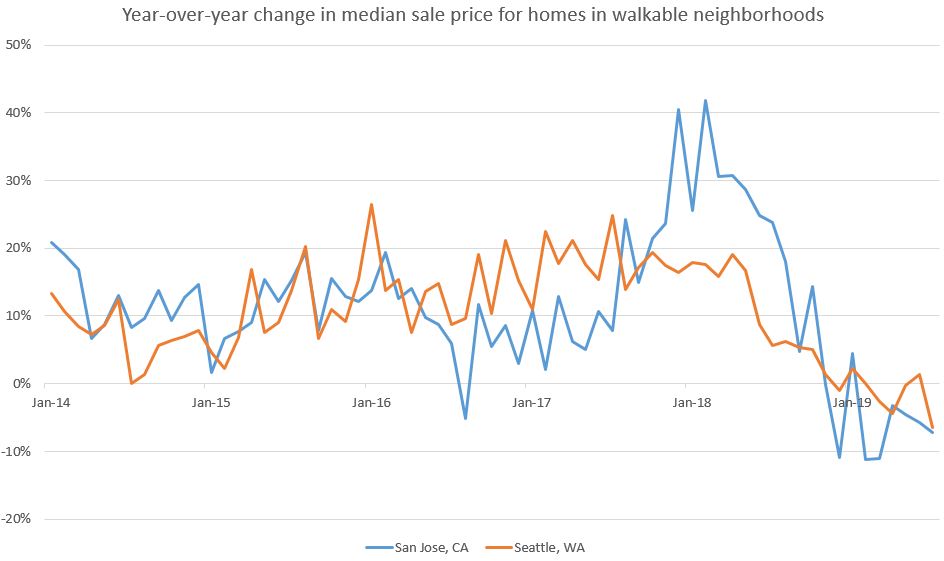
Two expensive West Coast metros—San Jose and Seattle—had the biggest price drops for walkable neighborhoods
San Jose (-7.2%) and Seattle (-6.5%) led the way for price drops in walkable areas in July. Though that mirrors the continued softening trends in the San Jose housing market, prices for homes in car-dependent neighborhoods rose 1.9 percent. In Seattle, homes in car-dependent areas posted a 1.5 percent year-over-year price increase.
In total, six U.S. metros saw year-over-year drops in home-sale prices in walkable neighborhoods in July. San Jose and Seattle are followed by Pittsburgh (-5.6%), Oakland (-2.1%), San Diego (-1.9%) and Houston (-0.2%).
Other metrics suggest that demand for homes in car-dependent neighborhoods is rising faster than walkable ones in San Jose and Seattle. In San Jose, supply of homes in car-dependent areas rose 5.5 percent annually in July, but supply in walkable areas increased 22.5 percent. Supply was up 13 percent in walkable parts of Seattle, but down 17.2 percent in car-dependent places.
Philadelphia and Cleveland saw the biggest increases in home prices for car-dependent neighborhoods
In all but four metros in the U.S., home prices in car-dependent neighborhoods increased year over year in July. Philadelphia, with a 17.9 percent annual increase, led the pack, followed by Cleveland (10.6%), Fort Lauderdale (9.1%), Pittsburgh (8.5%) and Miami (8%). In all those places except Pittsburgh, home prices also rose in walkable neighborhoods.
Walkable parts of Columbus, Kansas City and Detroit had the biggest price increases in walkable neighborhoods
Twenty metros buck the national trend, with median home-sale prices increasing more for homes in walkable areas than car-dependent areas. That’s particularly true in the Midwest, where homes tend to be less expensive than they are on the coasts and buyers may be able to afford homes in more central areas.
In Columbus, Ohio, home prices for walkable areas rose 16.3 percent year over year in July versus 5.9 percent for places more dependent on cars. That’s more than any other metro in the U.S. It’s followed by Kansas City, Missouri (11.7% rise for walkable; 6.1% for car-dependent) and Detroit (11.1% rise for walkable; 0.1% for car-dependent).
Methodology
This report is based on data from Walk Score®, a Redfin company that measures the walkability of addresses. For the purposes of this report, we combined three categories–Somewhat Walkable (ranking of 50-69; some errands can be accomplished on foot), Very Walkable (ranking of 70-89; most errands can be accomplished on foot) and Walker’s Paradise (ranking of 90-100; daily errands do not require a car)—into the “Walkable” category. We combined the two car-dependent categories—(ranking of 0-49; most errands require a car)—into the “car-dependent” category. “Walkable” means some or most errands can be accomplished on foot, while “car dependent” means most errands require a car.
Only metros where at least 1,000 homes in walkable neighborhoods sold in July were included in this report.


