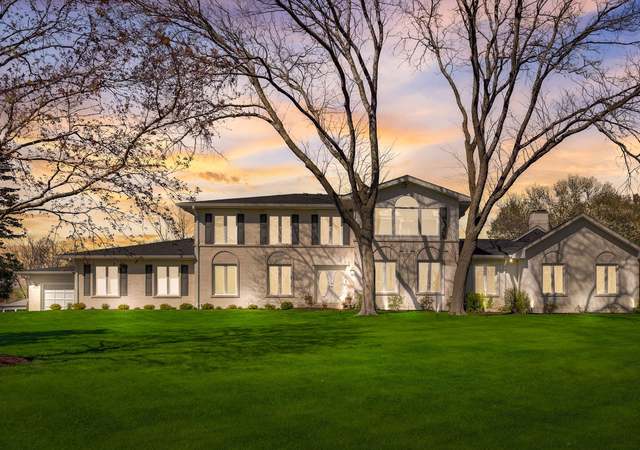
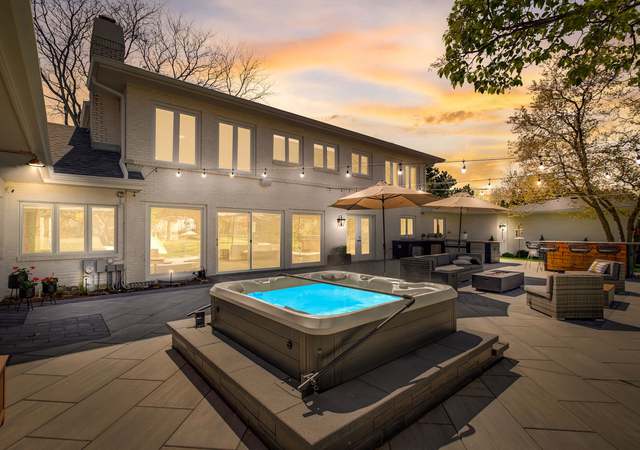
Prepare to be impressed by this stunning home nestled in the prestigious Lake Forest community. An abundance of windows fill the home with natural light, accentuating the recently updated, modern design and open floor plan, perfect for indoor and outdoor entertaining. The chef's kitchen boasts quartz countertops, a center island, and ample storage and counter space. There's a formal dining room, family and living room off the kitchen and a gorgeous new patio with an outdoor kitchen and hot-tub. The first floor "West Wing '' features a primary suite with soaring ceilings, fireplace, wet bar, walk-in closet, and luxurious bath with a soaking tub, separate shower, and double vanities. Adj
Suffield House is considered one of renowned architect David Adler's most important country houses. A collaboration with his designer sister, Frances Adler Elkins, this 15,000 sqft residence completed in 1934 is on 5.4 acres in the heart of Lake Forest. Built for Mrs. J. Ogden "Lolita" Armour, the entrance is neo-Georgian while the rest of the 15,000 square foot home was designed in a classical French style. The brick is whitewashed, with the warmth of buff pink coming through. This home's interior is loaded with priceless, perfectly preserved architectural features, including imported English paneling, antique Chinese oil paintings, exotic marbles, ornate plaster moldings and dec
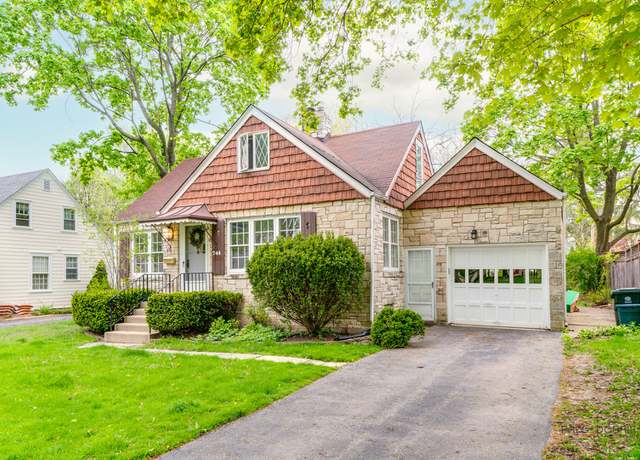
AMAZING EAST LF LOCATION Located right off Sheridan Road in the sought after Northmoor neighborhood. Adorable 3/3-bedroom, 2 full bathroom adorable home. Full basement with finished play space/rec room updated with laundry, great storage and bonus room. Additional features include open floor plan, hardwood floors on main level, wood burning fireplace, screened in porch and large backyard with room for a sizable addition. Incredible location. 1.5 block walk to the newly updated and enhanced South Park for basketball, pickle, tennis, baseball, bocce. with a surrounding bike and walking path. 1 mile on the bike path gets you to Market Square and the Lake Forest Metra station, and 2 miles to t
This classic brick Georgian sits on three quarters of an acre amongst towering trees in a quiet, sought after, East Lake Forest neighborhood. The amenities of this property are too extensive to list; however, if you require high ceilings, extraordinary finish levels and the ability to play golf in the winter, this home delivers. A must see for the most discerning buyer.
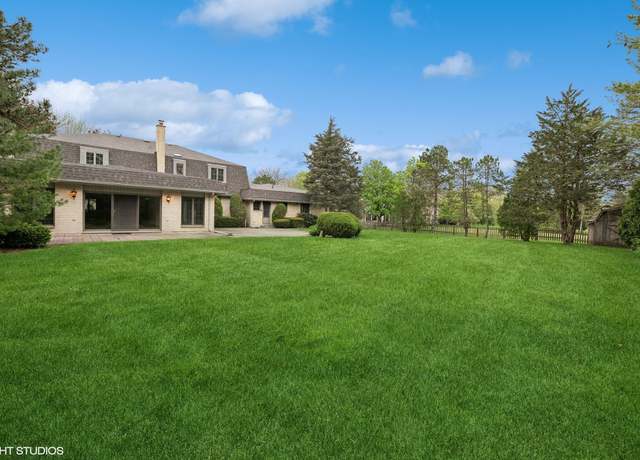
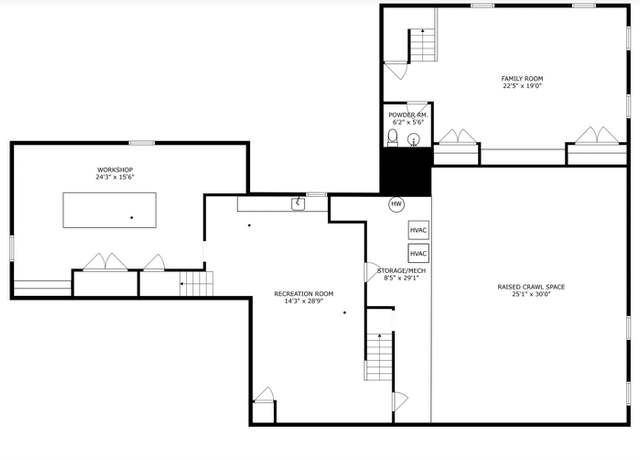
Professional photos including interiors will be available Friday. Sprawling single family home primed for renovation! Boasting 4 beds on the second floor and an additional massive ground floor bedroom with large bathroom, this home suits many different lifestyles and owners. Added onto over the years, the home features a massive dine-in kitchen, separate dining and living rooms in addition to a massive great room with vaulted ceilings. The home also features two separate basement rec areas including a large work room with two safes, and a walkout to the 3 car attached garage. First floor laundry, 3 full baths, 2 powder rooms, large outdoor patio, and big fenced in back yard. Home is being s
Welcome to 688 Buena Road, located in the beautiful Ponds neighborhood of Lake Forest! This home offers over 4,000 square feet of living space and seamlessly blends comfort and convenience. Upon entering, you're greeted by beautiful hardwood floors and a grand foyer. The main level boasts remarkable room sizes, starting with a large living room featuring a lovely fireplace and french doors leading to the expansive family room. With vaulted ceilings and a cozy fireplace, the family room is perfect for hanging out and relaxing. The kitchen is a chef's delight, equipped with a large island, top-tier appliances, and ample storage. Adjacent is the bright breakfast room, ideal for casual dining,
Evoking a sense of timelessness, this stately brick residence reigns over approximately 1.1 acres in Lake Forest. The property promises tranquility at every turn with a large, private fenced backyard nestled amidst flowering bushes, mature trees and verdant open space. The home brings over 4,389 square feet of refreshed space into elegant focus with five bedrooms and three full baths on the second floor, a first floor office, plus an English basement with the sixth bedroom and fourth full bath. Recent renovations, including fresh paint throughout, new carpeting, painted built-ins, and designer lighting, ensure a move-in ready interior meant to blend with a variety of tastes and styles. An a
Custom-built and completed in 2016 to the highest of standards, puts this Kelmscott Park Mayfair model in a class of its own. An extraordinary example of sophistication and meticulous design, situated on a premium end lot, providing the utmost in upscale living and entertaining. Fully integrated smart technology boasts a Sonos music system and a home automation system controlling the thermostats, window shades, exterior security cameras, and alarm. while also equipped for efficiency and whole home ventilation with two air conditioner units, two furnaces with blue light anti-viral systems, and an Aprilaire, year-round energy recovery system. Volume ceilings dramatic floor-to-ceiling windows,
New Price! Nestled at the end of a quiet cul-de-sac, this majestic traditional brick residence stands as a testament to timeless elegance. Offering an expansive 5,895 square feet of living space, this home boasts 6 bedrooms and 6.1 bathrooms, all set on an immaculate 1.25-acre parcel adorned with meticulously manicured landscaping and a welcoming circular driveway. As you step through the entrance, the foyer unfolds to reveal an exquisite curved staircase, complemented by gleaming hardwood floors, soaring ceilings, and beautiful millwork. This property offers a host of distinctive features, including an enchanting living room with a charming fireplace and a sophisticated library with French
Welcome to the epitome of modern elegance at 550 Hunter Lane in Lake Forest, Illinois. Tucked away in a private community just off Saddle Run Road, this pristine residence offers a remarkable blend of luxurious amenities and impeccable design that will capture your heart from the moment you step inside. As you enter, you'll be immediately greeted by the warmth of a double-sided fireplace, casting a cozy ambiance over the oak flooring throughout the main level. Soaring vaulted ceilings and skylights create a definitive WOW factor! The spacious entertaining room is perfect for hosting gatherings, complete with heated flooring, surround sound, and recessed lights, creating an inviting atmosphe
Located in the Northmoor neighborhood of East Lake Forest this wonderful four bedroom, 2.1 bath, brick ranch, sits on a wooded, builders half acre. Short walk to downtown, South Park or Walden's secret beach. Opportunities abound for this well located gem of a property. Excellent rental for investors. Sheridan School district.
Enjoy Clean Sleek Lines in this Desirable 2BR/2BA Third Floor Condo Just North of Downtown Lake Forest in the Modern Building of Lake Forest North * Sunny East Exposure and Tree Top Views with a Great Location on the Tier * Close to Elevator and Laundry plus 2 of the Best Parking Spaces in the Complex * Open Floor Plan with Updated Kitchen with Granite Countertops and Island * Hampton Bay Cabinetry and Kenmore Stainless Appliances is Open to the Great Room * Luna Bamboo Floors with Top-Grade Underlay Throughout * East Facing Nook in Great Room is Ideal for an Office Space/Sitting Area and Opens to the Balcony * Updated Baths with 2022 Toilets * Fixtures * Towel Bars * Other Improvements Inc
EIGHT UNITS SOLD! ONLY FOUR UNITS REMAINING! First floor unit with incredible outdoor space. New luxury development in downtown Lake Forest. 1095 Kelmscott Way offers a rare and unique opportunity to customize a new condominium in a boutique building with superior construction. Steps from the heart of Market Square, these condominiums are the ultimate in luxury, will range in size from 3000sf to 4220sf and are set in an ideal location with thoughtful architecture and rich landscaping. Meticulously planned and catered to the goals of each homeowner, the buyer, builder and architect will work together to customize each unit. This exceptional design experience will allow the buyer to close on
Located in the Havenwood neighborhood of East Lake Forest this classic brick and stucco home sits on a wooded . 72 acre lot. Nearly 5,500 square feet above grade and an additional 2,500 square feet in the lower level. The high ceilings and vast amount of natural light enhance the flowing floor plan creating a terrific environment for easy living and entertaining. The second floor offers five bedrooms, four full bathrooms, and a bonus room. Additional amenities include first floor office, wet bar, fifth full bath, laundry, attached three car garage and awesome Western exposure awninged screened porch. New cedar roof, gutters, downspouts and flashing installed March 2024.
Unwind in the comfort of this expansive 4-bedroom, 2.1-bath ranch home boasting 2,753 square feet of single-level living. Bathed in natural light, the open floor plan provides a wonderful flow from the gourmet kitchen - with stainless steel appliances, and granite counters - to the cozy family room. Enjoy gatherings in the spacious living room with a fireplace and built-ins, and entertain in the dining area with wall-to-wall sliding French doors and windows overlooking the patio and yard. Gleaming hardwood floors grace most rooms, while the serene primary suite boasts an updated bath with heated floors. Two additional bedrooms with a shared bath offer are perfect for family or guests, whil
Welcome to this stunning brick residence offering nearly 4000 square feet of updated living space on a beautiful . 81 acre lot. The bright and spacious kitchen features a center island, light gray cabinetry, stainless steel JennAir appliances and opens to large dining area and family room complete with wet bar, speakers and glass patio doors that open to the expansive backyard with a brick patio, built-in fire pit and grill, creating a perfect indoor-outdoor flow for gatherings. This floor also offers exceptional living space with a large sunny living room and office. The gorgeous primary suite is on the second level with vaulted ceilings, an adjoining sitting room and a luxurious bath wit
Stately Residence offering 4146 sq ft set on almost an acre in prime location. Many upgrades including newer Kitchen and baths. Ist floor study could also be a main-level bedroom, and bath. Enjoy the cozy den/family room with fireplace over looking the lush green backyard. Large primary suite with 2 closets and updated primary bath. Full basement with recreation room and possible 5th bedroom with full bath. (Steam shower in basement as-is). Fireplaces have not been used.
This nearly 3 acre estate is located down a private drive off of Green Bay Road in the heart of East Lake Forest. Designed for Samuel J walker in 1927 by Walter Frazier, with additions and alterations by David Adler in 1935. Perfect for the buyer with a passion for historic homes that exude character with fine features woven throughout and architectural details that can't be replicated today. Graced with beautifully scaled rooms, Zuber wall coverings, incredible moldings and timeless vintage details, this home features the unsurpassed European charm of the 1920's. The handsome white oak family room has numerous bookcases and is anchored by one of five unique fireplaces. Two lovely sunrooms
This classic center entry Whispering Oaks colonial offers a perfect blend of spacious living and entertaining space. Step inside to discover a large living room with a wood-burning fireplace, seamlessly flowing into a formal dining room and a Chef's kitchen with Crystal cabinets, stainless steel appliances, a separate breakfast room and small wet bar with wine cooler. The adjacent family room and a four-season sunroom provide the ideal settings for relaxation and gatherings, while the finished basement offers additional entertaining space, a bedroom, full bath and ample storage. Outside, a large fenced backyard beckons with an inviting in-ground pool, creating an oasis for outdoor enjoyment
Stately and impressive, custom built English manor home. All brick with limestone detail, cedar shake roof, copper gutters and bluestone patios. Beautifully proportioned rooms and a wonderful floorplan will suit the needs of today's families. Excellent detailing and quality throughout. Impressive entry foyer leads to formal rooms. Cheerful and bright gourmet kitchen is wonderfully equipped and opens to a fabulous family room. Entertaining in this home is a breeze! There is a lovely sunroom and a gorgeous wood paneled library. 10' ceilings on first floor are enhanced by substantial crown moldings. Flooring materials are marble, limestone and hardwood. Second floor primary suite with luxury b
Exceptionally updated condo just north of downtown Lake Forest, ready to change hands for the first time since its 2018 full rehab. The huge kitchen with 2018 appliances and 42-inch cabinets is a cook's dream, and it unfolds effortlessly into the dining and living areas for truly open living. This one faces away from the train line, with afternoon sun pouring in from large windows to the west. Hardwood floors roll throughout the space. The balcony features a glass-enclosed area -- great for both you and your plants to stay warm in cool months and still enjoy the daytime light. The building is outfitted with an updated lobby and party room with gym space. Storage is located in the basement.
Featuring a spectacular BRAND-NEW primary suite bath, updates to other bathrooms, and a freshly painted interior, this stately brick residence seamlessly blends classic elegance with modern functionality, creating ideal spaces for entertaining and relaxation. With sun-drenched rooms, sophisticated finishes, and radiant heated floors throughout, the home offers unparalleled comfort. The state-of-the-art kitchen is a chef's dream, while the dedicated first-floor office provides a perfect work-from-home environment. Upstairs, you'll find four large bedrooms, including two ensuites and two with updated shared bathrooms. The new primary suite bathroom provides double vanities, a free-standing Ba
Escape to your own personal retreat in East Lake Forest! This home is an entertainer's dream, offering a perfect blend of airy yet cozy retro-chic vibes. Situated on 1.42 acres at the end of a cul-de-sac, this iconic Mid-Century modern gem boasts impeccable architectural integrity, stunning updates and tons of natural light. Enjoy breathtaking views of the expansive yard and large swimming pool through a striking wall of windows and vaulted ceilings. Tall tongue and groove wood ceilings adorn the family room, kitchen, living room and dining room, enhancing the home's unique character. The coveted first-floor primary bedroom suite features a luxurious updated bath with oversized shower, heat
This special custom home is proposed for Lot 11 with first floor Primary Suite in Oak Knoll Woodlands. The plan features many high end finishes and a very open layout. Buyer can select all finishes per their specifications. Amazing location next to Conway Farms GC but close to downtown Lake Forest and 294/41 and commuter train. Bring your plan or we can design a custom home to your specifications. Buyer can purchase lot and delay construction or get started right away. Lot 8 and 10 also available.
Rare opportunity to buy a customized 4 bedrooms home in The Academy Woods. Academy Woods is a tree-filled neighborhood of single-family homes in Lake Forest, Illinois. Located at the end of a leafy drive next to a shimmering lake, Academy Woods is a beautiful and peaceful haven for the owners of the 77 homes on the property. This customized brick home has a choice location in Academy Woods layout. Architecturally stunning home was significantly expanded to create a more spacious residence with a rare 1st floor master suite and large second bedroom/library with additional full bath again on the 1st floor. Two more bedrooms on the second floor with a full bath complete this house. The living
Welcome to an unparalleled world of luxury in Lake Forest, where an extraordinary Nantucket-style shingle home graces a beautifully landscaped 1.4-acre lot on a safe cul-de-sac street. Stepping inside, prepare to be enchanted by the impeccable craftsmanship throughout the home. The foyer beckons with open arms, leading you into a dining room adorned with a crackling fireplace and framed by awe-inspiring views of the 7th hole of the golf course and beyond. The heart of this home lies within the breathtaking great room, boasting a soaring 19-foot Alder wood ceiling and a grand lannon stone fireplace as its centerpiece, flanked by built-ins. The gourmet kitchen is a sanctuary for culinary enth
STUNNING, single family home situated on a quiet tree-lined street located in Lake Forest! This unique property features a ranch-style front exterior combined with a rare two-story design! This home is situated on a large corner lot nestled in a quiet neighborhood near parks/forest preserves and zoned to great Lake Forest schools. The property features an attached, heated 3.5-car garage plus plenty of additional parking space on the long driveway. This 4 bedroom, 3.5 bathroom home offers an updated interior with an expansive layout that provides 5,663 square feet of living space. The main level features a gracious-sized living room with a built-in stone fireplace, built-in wood bookcases a
Enter the elegant foyer into spacious rooms and high level finishes. The inviting and spacious 2 story family room has lots of natural light and a charming fireplace. Overlooking the breakfast room, and the cook's kitchen with generous cabinet space and stainless appliances. The Spectacular Master suite and well appointed bathroom with excellent closet space. The Finished Basement invites adults or children to have a warm play room. Maintenance Free Living with bicycling and walking trails. Newer Cedar Shake roof and Gutters. Furnace and water heater. The perfect home you have been looking forward too. It's not everyday we get to enjoy such a wonderful home with superior charm and charact
Stunning home in Conway Farms built and designed by Gene Martin. Fabulous open floor plan perfect for easy living and entertaining flow with high ceilings and gas fireplace. First floor primary suite, two en-suite bedrooms on second level with large bonus room off of one of the bedrooms. Hardwood floors throughout. Main level laundry, wet bar. One level living with plenty of space upstairs. Beautiful views from your south patio. Enjoy all that Conway has to offer including club house, pool, tennis courts and snow removal.
A once in a lifetime opportunity to own a 2.58 acre historic family compound. Originally designed by Russell Wolcott/Robert Work in 1930 as a dairy barn for Cyrus H McCormick, Jr on the historic Walden Estate. The compound then comprised the dairy barn, dairy room and dairyman's house. In 1936, architect Jerome R. Cerny purchased the property for himself and began the conversion of the property to largely as we know it today. Currently, the property consists of a main house with 5 bedrooms, 4 baths and a newly renovated kitchen (2023); a separate, 1 bedroom, 1 bath, guesthouse with full kitchen and living room; 5 car upper garage, 2+ car lower garage, an underground, naturally cooled cella
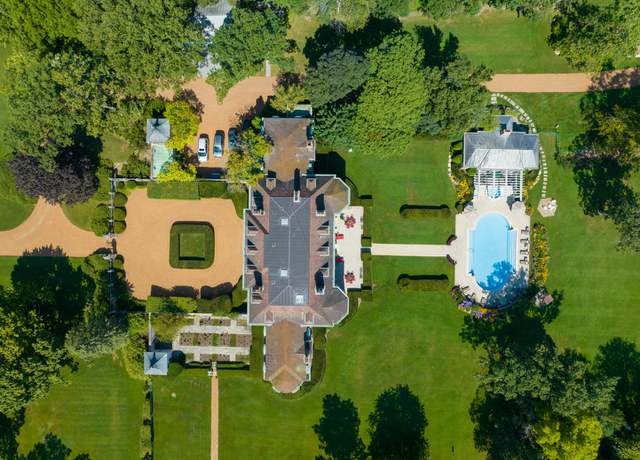
Nestled behind the gated entrance and along a picturesque driveway lies this magnificent Georgian brick residence, set on nearly 4 acres in the heart of Lake Forest. This secluded, in-town country estate ensures the utmost privacy, with fully fenced and gated grounds adorned with lush gardens. Upon crossing the threshold, a breathtaking double curved staircase captures your attention, a true testament to the quality and grandeur of this estate. The sunken main living room, with natural light, treats you to sweeping 180-degree views of the gardens and bluestone patio. A formal dining room leads to the more casual wing of the residence, featuring a chef's kitchen, spacious family room, and su
Nestled within the prestigious Conway Farms of Lake Forest, 330 Meadow Lake Lane presents unmatched elegance and luxury in a tranquil cul-de-sac setting. This expansive home welcomes you with its stone and cedar exterior, revealing a spacious and sophisticated interior beyond its doors. The residence features an open floor plan that ensures a warm, sun-filled environment, seamlessly connecting each living space. Upon entry, the grandeur of a two-story foyer unfolds, featuring a majestic staircase and an eye catching two-way fireplace that immediately draws attention. The gourmet kitchen, the heart of this home, is equipped with high-end appliances and a large island that serves both as a pr
This home is an entertainer's delight both inside and outside. The resort style setting has great privacy surrounded by mature trees and exceptional landscaping providing a perfect backdrop for the beautiful inground pool as well as enough open lawn for an occasional game of wiffleball. A raised bluestone terrace lends itself to casual alfresco dining. Inside you immediately experience the spacious floor plan that flows perfectly from one room to the next with its arched openings, high ceilings and exquisitely detailed millwork---all in perfect scale. The library is one of a kind with its inlaid walnut detailing, masterful fireplace and opens onto a 2nd secluded patio. High ceilings and ext
Rare opportunity to own a fabulous home on almost 2.5 acres in the heart of east Lake Forest on coveted Mayflower Road. This beautiful home exudes elegance and style throughout with incredible gardens, privacy and land! (2 separate PINs). This classic home was built in 1956 and was enlarged with an impressive First Floor Primary Suite with sophisticated details at every turn. The home boasts hardwood flooring throughout most of the residence, large rooms, 7 bedrooms (3 on 1st floor) and 5 baths (3 on 1st floor). Upon entering the gracious foyer with floor to ceiling windows, you view the gorgeous living room with a lovely fireplace and panoramic views of the private grounds with an expansiv
Nestled within the desirable Kelmscott Park area, this proposed new construction epitomizes modern luxury living. Situated within walking distance to the town center, train station, and beach, convenience meets sophistication in this premier real estate offering. Constructed by Landmark Luxury Group, this home exudes quality craftsmanship and materials and a wonderful open floor plan. The custom white kitchen, with large island, Wolf range and Subzero is perfect for casual dining and entertaining. A family room with a vaulted ceiling and fireplace provides a cozy gathering spot. A separate sitting area and study allow for a wonderful flexible use of space. The luxurious first floor primary
Experience timeless elegance and modern convenience in this exquisite Tudor home designed by renowned architect Edwin Hill Clark. Nestled on 1.83 acres in East Lake Forest's prestigious location, one block from the lake, this residence offers unparalleled access to Sheridan School, Lake Forest High School, Market Square, the Train, and Lake Forest Beach. From the moment you step through the arch top entry door into the foyer, you're greeted by impeccable craftsmanship and classic charm. Entertain guests in the spacious formal living room with an elegant fireplace or unwind in the sunroom, bathed in natural light and perfect for relaxation. The main floor office boasts built-in bookshelves a
Overlooking Onwentsia Golf Course, this beautifully updated 6,300+ SF brick home is situated on 2.36 private acres (this includes . 69 acres the current home owners purchased from the neighbor for $600,000) with a swimming pool, high ceilings and designer finishes throughout! Fabulous floor plan with 5 en-suite bedrooms and 5.2 baths, a luxurious first floor primary suite, stunning library, great room and dining room. Other amenities of this lovely home include a 3-car heated garage with 2 new lifts and a detached 1-car garage providing parking for 6 cars. Beautiful gourmet kitchen with high-end appliances, lovely inset cabinetry, a large breakfast area, hardwood flooring, a gorgeous great
EXCEPTIONAL OPPORTUNITY IN LAKE FOREST ON OVER THREE-QUARTERS OF AN ACRE LOT. THIS RANCH HOME IS CURRENTLY UNDERGOING EXTENSIVE RENOVATIONS AND PRESENTS AN OPPORTUNITY FOR DISCERNING BUYERS CRAVING A CUSTOMIZABLE DREAM HOME. THIS IS YOUR OPPORTUNITY TO WORK ALONGSIDE A QUALIFIED & METICULOUS DESIGNER. YOU CAN EXPECT SOPHISTICATED STYLES & MODERN DETAILS, HIGH-END FINISHES & INCREDIBLE ATTENTION TO DETAILS. BRING YOUR IDEAS OR CHOOSE FROM DESIGNS. OPTIONS TO EXPAND THE FLOOR PLAN ARE AVAILABLE. PERMITTING WITH THE CITY OF LAKE FOREST IS UNDERWAY YET THERE IS STILL TIME TO MAKE YOUR VERY OWN CUSTOM DESIGN CHOICES. PRICE LISTED IS BASE PRICE. FINAL PRICE IS DEPENDENT ON BUYER
Based on information submitted to the MLS GRID as of Fri May 03 2024. All data is obtained from various sources and may not have been verified by broker or MLS GRID. Supplied Open House Information is subject to change without notice. All information should be independently reviewed and verified for accuracy. Properties may or may not be listed by the office/agent presenting the information.
School data is provided by GreatSchools, a nonprofit organization. Redfin recommends buyers and renters use GreatSchools information and ratings as a first step, and conduct their own investigation to determine their desired schools or school districts, including by contacting and visiting the schools themselves.Redfin does not endorse or guarantee this information. School service boundaries are intended to be used as a reference only; they may change and are not guaranteed to be accurate. To verify school enrollment eligibility, contact the school district directly.
Lake Forest, Illinois boasts a well-structured transportation system, which includes both public and private options. For those who prefer to drive, traffic levels are generally moderate, making commuting by car a viable option. The city is also conveniently located near major highways, providing easy access to surrounding areas. Public transportation is readily available, with Metra commuter rail service offering routes to downtown Chicago and other suburbs. Learn more on our Lake Forest city guide.
What types of properties are available in Lake Forest?
Lake Forest, Illinois offers a variety of single-family home types, including ranch-style homes, colonial-style homes, and contemporary-style homes. These homes can be found throughout the city, with ranch-style homes typically located in the northern and western parts of Lake Forest, colonial-style homes scattered throughout the city, and contemporary-style homes primarily situated in the southern and eastern areas. Most properties in Lake Forest feature three to five bedrooms and were built between the 1950s and 1990s. To explore different property types for sale in Lake Forest, Illinois, use the 'Home type' filter located above the active listings. Customize your search by selecting options like single-family homes, condos, townhomes, and more.
What is life like in Lake Forest?
Lake Forest, Illinois offers a peaceful and serene living environment with its picturesque landscape of lush greenery, tranquil lakes, and beautiful parks. The region experiences a mix of seasons, including mild summers and snowy winters, providing residents with a variety of weather conditions to enjoy. The area boasts a range of job opportunities across various industries, from finance and healthcare to technology and education. Residents can engage in a plethora of activities, such as exploring numerous hiking trails, engaging in outdoor sports, and participating in community events that foster a strong sense of belonging. Lake Forest's tight-knit community encourages residents to connect and engage with one another through various social and recreational activities.
What are the schools and amenities like in Lake Forest?
Lake Forest, Illinois provides a variety of public amenities to its residents. You will find a plethora of restaurants offering a wide range of cuisines to satisfy your gastronomic cravings. The city is also home to numerous parks, providing serene spaces for relaxation and recreation. Grocery stores are conveniently located throughout Lake Forest, ensuring easy access to daily necessities. Additionally, other amenities such as fitness centers, libraries, and shopping centers are available, contributing to a comfortable and convenient lifestyle in Lake Forest, Illinois.
In the past month, 25 homes have been sold in Lake Forest. In addition to houses in Lake Forest, there were also 22 condos, 5 townhouses, and 1 multi-family unit for sale in Lake Forest last month. Lake Forest is a not walkable city in Illinois with a Walk Score of 18. Lake Forest is home to approximately 19,308 people and 14,962 jobs. Find your dream home in Lake Forest using the tools above. Use filters to narrow your search by price, square feet, beds, and baths to find homes that fit your criteria. Our top-rated real estate agents in Lake Forest are local experts and are ready to answer your questions about properties, neighborhoods, schools, and the newest listings for sale in Lake Forest. Our Lake Forest real estate stats and trends will give you more information about home buying and selling trends in Lake Forest. If you're looking to sell your home in the Lake Forest area, our listing agents can help you get the best price. Redfin is redefining real estate and the home buying process in Lake Forest with industry-leading technology, full-service agents, and lower fees that provide a better value for Redfin buyers and sellers.


 REDFIN IS COMMITTED TO AND ABIDES BY THE FAIR HOUSING ACT AND EQUAL OPPORTUNITY ACT. READ REDFIN'S FAIR HOUSING POLICY AND THE NEW YORK STATE FAIR HOUSING NOTICE.
 United States
 Canada