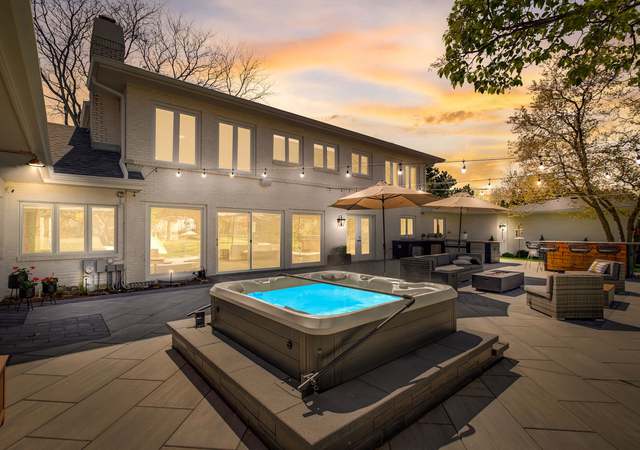
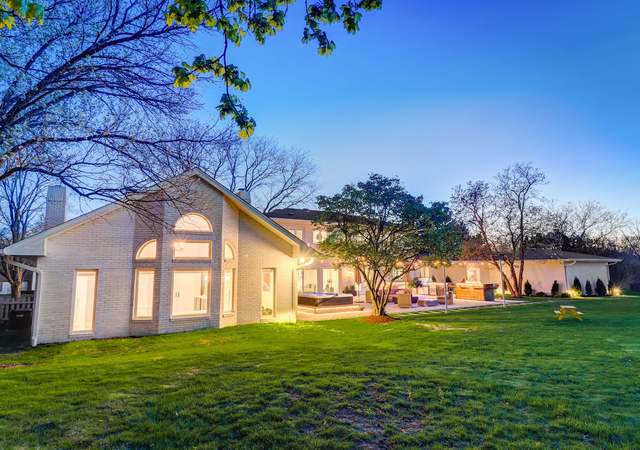
Prepare to be impressed by this stunning home nestled in the prestigious Lake Forest community. An abundance of windows fill the home with natural light, accentuating the recently updated, modern design and open floor plan, perfect for indoor and outdoor entertaining. The chef's kitchen boasts quartz countertops, a center island, and ample storage and counter space. There's a formal dining room, family and living room off the kitchen and a gorgeous new patio with an outdoor kitchen and hot-tub. The first floor "West Wing '' features a primary suite with soaring ceilings, fireplace, wet bar, walk-in closet, and luxurious bath with a soaking tub, separate shower, and double vanities. Adj
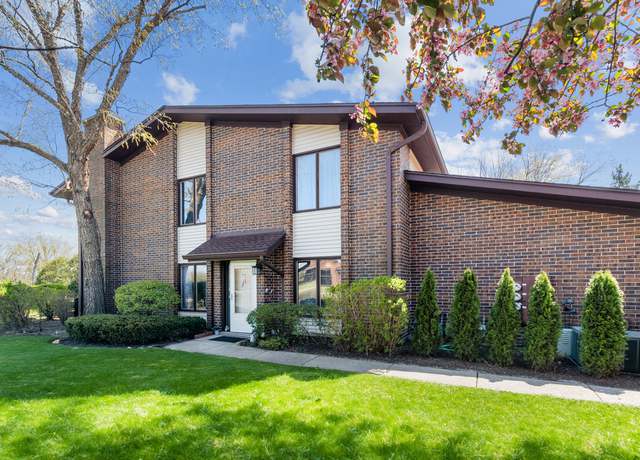
Unpack your bags and move right in to this stunning end-unit 2 story townhome offering gorgeous views of the pond and golf course. Boasting 2 bedrooms plus a loft space and 2.5 baths, the light-filled interior features modern upgrades, including an updated eat in kitchen with SS appliances and loads of cabinet space. The family room features gorgeous built ins, hardwood floors and a gas fireplace. Unwind on your private patio overlooking the water, or soak in the serene views from the balcony accessible from the primary bedroom. For convenience, a laundry room/ mudroom are located just off the attached one-car garage, providing an additional entryway and storage. Walk/bike to town, train, a
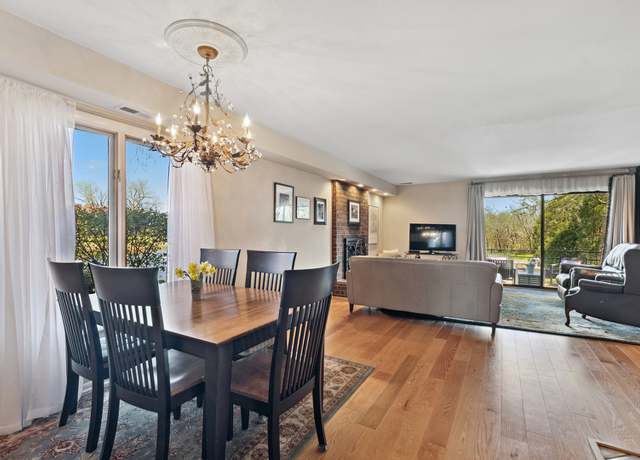
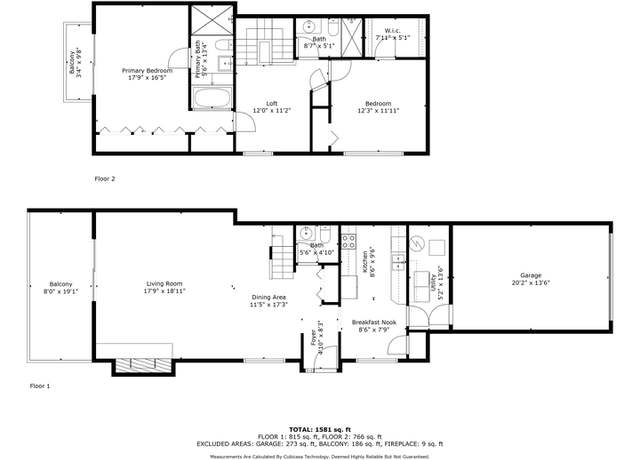
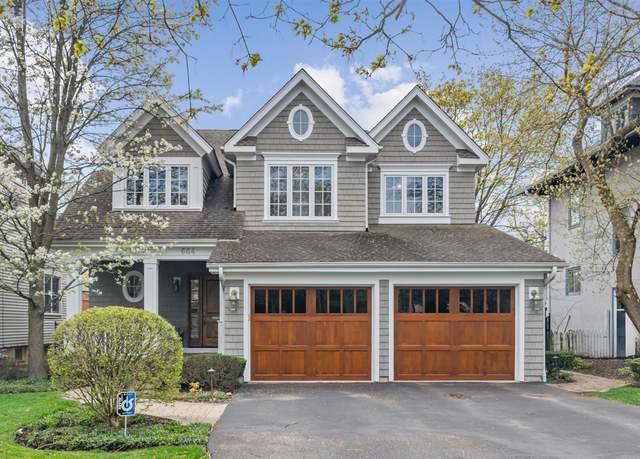
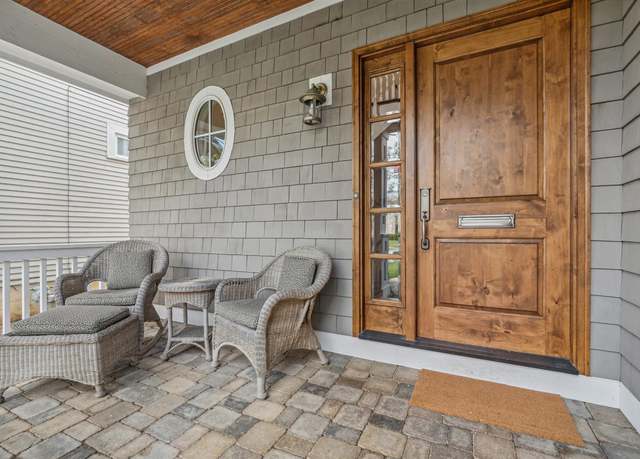
Move right in to this stunning Greystone built Nantucket inspired home. The front porch warmly welcomes you into a picture perfect home which boasts 5 bedrooms (4 upstairs, 1 in the basement) and 4.5 baths (1 full bath in the basement). As you make your way through the main level of the home, you will find a mudroom off the attached 2 car heated garage with custom cubbies and a laundry hook up as well as a home office with 2 built in desks, organized storage and coffered ceilings. The formal dining room is adorned with wainscoting and is currently being used as a music room. Step a little further into the light filled eat-in kitchen of your dreams which features an abundant amount of custom
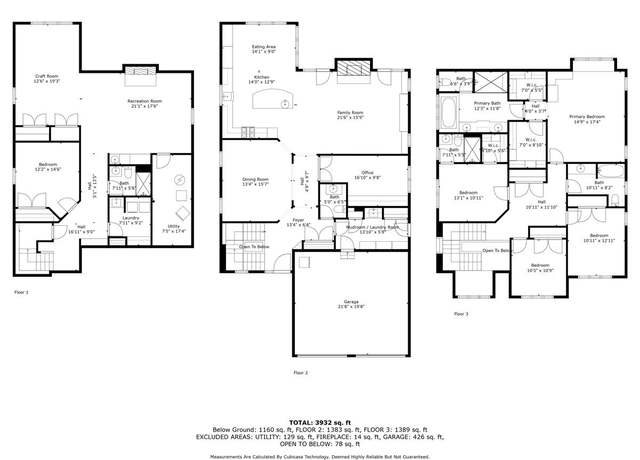
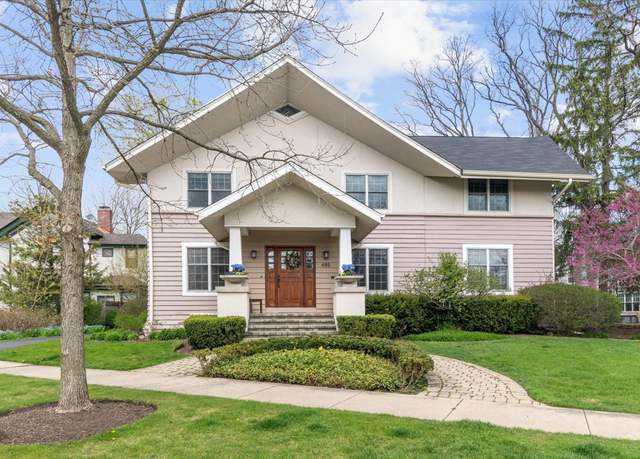
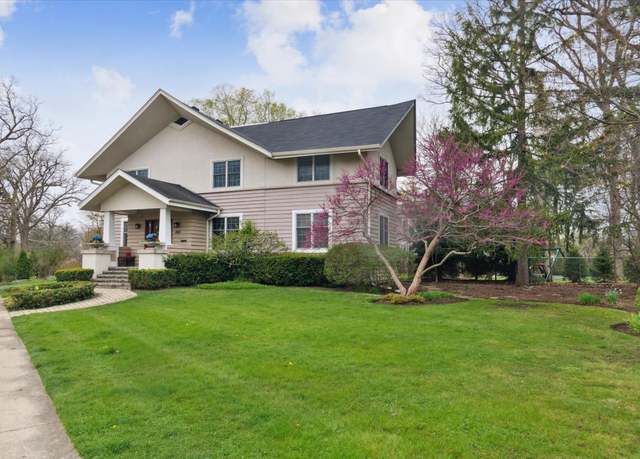
From the moment you arrive at this gracious arts and crafts styled home you will be captivated by the grand feel and updated charm of this truly special home. Step in to the enclosed foyer which is enveloped in a luxurious grass cloth wall covering and walk through to find a bright living room which has a wbfp, built ins, crown molding and a grand piano which is being conveyed with the home. A lovely dining room on the opposite side of the foyer is perfect for hosting small or large gatherings. The spacious updated kitchen is truly the heart of this home. Abundant cabinetry, an island w/ breakfast bar, stone countertops, SS appliances, double ovens, sub zero fridge, planning desk and eat i
This charming and lovingly maintained home is now available for the first time in over 60 years. The main floor's circular and versatile layout offers endless opportunities for customization, making it an exciting canvas for your creative vision. Highlights include an updated bright kitchen with stainless steel appliances, hardwood flooring (note: hardwood flooring is under all carpeting), and a spacious unfinished basement ready for your ideas. Choice of Highland Park or Deerfield High School. Amazing opportunity ~ being sold as-is.
Classic Tudor home located in prime North Deere Park location with never-ending ravine views and private beach access. The first floor has been recently updated with new high-end kitchen, dining room, expansive great room with all new dramatic floor-to-ceiling windows, hardwood floors and outdoor bluestone patio and Trex deck. Formal entry opens up to the sun-filled great room featuring two quartz clad fireplaces, built-ins with wine/beverage centers plus wet bar and two seating areas. Sliders open up to brand new bluestone patio with built-in stone firepit and lead to new Trex decking. A true cook's kitchen featuring custom white cabinetry, quartz counters & backsplash, large waterfa
Rarely available unit in the Legacy Club Apartments. 2 Bedroom, 2 Bathroom with large living room, dining area, eat in kitchen and laundry closet. Unit sold in "as is" condition. Building has an exercise room and conference facility.
Move-in ready, gorgeous, newly remodeled townhouse in the most desirable location in Chantilly! Updated kitchen in 2023 with white cabinets, quartz countertops, farmhouse sink, and brand new stainless-steel appliances. Lots of sunlight! Improvements include new exterior doors, new hardwood flooring throughout, modern half bath and so much more! Spacious master bedroom with plenty of closet space including cedar closet leading into a beautiful private master bathroom! 2 car garage with lots of storage space. Privacy fenced yard and patio. A/C replaced in 2017, water heater replaced in 2020, and new washer/dryer in 2020. Steps away from an outdoor pool, walking trails & dog park. Just f
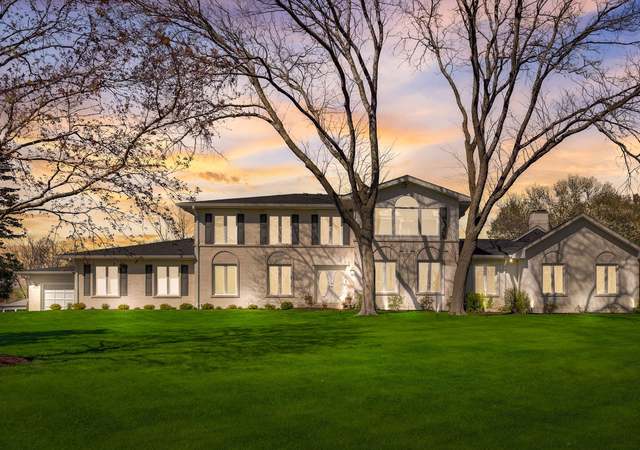
Breathtaking ravine views surround this 7 bedroom, 5 full and 1 half bath home on a private half acre wooded lot in prime East Highland Park location. This custom home is flooded in natural light, has the perfect open floor plan and offers high-end finishes, built-ins, hardwood flooring, custom millwork and lots of closets and storage. First level features a welcoming foyer, home office, spacious dining room, family room with fireplace, pantry and butler's pantry. A cook's kitchen featuring wood cabinetry, granite counters, high-end stainless-steel appliances including two dishwashers, two islands that are great for entertaining and an enticing breakfast room. Kitchen opens to family room,
Welcome to a distinctive condominium situated in the heart of Fort Sheridan. Constructed in 1893 and designed by Holabird & Roche, this building initially functioned as the Infantry Drill Hall, before being repurposed as a gymnasium. In a meticulous transformation, this historic building has been artfully converted into 11 uniquely designed condominiums. The featured end unit, with triple exposures - east, north, and south, unfolds a panorama of natural beauty, light, and space. The majestic, wide, rounded arch entrance on the eastern facade has been innovatively repurposed into magnificent, expansive windows, flooding the space with natural light and creating a vibrant, airy ambiance
This finely crafted beach home could NEVER be built for this price today set on 1.5 acres by top shelf luxe builder Mike Wojcik and Marvin Herman Architecture. Equipped with an elevator to all floors, this finely crafted masterpiece delivers the ultimate living experience with floor to ceiling picture windows that allow the backdrop of panoramic lake views to radiate throughout. Sensational level of build quality throughout: detailed door casings & moldings, chestnut wide plank floors, gorgeous neutral stones & white marbles, all accented with meticulous trim carpentry. Chef's kitchen overlooks the entire first floor w/ nooked in breakfast booth, butcher block w/ soapstone count
Totally renovated stately home in prime East Highland Park location. This 6, 4.2 bath home combines classic old world charm with modern high end finishes. Enter into tiled vestibule with coat closet. Front foyer opens to large living room with fireplace. Formal dining room leads to modern kitchen with Wolf and Sub Zero appliances, elegant cabinetry, and wood plank ceiling. Family room with outdoor access, beautiful sunroom, laundry room, office, and two powder rooms complete the main level. Second floor offers a spacious primary bedroom with multiple large closets, fireplace, and luxury bathroom. Three additional generous bedrooms and two additional bathrooms, one ensuite. Third level offer
Super charming classic Ravinia English Cottage! Features beautiful and spacious living room with Palladian windows, hardwood floors, & wood burning arts & craftsman style fireplace. Very bright through out! Separate large dining room. Recently updated kitchen with new quartz countertops & stainless steel appliances. The basement was recently finished featuring a second full bath, recreation room, office / 3rd bedroom, art studio / workroom, storage room with beadboard ceiling, and laundry room (new carpet was installed in '24). Enjoy morning coffee from the large deck overlooking the beautiful & professionally landscaped yard with mature English perennial garden. A
Truly a fabulous unit. Redone with all new flooring throughout, brand new furnace with thermostat, new washer and dryer with new cabinets above. This beautiful unit offers 2 large bedrooms with ample closet space, yet can be used as a one bedroom with office/den while putting in a pullout sofa for those who work out of their home but also need the option for that 2nd bedroom. Both bathrooms have been updated. The kitchen has tons of cabinets, with granite counters, stainless steel appliances and 2 spacious pantries. While there is an island one can eat at, you'll also find built in seating with storage ready for a table. All new Decora switches & outlets, as well as all new black door
Dramatic two story entry sets the tone of this gorgeous updated home, ready to be moved right into. Light colored bleached hardwood floors, white kitchen with new appliances, modern architectural detail around the fireplace in Great Room. Perfect office/living room off foyer with gracious dining room on the other side of the foyer. BIG kitchen with stainless steel appliances, side by side refrigerator/Freezer, breakfast bar for to sit at with stools and large breakfast area with bay to host table. Great room has tons of natural light beaming in from all the windows and doors looking out to the back yard. Sizeable Primary bedroom and Bath with new flooring, tray ceiling, 2 walk in closet, 2
FIRST FLOOR master. .. .awesome first floor open floor-plan ideal for those wanting to live easy. Incredible backyard vistas of the tranquil pond provide the perfect private setting from walk out deck. Soaring ceilings, double atrium foyer with cascading staircase sets a grand yet comfortable feeling. This 5 bedroom 4.1 bathroom home features many custom upgrades with large gourmet kitchen with top of the line appliances & separate breakfast area with French doors to the huge walk out deck. Elegantly appointed dining and living room with large windows bringing the outside in. Family room with more floor to ceiling window and FP off the kitchen. First floor master bedroom with luxury m
Tucked away in the desirable Town of Fort Sheridan, 96 Ronan Road offers an unprecedented opportunity to own a piece of history. This former 1892 artillery storehouse was transformed into a striking 6,000 square foot residence. It is an architectural marvel that blends rustic elegance with contemporary comfort. The serene ambiance of this home transports you to a timeless paradise. The home's former life is celebrated by the sixteen majestic 10-foot archways, which have been artfully transformed into doorways, each with retractable screens. The newly replaced windows on the first floor offer clear views of the dramatic gardens, allowing you to immerse yourself in the unparalleled natural be
Recently updated 4 bed/2.5 bath brick ranch home with fabulous floor plan, high vaulted ceilings, 3 skylights, huge living room & large family room, new luxury vinyl plank flooring. 109 ft wide backyard, patio and 2.5 car wide concrete paved driveway. Large 9KW Solar PV roof-top system pays electric bill. French doors from family room lead to a bright living room. Unfinished basement with, tons of storage, and laundry. Close to elementary schools and shops. Choice of HP or Deerfield High School. Broker owned/interest
This spectacular Mid-Century ranch provides a once in a lifetime opportunity to live in a work of art designed by renowned architect Samuel Marx. Situated on 1.6 acres in a private location at the end of a cul-de-cac in East Highland Park's sought-after South Deere Park, the home offers an abundance of natural light, luxury finishes, vaulted ceilings, incredible sight lines, ample table land, and extraordinary ravine views. Too many architectural details to mention. Ideal floor plan includes a gracious entry foyer, a warm den with wet bar, a large cook's kitchen with tons of cabinet storage and work space, granite counters, and lovely breakfast area, and large dining room and living room wi
Boutique Luxury Condominium Building. Gracious foyer that makes one feel like they are entering into a single family home. 3 bedrooms, one is currently used as an office/den. 2 full baths plus a powder room. Large open living room and dining room. Kitchen has 2 refrigerators, high end appliances and a desk area. Breakfast room can be used as den if desired. Luxurious Primary suite with huge walk in closet. Two out door patios, one off the great room and one off the primary bedroom. 2 heated garage parking spaces plus building host exercise room.
This solidly built brick home has multiple very generous living spaces throughout. Great bones in great condition! Very convenient location to downtown Highland Park, transportation, schools and hospital. Hardwood floors and tons of windows to provide tremendous natural light through the day. Three generous sized bedrooms on 2nd floor with full bath. First floor provides the sought after OPEN FLOOR PLAN for fantastic entertaining or family gatherings. The lower level offers above grade windows, fireplace and wonderful built-ins, large laundry room with door to backyard. Full bathroom which is updated with nice sized shower. Basement is extra bonus large area for multiple uses. Driveway/yard
Freshly painted interior complete with new flooring throughout, this condo is perfect for family gatherings and holiday celebrations featuring an inviting foyer as you enter the space. As you turn to the left, you are greeted to an immense living room and dining room. The condo boasts an additional leisure space in the form of a family room with a fireplace. You can show off your culinary skills in the eat-in kitchen that has access to a large balcony. Sleep peacefully in the large primary bedroom with two walk-in closets or in the privately located second bedroom. One bathroom was not enough for this condo which contains two full baths and a separate laundry room. The building offers a ran
Location, location, location! Don't miss out on this fantastic opportunity to move in and enjoy the spring and upcoming summer in this move in ready home! Features include almost 3400 sqft of living space, large Chef's kitchen with island and luxury appliances, marble bathrooms with high end finishes, hardwood floors throughout, oversized bedrooms, and beautiful, private backyard perfect for entertaining. This home has a formal foyer, dining room, kitchen, and one bedroom on the main level with full bath. On the second level is a large open living room with fireplace and terrace, three more bedrooms and an oversized primary suite with private spa bath. If you are looking for space, this is
Welcome to 1146 Marion Ave, a beautiful new construction home in highly desirable suburb of Highland Park. This all new all brick construction home is located in a wonderful location, right across from Northmoor Country Club and just a block away from the Chicago Botanical Gardens. It features 3 large bedrooms, all on the 2nd level, with hardwood floors, white trim and molding, and beautifully accented ceiling trim and details. There are 3.5 baths including a spacious and beautiful primary bath with his and her sinks, big shower, and luxurious soaking tub. The main level features a great open layout, a stunning chef's kitchen with white maple cabinetry, quartz countertops, high end stainles
Ideally located on one of East Highland Park's most coveted streets, this 1915 English manor home designed by Mead and Johnson offers expansive indoor and outdoor living space on 1.5 acres. Substantially renovated with over $500,000 of enhancements, this home provides a perfect blend of old-world architectural detail and modern convenience. The home's center entry leads into a distinctive octagon shaped reception hall with domed plaster ceiling. The adjacent 2-story beamed ceiling living room offers dramatic living and entertaining space, with French doors connecting to a sunroom for more intimate gatherings. The formal dining room adjoins a stunning new top-of-the-line kitchen and a sun-fi
Spacious home with fabulous floor plan. This home can be contemporary or transitional. Newer flooring on much of the 1st floor, all new carpeting on 2nd floor. Grand foyer has limestone floors and soaring ceiling. A true Cook's kitchen with Island, table space, lots of granite counter space and pantry with high end appliances. First floor also features a grand foyer, large dining room, library/office, two family rooms and laundry/ mudroom as well as a first floor bedroom and full bath. 2nd floor Master Suite has gorgeous hardwood flooring, new plantation shutters, spa like bath with jacuzzi tub, dual sinks, enormous walk in closet & balcony. Family sized bedrooms all feature amazing c
New Construction Coming to Highland Park! Nestled in the heart of Highland Park, this new construction single-family home offers an unparalleled blend of space, style, and sophistication. Boasting 4 bedrooms and 5.5 baths across 5,000 square feet, this residence combines luxury and convenience; no detail is overlooked in creating a residence that defines modern design trends yet leaves plenty of space. Minutes away from Millard Park Beach, Sunset Valley Golf Course, the world famous Ravinia, and in close proximity to the action of the downtown and Metra rail, this home offers an amazing open floor plan that connects the living, dining, and kitchen areas, making it ideal for both everyday li
A luxuriously spacious corner-unit townhome in a great location, within walking distance to downtown Highland Park amenities and the Metra. The main floor's open, airy floor plan will quickly make you fall in love with the home. The home features a spacious kitchen with an eat-in breakfast bar that opens up to the dining room and the adjoining living room with a modern brick accent wall. The living and dining room contain large windows that give the rooms plenty of natural light and overlook the enclosed outdoor area, featuring a 21x11 deck with built-in seating and a remove-controlled awning. The main floor powder room adds an additional convenience with its tall wall mirrors and great sta
Once in a lifetime opportunity to own this exquisite and dramatic penthouse. Welcome to Park Sheridan, the North Shore's newest and most luxurious residences! This boutique residence will offer the perfect combination of space, location, amenities, and privacy, creating an elevated lifestyle for all who live here. Occupancy Spring 2025. There's no better time than right now to make your dream home a reality, this is the last penthouse available! No detail overlooked in this 3 bedroom + study, 4.5 bathroom home! Impressive mezzanine level offers an additional 350 square feet, providing versatility to meet your lifestyle and needs. 11'' ceilings flooded with natural light, designer finishes
Just under ONE ACRE| 1490 Ridge Rd | Wow your Guests at this Marvelous, One of a Kind Home in Sherwood Forest, Highland Park. From the Moment you Drive up the 400 Ft Private Driveway, to the Circle Drive, you will be in AWE! Absolutely STUNNING! 5 bedroom or make one an office , 5 Exquisitely Designed Bathrooms / Chef's Kitchen with a Wolf Built in Coffee Maker!! / so much to list that is new, Make an Appointment to see this Special Home. / 3770 sq ft livable space/ home equipped with NVR (Network Video Recorder) -Homeowners can enjoy Peace of Mind, Wired with 6 Surveillance Cameras w/ Option to Increase ; Subscription Required
Tastefully updated in 2024, this superb and spacious 3-story home nestled deep, on 1/2+ acre of professionally landscaped lot in desirable Braeside of Highland Park. Completely rebuilt and expanded from ground up in 2013 to over 5,000 sq. ft. Beautifully remodeled gourmet kitchen with huge island, white cabinets, quartz counters and backsplash, brand new high-end SS fridge and double oven gas stove. Other updates include a new white vanity with sink and toilet in powder room, remodeled main floor full bath, LED lighting, refinished hardwood floors on main level, freshly painted interior and exterior. Main level features open concept floor plan with inviting foyer, powder room, large living/
Grand renovated Ranch in coveted South Deere Park on large property with private beach access. This 4700 sqft. home features a flexible floor plan, vaulted ceilings throughout, and many recent upgrades such as a new floors, reconstructed room sizes, and a new roof. Oversized kitchen with high end stainless steel appliances, island abundance of cabinetry, and eating area with skylights. Light filled great room, large dining room, and office with built ins. Luxurious primary suite with new walk in closet with upgraded storage system and outdoor access to patio. Expansive primary bathroom with double water closets, double vanity, whirlpool tub, separate shower, and laundry room. Two additional
Exquisite new construction home situated in the midst of a picturesque tree-lined street in the heart of Highland Park and makes a statement at first glance! This elegant 6 bd, 6.5 bath center entry offers 4 levels of living space, classic architectural elements with modern high-end amenities throughout. Top notch construction, thoughtful custom design interiors with finely crafted details all backed by a solid builder who delivers the best of the best time and time again. Designed and built by Preservation Restoration. Clean modern lines with a hint of playfulness all set on a rare, oversized L shaped lot. A backyard large enough for a pool, multi-sport court, home garden, and/or children'
Unparalleled setting, location and design best describe this timeless Brick, Stucco and Limestone Estate, sited on nearly an acre of park-like property in coveted East Highland Park steps from Lake Michigan. This custom built home offers a blend of luxury and comfort with incredible attention to detail and craftmanship for well known North Shore builder, as his own residence. Upon a arrival, a circular pebble and stone driveway welcome you to this exquisite home enhanced by a porte cochere and gated motor court leading to a heated 5-car Garage. World class Kitchen equipped with custom cabinetry, a marble and walnut island, Viking and Wolf appliances, Traulsen Refrigerator/Freezer, a commerc
Located in sought after south east Highland Park, just houses from Lake Michigan with street private-access beach rights. Meticulously rebuilt in 2006, designed by award-winning architectural firm Morgante-Wilson, this home was totally redesigned with the utmost attention to detail! NO STONE WAS LEFT UN-TURNED. The only room left untouched, besides its new custom windows, was the spectacular Living Room that hosts a vaulted ceiling with beams originally from a cathedral in Normandy. Professional Chef's Kitchen with custom Amish-made cabinetry, 2 oversized ovens, 6 burner cooktop, 2 dishwashers, 2 sinks, warming drawer and separate side by side 36-inch Sub-Zero refrigerator and freezer, all
Based on information submitted to the MLS GRID as of Fri Apr 26 2024. All data is obtained from various sources and may not have been verified by broker or MLS GRID. Supplied Open House Information is subject to change without notice. All information should be independently reviewed and verified for accuracy. Properties may or may not be listed by the office/agent presenting the information.
School data is provided by GreatSchools, a nonprofit organization. Redfin recommends buyers and renters use GreatSchools information and ratings as a first step, and conduct their own investigation to determine their desired schools or school districts, including by contacting and visiting the schools themselves.Redfin does not endorse or guarantee this information. School service boundaries are intended to be used as a reference only; they may change and are not guaranteed to be accurate. To verify school enrollment eligibility, contact the school district directly.
Highland Park, Illinois offers residents a variety of transportation options, including a robust public transportation system. The Metra commuter rail service provides convenient access to downtown Chicago, while Pace buses serve local routes. For those who prefer to drive, traffic levels can vary, but generally, the city experiences typical suburban congestion during peak hours. Additionally, Highland Park is conveniently located near major highways, including the Edens Expressway (I-94), providing easy access for car travel to neighboring cities and beyond. Learn more on our Highland Park city guide.
What types of properties are available in Highland Park?
Highland Park, Illinois offers a variety of single-family home types, including ranch-style, split-level, and contemporary homes, each with their own unique architectural features and designs. These homes can be found throughout the city, with many located in established neighborhoods and newer developments. Most properties in Highland Park, Illinois feature three to five bedrooms and were built in various years, providing a range of options for homebuyers. To explore different property types for sale in Highland Park, Illinois, use the 'Home type' filter located above the active listings. Customize your search by selecting options like single-family homes, condos, townhomes, and more.
What is life like in Highland Park?
Highland Park, Illinois offers a serene and picturesque living experience with its beautiful landscape, characterized by lush greenery and vibrant flora. The region experiences a pleasant climate, with distinct seasons that bring a variety of weather conditions throughout the year. The town boasts a thriving economy, providing ample job opportunities across various industries. Residents can engage in a range of recreational activities, such as exploring nature trails, participating in community events, and enjoying local entertainment options. Highland Park offers a vibrant and engaging lifestyle for its residents, with a plethora of cultural and artistic events to indulge in.
What are the schools and amenities like in Highland Park?
Highland Park, Illinois, boasts a variety of public amenities for its residents to enjoy. The city is home to several restaurants, offering a diverse range of cuisines to satisfy all tastes. Outdoor enthusiasts will appreciate the numerous parks available for leisure and recreation. For your shopping needs, Highland Park provides multiple grocery stores for convenient access to daily essentials. Additionally, the city offers other amenities such as libraries, fitness centers, and public transportation services.
In the past month, 30 homes have been sold in Highland Park. In addition to houses in Highland Park, there were also 21 condos, 5 townhouses, and 1 multi-family unit for sale in Highland Park last month. Highland Park is a minimally walkable city in Illinois with a Walk Score of 42. Highland Park is home to approximately 29,831 people and 14,393 jobs. Find your dream home in Highland Park using the tools above. Use filters to narrow your search by price, square feet, beds, and baths to find homes that fit your criteria. Our top-rated real estate agents in Highland Park are local experts and are ready to answer your questions about properties, neighborhoods, schools, and the newest listings for sale in Highland Park. Our Highland Park real estate stats and trends will give you more information about home buying and selling trends in Highland Park. If you're looking to sell your home in the Highland Park area, our listing agents can help you get the best price. Redfin is redefining real estate and the home buying process in Highland Park with industry-leading technology, full-service agents, and lower fees that provide a better value for Redfin buyers and sellers.

 REDFIN IS COMMITTED TO AND ABIDES BY THE FAIR HOUSING ACT AND EQUAL OPPORTUNITY ACT. READ REDFIN'S FAIR HOUSING POLICY AND THE NEW YORK STATE FAIR HOUSING NOTICE.
 United States
 Canada