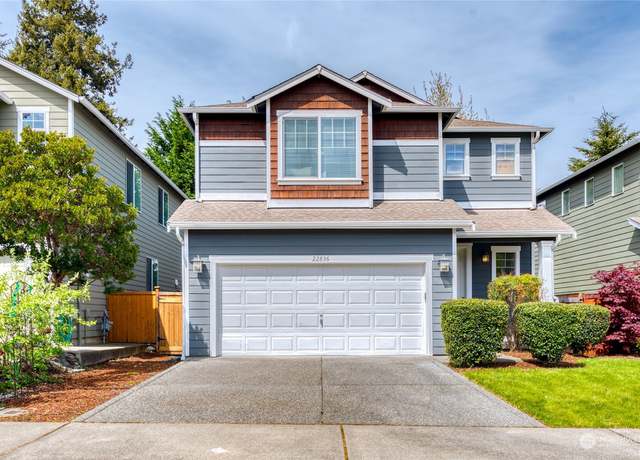
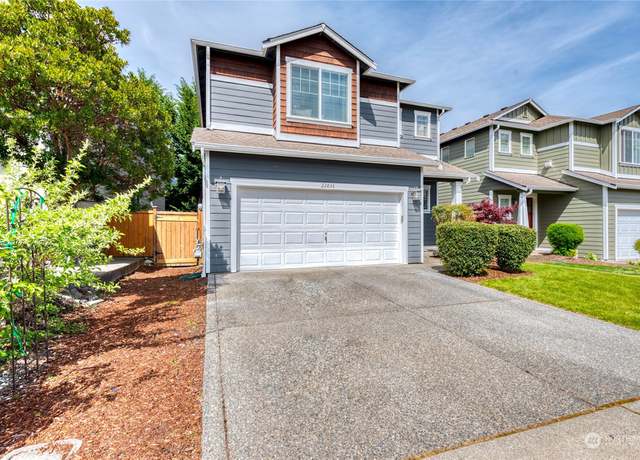
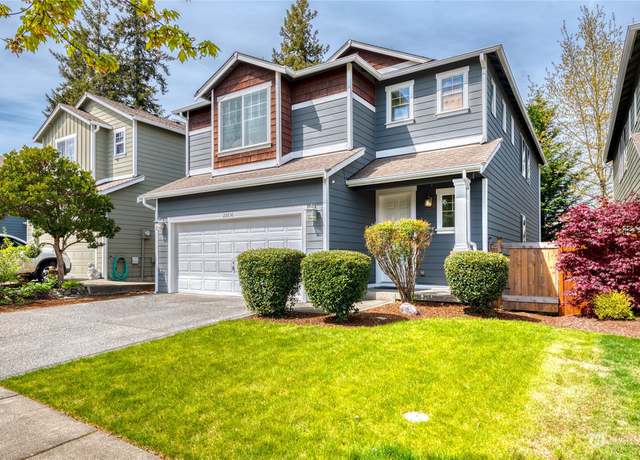
Discover the perfect blend of comfort & convenience in this turn-key remodeled home in desirable Meadows at River Creek. Space abounds in this inviting home w/ formal living & dining spaces & open concept kitchen, dining & family room. Newly updated kitchen w/ quartz counters, new stainless refrigerator, dishwasher, stove range, microwave, lighting. New stone surround fireplace. New flooring throughout, interior paint, 6-panel doors, baseboard trims, newer water heater 2022 & newer exterior paint 2020. Primary bedrm upstairs w/ en-suite 5pc bath & walk-in closet, 3 addt'l bedrms, full guest bath & expansive loft area offers much versatile use. Nestl
1/38
$825,000
4 beds2.5 baths2,630 sq ft3,800 sq ft (lot)
22836 SE 271st Pl, Maple Valley, WA 98038
Listing provided by NWMLS as Distributed by MLS Grid
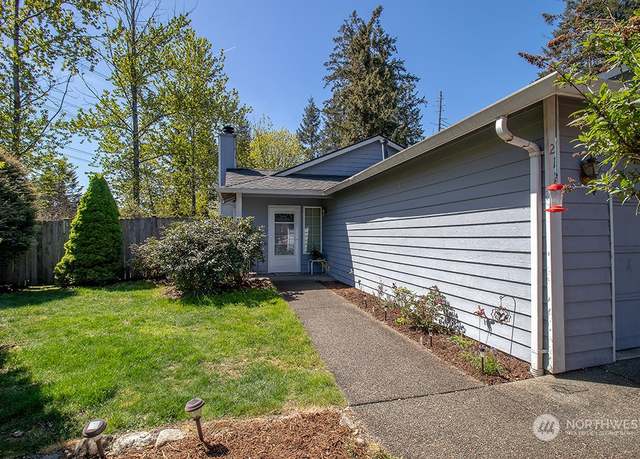
No Stairs! A rambler, in a cul-de-sac, in an established neighborhood, & Tahoma Schools. Come see this diamond in the rough! This home gives you the opportunity to move right in or do some updating to make it your own! Fruit trees in the back yard, fire pit & a back gate that leads to walking trail. A poured concrete pad for a pet kennel or ??, side yard patio, garden boxes, & overall a very private 10k+ sf lot. Home has open floorplan that allows for easy entertaining. Great room has a wood stove insert w/ slate tile surround for those cold winter nights. Laminate floors in kitchen and dining rooms. Primary bedroom has a very spacious ensuite. Water heater replaced in 2020,
1/21
$540,000
3 beds2 baths1,290 sq ft0.23 acre (lot)
21153 SE 280th Pl, Maple Valley, WA 98038
Listing provided by NWMLS as Distributed by MLS Grid
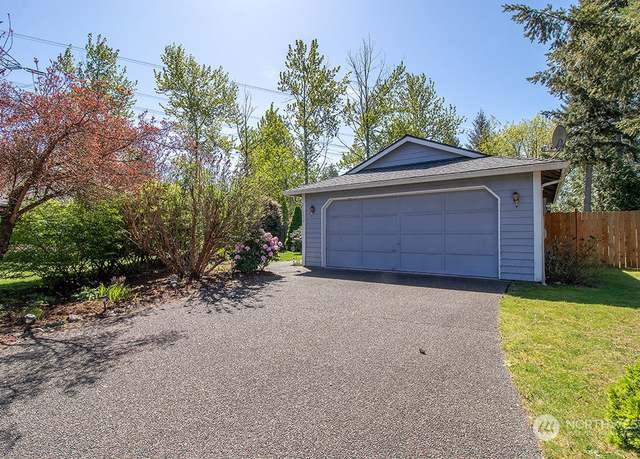
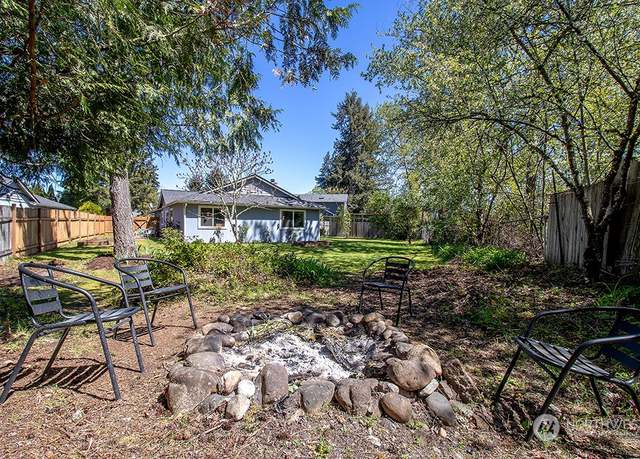
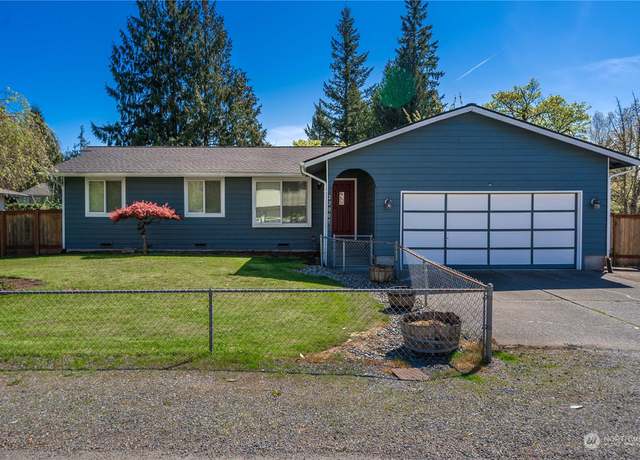
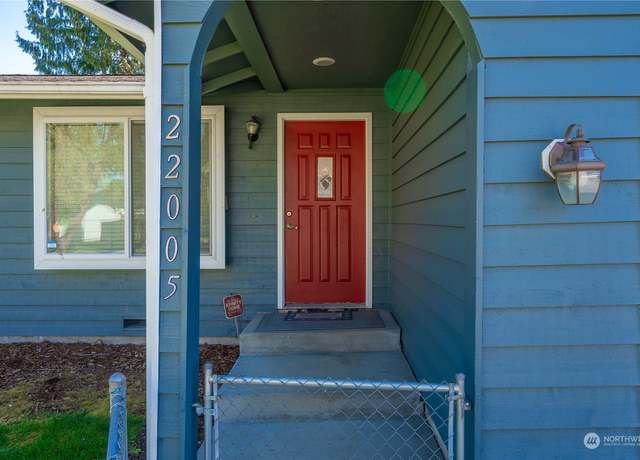
Welcome to your idyllic retreat in the highly sought-after community of Cherokee Bay! This wonderful rambler offers the perfect blend of comfort and convenience, with community water access for all your outdoor adventures. Indulge in the tranquility of suburban living while still being minutes from top-notch conveniences and delectable dining options. Meticulously maintained, this home boasts updated bathrooms and a stylish kitchen featuring granite counters and SS appliances! Discover your own private oasis outside, complete with a fully fenced yard for gardening or gatherings. Whether you're seeking a peaceful retreat or a place to entertain, this home offers it all. Don't miss your chanc
1/38
$575,000
3 beds2 baths1,180 sq ft8,500 sq ft (lot)
22005 SE 270th St, Maple Valley, WA 98038
Listing provided by NWMLS as Distributed by MLS Grid
Welcome to the newly remodeled Cherokee Bay Rambler! Step into spacious elegance with an open-concept layout boasting with natural light. The kitchen features quartz white countertops, stainless steel appliances, and a convenient eat-in island. The primary ensuite offers modern finishes, a double-sink vanity, and a spacious closet with built-in shelving. Step seamlessly into your private fully fenced-in backyard oasis through your French doors or stay cool inside with AC. Nestled in a sought-after community, enjoy exclusive access to a private lakefront, playground, 2 clubhouses, and a convenient boat launch. Your dream home awaits in this picturesque setting.
1/33
$675,000
3 beds2 baths1,504 sq ft7,500 sq ft (lot)
26616 SE 221st Ave, Maple Valley, WA 98038
Listing provided by NWMLS as Distributed by MLS Grid
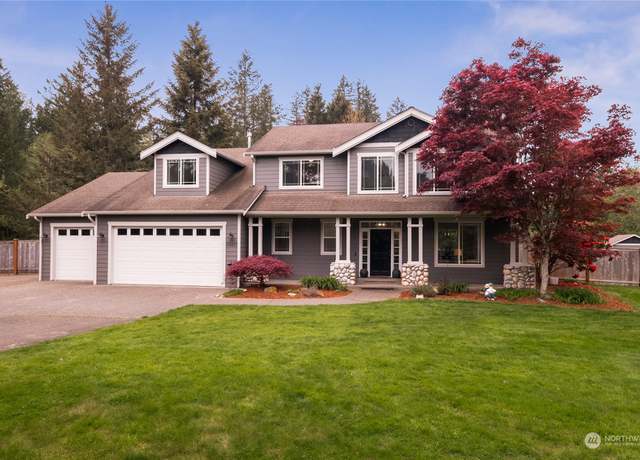
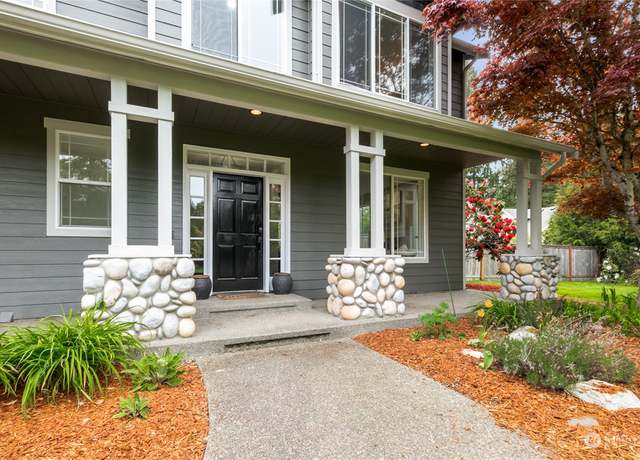
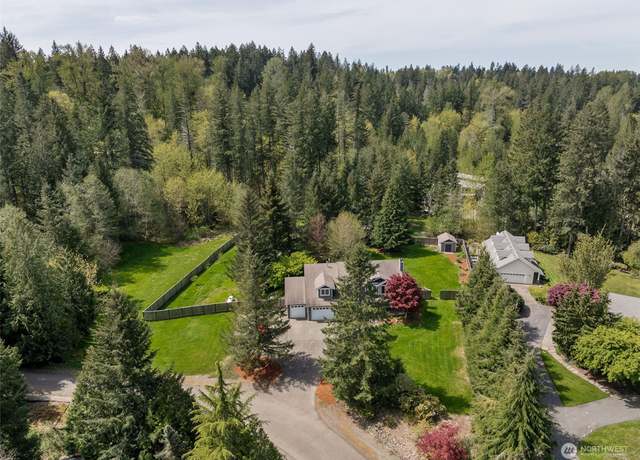
Indulge within this exquisite craftsman home, gracefully nestled in the highly sought-after River Run neighborhood. Featuring 4 bedrooms/3 baths sprawled across just over an acre, it embodies the quintessence of Pacific Northwest living, mere moments from downtown Maple Valley. Meticulously updated, featuring gleaming hardwood floors, luxurious granite countertops, a gourmet kitchen island with a dining area, and two cozy gas fireplaces. Revel in the allure of a freshly painted interior and exterior, alongside the elegance of a remodeled hall bathroom. A three-car garage offers ample space, while the expansive backyard, complete with a shed, garden, and fire pit, sets the stage for unforget
1/33
$1,349,000
4 beds3 baths3,284 sq ft1.16 acres (lot)
24827 247th Pl SE, Maple Valley, WA 98038
Listing provided by NWMLS as Distributed by MLS Grid
Welcome to this charming home in the Arbors at Rock Creek—a well-appointed home boasting 3 bedrooms, 2.5 bathrooms, and expansive open living areas. The master suite is a true retreat, highlighted by abundant natural light, a luxurious 5-piece ensuite, and a generously sized walk-in closet. The kitchen offers extensive storage and counter space, enhanced by modern stainless steel appliances. The living area is bright and welcoming, complete with a cozy fireplace. Additional features include a two-car garage, efficient air conditioning, fully fenced in yard, and a prime cul-de-sac location. Situated near excellent biking and hiking trails, within the desirable Tahoma School District, a
$759,950
3 beds2.5 baths1,820 sq ft4,200 sq ft (lot)
24227 SE 259th Ct, Maple Valley, WA 98038
Listing provided by NWMLS as Distributed by MLS Grid
This stunning Pan Abode lodge-style masterpiece boasts picturesque acreage & wrap-around deck, perfect for soaking in the natural beauty. Marvel at the two-story design with an unfinished daylight basement- limitless possibilities. The heart of this home is the impressive two-story great room, featuring a Tulikivi soapstone fireplace that adds warmth & character. The kitchen is a chef's delight- Viking gas range, Miele dishwasher & stone counters. Two main floor beds & full bath. Upstairs, the primary suite will impress-vaulted ceiling & spa-like bath, shower, jetted soaking tub, and sauna ready! Bonus room opens to a newer Duradex balcony. Other benefits inclu
$1,099,950
3 beds2 baths3,840 sq ft2.29 acres (lot)
18608 259th Ave SE, Maple Valley, WA 98038
Listing provided by NWMLS as Distributed by MLS Grid
Nestled in the heart of Maple Valley, this home offers the perfect blend of comfort & functionality. Situated on a quiet street, boasting 3 beds & 2.5 baths w/ new LVP floors on the main, new carpets upstairs & fresh interior paint throughout. Step inside to soaring ceilings, open floor plan & tons of natural light. Upstairs offers a spacious primary w/ full bath en suite & W/ I closet, plus 2 guest beds & full guest bath. Take in those summer days on your back patio or enjoying the lush yard. True peace of mind here w/ new furnace & AC, new roof w/ 50 yr warranty, new water heater, new insulated garage door, & various other upgrades throughout
$675,000
3 beds2.5 baths1,740 sq ft4,549 sq ft (lot)
28119 225th Pl SE, Maple Valley, WA 98038
Listing provided by NWMLS as Distributed by MLS Grid
3 year old beautiful home w/ over $100,000 in upgrades! This 4 bed, 2.5 bath has a wonderful layout w/ a bed & 3/4 bath on the main level & loft upstairs w/ so many possibilities! The 9ft ceilings on both levels & large windows let in so much natural light! Spacious kitchen features quartz counters, large island, ample storage and gas cook top. The great room is open to the large living room with beautiful stone gas fireplace and large dining room that opens to the yard. Upstairs are 3 more bedrooms including the huge primary suite w/ dual sinks, soaking tub, walk-in shower & huge closet. Newly landscaped yard w/ turf in the backyard for ease, permanent house lights,
$1,049,950
4 beds3 baths2,620 sq ft4,207 sq ft (lot)
23548 SE 271st Pl, Maple Valley, WA 98038
Listing provided by NWMLS as Distributed by MLS Grid
So much charm in this wonderful farmhouse on 2.5 acres perched on a hill, offering captivating views of Mount Rainier. Experience country living while enjoying all the suburban conveniences. This generous 5-bed, 3 bath home blends old-world accents with modern comforts. Cozy family room w/ fireplace off the kitchen with all new appliances. Large laundry room/pantry has built in BBQ and opens up to back patio. Spacious living rm w/ fireplace and wood floors off dining rm. Primary rm w/ bathroom and walk-in closet, located on the main flr in addition to 2 bdrms and full bath. Upstairs has two bdrm's, one spacious enough to be a large bonus rm and opens onto a rooftop deck. 3 car garage with g
$825,000
5 beds2.5 baths2,440 sq ft2.51 acres (lot)
22059 SE 188th St, Maple Valley, WA 98038
Listing provided by NWMLS as Distributed by MLS Grid
Ever get the feeling these flashy, modern builds come off excessive and lack character? If so, we have a refreshing opportunity for you. This distinct gem speaks tradition, caliber and purpose. The home stands tall and stoic above a picturesque, estate-like setting surrounded by landscape architecture that would make Picasso proud! This is a multigenerational home that can handle a party! MIL and Master each on their own levels allowing for privacy even with a home full of guests! Pride of ownership has its fingerprints firmly pressed into the heart and soul of this property. Versatile, 5 acres perfect for a hobby farm or home business. Priced below appraisal for fair and painless sale. Pre
$1,695,000
5 beds3.5 baths5,010 sq ft5.00 acres (lot)
20330 237th Ave SE, Maple Valley, WA 98038
Listing provided by NWMLS as Distributed by MLS Grid
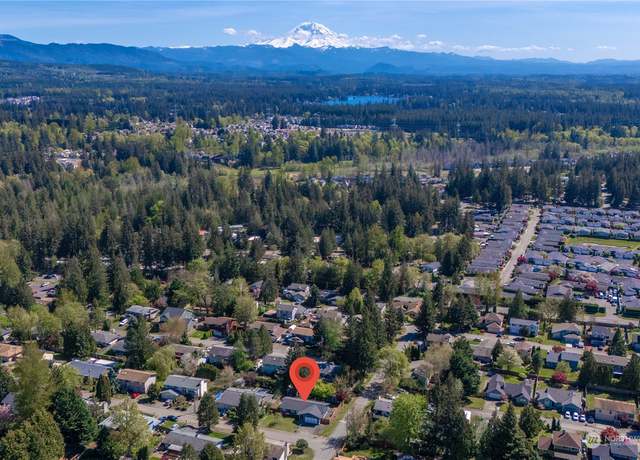
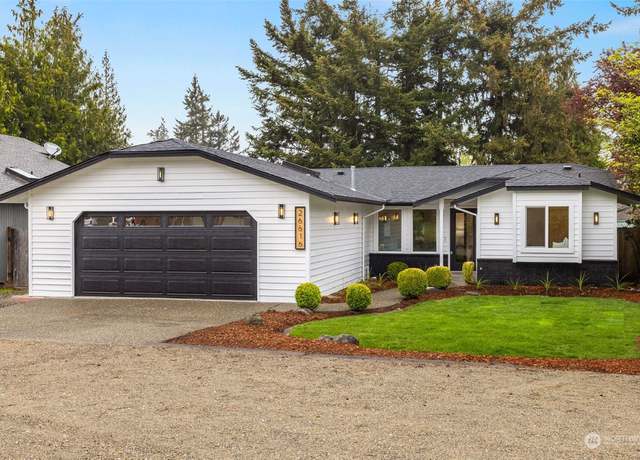
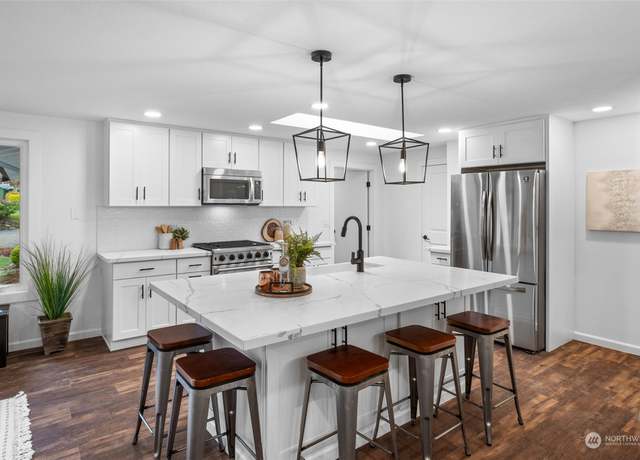
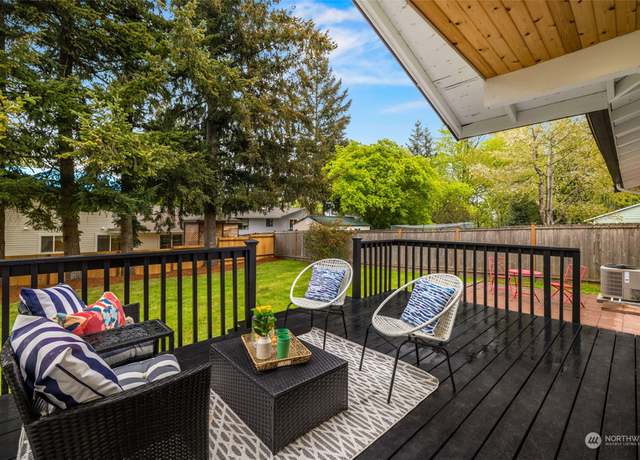
Charming private & magical 40-foot beachfront cabin nestled in nature, only mins from Maple Valley's town center. The perfect cozy & Zen primary residence, or the ideal rental opportunity. Seller spared no expense w/ gorgeous renovations, systems & upgrades. Efficiently designed & meticulously crafted to maximize space thru-out the home & yard, while maintaining its original unique charm. Enjoy the detachable floating dock parties with the neighbors (use the electric motor or just paddle), serene walks around Lake Wilderness Park, take the Gnome Trail to the Maple Valley Farmer's Market on a sunny Sat. morning. Walk or bike the Cedar to Green River Trail into t
$875,000
1 bed1.5 baths722 sq ft3,521 sq ft (lot)
25615 E Lake Wilderness Dr SE, Maple Valley, WA 98038
Listing provided by NWMLS as Distributed by MLS Grid
Auction Property - This property is part of an online bidding event. Inspections of this property and contact with occupants are strictly prohibited. Property access is not permitted. There has been no inspection of the interior of this home so all information in this listing is from King County Assessor or previous listings and is not verified.
$665,000
3 beds1.5 baths1,530 sq ft4.34 acres (lot)
26004 SE 200th St, Maple Valley, WA 98038
Listing provided by NWMLS as Distributed by MLS Grid
Adjacent to a lush greenbelt, Cedar-to-Green River Trail and just a 3 min stroll to Summit Park, this remarkable barn red beauty awaits. Pride of ownership is evident. Enjoy extensive hardwood flooring throughout the entire home, custom 7" base trim throughout upper floor, new paint, new 50yr roof, air conditioning, irrigation system & more. Tastefully updated kitchen w/ quartz & granite counters, new hardware and stainless steel appliances incl new dishwasher & gas range. 5 generous bedrooms incl master suite w/ vaulted ceilings, 5pc bath & dual walk-in closets. Sizable covered outdoor living space w/ privacy screens and newer 6-person hot tub. Minutes to shops
$943,900
5 beds2.5 baths2,690 sq ft4,370 sq ft (lot)
24035 SE 277th Pl, Maple Valley, WA 98038
Listing provided by NWMLS as Distributed by MLS Grid
This meticulously crafted, 6,760SF estate rests on nearly 2 acres. Amazing “work from home” option w/ 1 GB high speed internet & two offices. Possible home schooling setup in the upper lvl bonus rm. Grand entry w/ a sweeping staircase. 4 beds, 2 bonus rms, 2 den/office spaces, & more, this home offers versatile living. Impressive living rm w/ fireplace & French doors to the view deck. Gourmet kitchen w/ granite countertops, dbl ovens, & butler’s pantry. Retreat to the primary bdrm w/ luxurious bath featuring radiant floor heating. Entertainment options incl a theatre rm & wet bar. Outside, relax on the covered patio w/ an outdoor fireplace &
$2,198,000
4 beds5 baths6,760 sq ft1.89 acres (lot)
25935 SE 235th Way, Maple Valley, WA 98038
Listing provided by NWMLS as Distributed by MLS Grid
This luxurious real estate gem features 4 spacious bed(primary on main), 3.25 elegant bat. Large office spaces, a dedicated movie room for entertainment enthusiasts, open kitchen & living room, three-car garage, & much more . The property offers a picturesque view of Mt. Rainier & features a sports court for active living. Custom furniture pieces seamlessly integrate with the house, enhancing its charm. The meticulously designed prestige landscaping, complete w/ tasteful lighting, adds to the property's curb appeal. All-new appliances ensure modern convenience for the lucky homeowners. Beautiful refinished hardwood flooring. New decking, AC, and furnace, and carpet. This re
$1,798,000
4 beds4 baths4,700 sq ft0.86 acre (lot)
22416 236th Ave SE, Maple Valley, WA 98038
Listing provided by NWMLS as Distributed by MLS Grid
New construction offers the epitome of modern elegance with meticulously curated designer finishes within Tahoma Schools. On 1 acre, this home is filled with upgrades including designer lighting, dual zone heat/ac, custom built-ins, and hand placed stone facades. The gourmet kitchen w/ butler pantry is a chef’s delight w/ custom cabinets, quartzite counters and high-end appliances. The 5th bedroom on the main floor is perfect as an office or primary w/ hall bath that has a hotel-like atmosphere. Retreat to the primary suite w/ large walk-in closet and an ensuite 5-piece bathroom w/ luxurious heated floors for added comfort. A fully finished detached heated garage offers ample space fo
$1,750,800
5 beds3 baths3,564 sq ft1.00 acre (lot)
21050 254th Pl SE, Maple Valley, WA 98038
Listing provided by NWMLS as Distributed by MLS Grid
This property is for you! Beauty surrounds you on these gorgeous 3.66 acres. Complete remodeled new windows, brand new very beautiful kitchen cherry good cabinets and stone counter tops with heated floors to keep you warm while cooking stainless steel appliances, and lighting all done by a professional contractor 3 bed 2 bath upper level another bed and laundry area downstairs. The property owner is a marble and granite contractor and use the 40X60 barn/shop as his place Inca Marble and Granite and is selling the business attached to this property on a separate listing, great opportunity to live and work. Perfect for equestrian or mechanic's dream. There is PLENTY of parking and a spot for
$1,299,000
4 beds2.5 baths2,420 sq ft3.66 acres (lot)
21808 244th Ave SE, Maple Valley, WA 98038
Listing provided by NWMLS as Distributed by MLS Grid
Nestled in the heart of Maple Valley, this charming 3 bedroom, 2.5 bathroom home offers a blend of modern comfort and serene surroundings. Step inside to find custom bamboo floors and an updated kitchen with newer cabinets, quartz countertops, and stainless steel appliances. Enjoy the tranquility and privacy of the fully fenced backyard that backs up to City of Maple Valley property that includes a trail leading to Lake Wilderness. Walk the trail or enjoy a neighborhood park with picnic and play areas inside the community. With new exterior paint and proximity to shopping, parks, and the Maple Valley schools, this home provides the perfect balance of convenience and peaceful living. Don't m
$715,000
3 beds2.5 baths1,609 sq ft3,788 sq ft (lot)
22436 SE 243rd St, Maple Valley, WA 98038
Listing provided by NWMLS as Distributed by MLS Grid
Discover serenity at this beautiful house in Maple Valley. This house boasts luxurious finishes, spacious interiors, and scenic views. With a gourmet kitchen, serene master suite, and lush outdoor space, this home epitomizes modern comfort and elegance. This property boasts a 3.2 acre land big enough to create your own race track. Plenty of outdoor space to park your RV, trucks, and trailers. Complete remodel in 2024 with high end modern finishes. $10,000 seller credit if closing by end of May. Home comes with a 12 month Home Warranty. Don't miss out, make this your sanctuary today!
$594,500
3 beds2 baths1,336 sq ft3.26 acres (lot)
28724 236th Ave SE, Maple Valley, WA 98038
Listing provided by NWMLS as Distributed by MLS Grid
Starry, starry night. Magnificent custom log home is ideally situated on 2.5 acres of heaven with towering Tiger Mtn streams of sunshine and acres of forestland in your sights. Rustic refinement transports you into an idyllic world of nature away from city lights. Blank slate awaits your dreams: equestrian, chickens, veggies, vehicles, pets. Enduring craftsmanship:15-in. Englemann Spruce logs; copper plumbing; htd 3-car gar/shop, 1/2 bath, upper studio-in-waiting. Crowd pleasing granite, cherry, Bosch, SubZero, porcelain, skylights. BSMT gallery has wet bar, cozy stove, 75 bottle wine cellar: flex space(storage/crafts/fitness) room sized secure vault has BI storage & safe, High countr
$1,500,000
3 beds2.5 baths4,752 sq ft2.52 acres (lot)
36836 SE 191st, Maple Valley, WA 98038
Listing provided by NWMLS as Distributed by MLS Grid
Your own private retreat on Lake Wilderness. 80ft. of waterfront on a large 13,068 SF level lot. Approved permit and plans for a 3000+ SF One Story Home w/ an above garage ADU. Build a gorgeous home or explore your options for keeping the current structure. So many possibilities. Great location with nearby walking and bike trails; Within walking distance to Lake Wilderness Park, baseball fields, public swimming beach, and boat launch. Listed as vacant- MLS #2202709
$1,195,000
3 beds1 bath1,090 sq ft0.30 acre (lot)
25732 W Lake Wilderness Dr SE, Maple Valley, WA 98038
Listing provided by NWMLS as Distributed by MLS Grid
BEAUTIFUL MODERN HOME on private 5 acre park-like setting. Almost 4800 sqft. Living room with 20 ft ceilings allowing abundance of natural light. Chefs dream kitchen with 12 ft Island and high end appliance Sub Zero refrigerator and Thermidor gas stove. Oversize family room for entertaining. Primary bedroom with large walk in closet and balcony, bath. 3 separate ADU'S - (3 bds, 2 bath house, 2 bds 1 bath house, 1 studio and 2 RV pads with hook ups make this a great investment property for rental income, Airbnb or extended family, Current rentals produce $14,000 Main house has new metal roof, new windows, new appliances, flooring, kitchen, driveway
$2,000,000
4 beds3.5 baths4,730 sq ft4.94 acres (lot)
Undisclosed address, Maple Valley, WA 98038
Listing provided by NWMLS as Distributed by MLS Grid
Updated 2 bed/2 bath home in Maple Valley in the Tahoma School District! Big living and dining areas with lots of built in's for storage and 2 large bedrooms, the primary with it's own bathroom and door that leads to back deck. Newer windows, roof, plumbing, and cement skirting. Ductless heating and cooling recently added as well. Lots of extra space on this large lot including a deck, spacious covered sunroom and oversized 2 car garage/shop. Private cul-de-sac in quiet neighborhood, be sure to check this one out!
$344,900
2 beds2 baths1,440 sq ft9,338 sq ft (lot)
27508 220th Pl SE, Maple Valley, WA 98038
Listing provided by NWMLS as Distributed by MLS Grid
Welcome home to this stunning, like new, 5 bedroom 2.75 bath home in Maple Valley. Save on energy with the recently installed solar panels. Convenient main floor bedroom with . 75 bathroom off of it. Very open concept gourmet kitchen complete with oversized quartz island, elevated SS hood and cooktop. Upper level has 4 generous rooms including a large bonus room. High end closet factory closets installed in all of the walk-ins. The generous primary suite comes complete with 5 piece ensuite bathroom and large walk-in closet. Great sized backyard that backs up to acreage property. A/C and sprinkler system. Award winning Tahoma school district. Close to shopping, restaurants and more.
$999,950
5 beds3 baths3,080 sq ft4,891 sq ft (lot)
27827 219th Pl SE, Maple Valley, WA 98038
Listing provided by NWMLS as Distributed by MLS Grid
PRICE REDUCED!! Nestled in lush woods, this tranquil home, set 200+ft back for privacy, features a 30" concrete crawl space for durability. The 40x60 garage/shop with a 20x40 2nd floor office is perfect for car enthusiasts or home business. RV parking, in & outdoors, w/ outlets for convenience. Inside, a well-maintained living space boasts a 2021 furnace & A/C for comfort. The workout room includes a pool, treadmill & 3/4 bath. Entertain in the living room w/ a cozy wood stove. The kitchen offers a walk-in pantry & large windows connecting you to nature. Discover luxury, functionality, and seclusion in this extraordinary gem. Your dream home awaits, where every
$950,000
3 beds3 baths3,120 sq ft2.03 acres (lot)
20304 SE 248th St, Maple Valley, WA 98038
Listing provided by NWMLS as Distributed by MLS Grid
Welcome to resale Westcott Homes in Elk Run Golf Course community. This property boasts an X-Large, flat, fenced BACKYARD that backs to open space, providing a serene and private outdoor oasis. Step inside to experience the very latest in products and NEW functional open floor plan, designed to elevate your lifestyle 4 bedrooms & 2.5 baths. Enjoy the seamless transition from indoor to outdoor living with COVERED OUTDOOR living areas featuring a see-through fireplace, perfect for year-round entertainment. The kitchen is a chef's dream, adorned with Quartz counters and a 5 burner gas stove! The price includes desirable features such as Keyless entry, TANKLESS W/ HEATER, garage door open
$999,800
4 beds2.5 baths2,520 sq ft5,209 sq ft (lot)
27481 226th Ave SE, Maple Valley, WA 98038
Listing provided by NWMLS as Distributed by MLS Grid
Maple Valley 3 Beautiful level acres offers privacy and seclusion yet just minutes away from shopping, entertainment and the award winning Tahoma School district. Private well and power on the property a two car garage, your own private pond. Build your dream home or park your tiny home. Walk out your door to take a walk/ride on the Cedar River trails, or take a stroll down to the Cedar River and relax. Easy access to Hwy 169 and HWY 18. Buyer to verify all information to their satisfaction. Dumpster on property will be removed shortly.
$475,000
— beds— baths2.98 acres (lot)
20628 223 Pl SE, Maple Valley, WA 98038
Listing provided by NWMLS as Distributed by MLS Grid
Welcome to a canvas of opportunity on this expansive 4.87 acre lot, where possibilities are as vast as the surrounding landscape. Nestled in a serene setting while still having easy access to freeways and local amenities, this parcel of land offers the ideal blank canvas for your dream home. Enjoy the convenience of a majority of the work being done for you with well already installed, septic & home design plans submitted, geo/topo & CAD studies done. With house plans already in place, your vision is one step closer to reality. Let your imagination soar as you explore the potential of this remarkable parcel, where every detail has been meticulously considered to streamline your
$465,000
— beds— baths4.87 acres (lot)
20109 SE Petrovitsky Rd, Maple Valley, WA 98038
Listing provided by NWMLS as Distributed by MLS Grid
Unlock the potential of this 5-acre canvas! Preliminary work done: site plan, boundary clearing, and building survey. Perc test and some clearing completed. Your dream home or investment is within reach with a seamless path to realization. Seller explored lumber potential ($100K+ estimate), no timber survey. Embrace endless possibilities in this pristine space. Seize the opportunity – the groundwork is laid
$499,990
— beds— baths5.08 acres (lot)
27577 207th Ave SE, Maple Valley, WA 98038
Listing provided by NWMLS as Distributed by MLS Grid
Alluring nearly 5 acres of land nestled in the corner near opulent million-dollar residences. Remarkable potential to build your dream home. Currently has RV hookup complete with power & water connections. Imagine the bliss of residing here while building! Natures splendors abound with trees that flourish beauty, but also provide bonus value in lumber. Lumber that has already been converted valued at $8k convey with property. Multiple cleared and flat areas to build DADU, a shop, or patio. A seasonal pond brings life to the acreage and more serene aesthetics. A modern well installed in 2021, 20-year pump increases the value of this parcel. Embrace the opportunity to construct your dre
$725,000
— beds— baths4.91 acres (lot)
20085 230th Ave SE, Maple Valley, WA 98038
Listing provided by NWMLS as Distributed by MLS Grid
Exceptional and private 2-acre home site in the peaceful seclusion of Maple Valley. Tucked away in a tranquil forest setting, this hidden gem provides an exclusive escape from the city, yet remains conveniently close to shopping, dining, and scenic trails. This pristine canvas is perfect for your custom dream home, with the added convenience of a shared well on-site and utilities easily accessible via Maple Valley Black Diamond Road. Tahoma School District! Per fire marshal, 3600 sq ft of living space and garage space combined allowed.
$299,950
— beds— baths2.07 acres (lot)
28041 243rd Ave SE, Maple Valley, WA 98038
Listing provided by NWMLS as Distributed by MLS Grid
This property is ready to build! Tahoma Schools! All designs & permits have been approved by King County. Property is wooded on the back half, has a seasonal creek & a beautiful Maple just outside the building area. Located near the end of a dead-end street & has no neighbors front or back. Established neighbors on either side of the property in a very quiet area. Approved 2521 SqFt 3 Bedroom 4.5 Bath Home w/ 720 SqFt 12’ high & potential loft Garage. Additional 322 SqFt of covered walkway. Home features 3 Bedrooms, Entry, Living Room, Dining Room, Kitchen, Laundry, Den, Upstairs Family room & 4th Bath designed as a Spa. Second Story deck can potentially
$350,000
— beds— baths2.45 acres (lot)
26360 SE 220th St, Maple Valley, WA 98038
Listing provided by NWMLS as Distributed by MLS Grid
Elk Heights Excavation permitted-active 24 Acre Quarry Mine located nearest to Hwy-18 & I-90 of all King County Sand & Gravel Pits. Profitable existing business for several types of material sales. YTD 2023 Sales of nearly $700,000. Approximately 250,000 yrds to be mined and approximately 400,000 yrds of refill reclamation material to be accepted after excavation completed. 2024 pricing sheet available for all mine materials. Onsite Power, Scale House & Truck Scale facility incl in sale. Once reclamation of existing mine has occurred, a residential redevelopment of the 24 acre site can occur. Potential of 20+ one ac lots possible. Paved county maintained road to site, exce
$2,750,000
— beds— baths23.69 acres (lot)
22606 SE Lake Francis Rd, Maple Valley, WA 98038
Listing provided by NWMLS as Distributed by MLS Grid
Welcome to a breathtaking sanctuary of natural beauty and endless possibilities. Nestled within a sprawling 9-acre expanse of raw, vacant land, this remarkable property offers a truly rare opportunity to create your own slice of paradise. Whether you dream of building a private estate, establishing a retreat, or embarking on a lucrative development venture, this untouched canvas presents unmatched potential. Buyer to verify all information to their own satisfaction. Feel free to view the property as you wish but entering the property automatically means you agree to hold seller harmless. Enter at your own risk. See driving directions. Sign will be installed Monday!
$370,000
— beds— baths9.09 acres (lot)
2 xxxx SE 188th, Maple Valley, WA 98038
Listing provided by NWMLS as Distributed by MLS Grid
Hobart area. 4.83 acres between Maple Valley and Issaquah, close to Hwy 18. Outstanding building site (private and secluded) for your custom home or man home. Wetland study (expired), CAD letter from King County (expired), survey done previously, paved road, perk feasibility done previously on west end - soils look good. Power and phone in road, buyer to drill well for water. Home will be on the back side (west) away from the road. Buyer to build driveway and cross wetland/stream. Perfect lot for dirt contractor. South line flagged previously--flagging should still be there. Take machete or hedge trimmer to get through bushes. Seller may finance with large down.
$149,000
— beds— baths4.83 acres (lot)
206 XX 235th Ave SE, Maple Valley, WA 98038
Listing provided by NWMLS as Distributed by MLS Grid
Incredible opportunity to own stunning land in Cedar River Valley! Completed Critical Area Designation survey by county. Spacious 30,390 sq. ft rectangular lot awaits your dream home. Convenient access to electricity and water, previously connected to shared well. Highly acclaimed Tahoma schools nearby. Quick access to shopping, dining, amenities, Hwy 18 & 169. Don't miss this chance to make your dreams a reality!
$200,000
— beds— baths0.70 acre (lot)
22728 Upper Dorre Don Way SE, Maple Valley, WA 98038
Listing provided by NWMLS as Distributed by MLS Grid
Come build your dream home with room for an additional dwelling on this prime 7.42 acre lot. This property is primarily level. Zoned R5. Lots of timber. Located at the end of a private road to enjoy your own peaceful retreat. Wonderful Tahoma school district. Many multimillion-dollar homes in the area. Minutes from shopping, recreation and major highways. Country living yet just minutes from city amenities. You will find at the end of SE 210th St, septic area and 30ft easement are flagged with orange markers. Walk property at your own risk. Buyer to verify all info to their own satisfaction.
$725,000
— beds— baths7.42 acres (lot)
0 Vacant Land, Maple Valley, WA 98038
Listing provided by NWMLS as Distributed by MLS Grid
Based on information submitted to the MLS GRID as of Fri Apr 26 2024. All data is obtained from various sources and may not have been verified by broker or MLS GRID. Supplied Open House Information is subject to change without notice. All information should be independently reviewed and verified for accuracy. Properties may or may not be listed by the office/agent presenting the information. Some IDX listings have been excluded from this website.
School data is provided by GreatSchools, a nonprofit organization. Redfin recommends buyers and renters use GreatSchools information and ratings as a first step, and conduct their own investigation to determine their desired schools or school districts, including by contacting and visiting the schools themselves.Redfin does not endorse or guarantee this information. School service boundaries are intended to be used as a reference only; they may change and are not guaranteed to be accurate. To verify school enrollment eligibility, contact the school district directly.
Maple Valley, Washington, is well-served by a network of local roads and highways, making car travel convenient for residents. The city is located near major highways such as State Route 169, State Route 516, and Interstate 405, providing easy access to surrounding areas. Traffic levels can vary, but generally, driving in Maple Valley is relatively smooth with peak hours experiencing moderate congestion. For those preferring public transportation, King County Metro Transit offers bus services in and around Maple Valley. Learn more on our Maple Valley city guide.
What types of properties are available in Maple Valley?
Maple Valley, Washington offers a variety of single-family home types, including ranch-style homes, split-level homes, and contemporary homes. These homes can be found throughout the city, with many located in established neighborhoods and newer developments. Most properties in Maple Valley feature three to five bedrooms and were built within the last 20 years. To explore different property types for sale in Maple Valley, Washington, use the 'Home type' filter located above the active listings. Customize your search by selecting options like single-family homes, condos, townhomes, and more.
What is life like in Maple Valley?
Maple Valley, Washington offers a serene living experience with its picturesque landscape. The region boasts a diverse range of outdoor activities, from hiking trails to pristine lakes, providing ample opportunities for exploration. The weather in Maple Valley offers a pleasant mix of seasons, with mild summers and moderate winters. The town also presents a range of job opportunities, with a growing local economy and proximity to major employment hubs. Residents can enjoy a vibrant community with various entertainment options, including local festivals and recreational facilities.
What are the schools and amenities like in Maple Valley?
Maple Valley, Washington offers a variety of public amenities to its residents. You can find a range of restaurants offering diverse cuisine options. The city is home to several parks, providing ample space for outdoor leisure and recreation. Grocery stores are also available, ensuring easy access to daily necessities. Moreover, Maple Valley boasts more amenities such as schools, libraries, and fitness centers, all contributing to a comfortable and convenient lifestyle.
In the past month, 28 homes have been sold in Maple Valley. In addition to houses in Maple Valley, there were also 3 condos, 2 townhouses, and 0 multi-family units for sale in Maple Valley last month. Maple Valley is a not walkable city in King County with a Walk Score of 24. Maple Valley is home to approximately 21,738 people and 2,256 jobs. Find your dream home in Maple Valley using the tools above. Use filters to narrow your search by price, square feet, beds, and baths to find homes that fit your criteria. Our top-rated real estate agents in Maple Valley are local experts and are ready to answer your questions about properties, neighborhoods, schools, and the newest listings for sale in Maple Valley. Our Maple Valley real estate stats and trends will give you more information about home buying and selling trends in Maple Valley. If you're looking to sell your home in the Maple Valley area, our listing agents can help you get the best price. Redfin is redefining real estate and the home buying process in Maple Valley with industry-leading technology, full-service agents, and lower fees that provide a better value for Redfin buyers and sellers.

 REDFIN IS COMMITTED TO AND ABIDES BY THE FAIR HOUSING ACT AND EQUAL OPPORTUNITY ACT. READ REDFIN'S FAIR HOUSING POLICY AND THE NEW YORK STATE FAIR HOUSING NOTICE.
 United States
 Canada