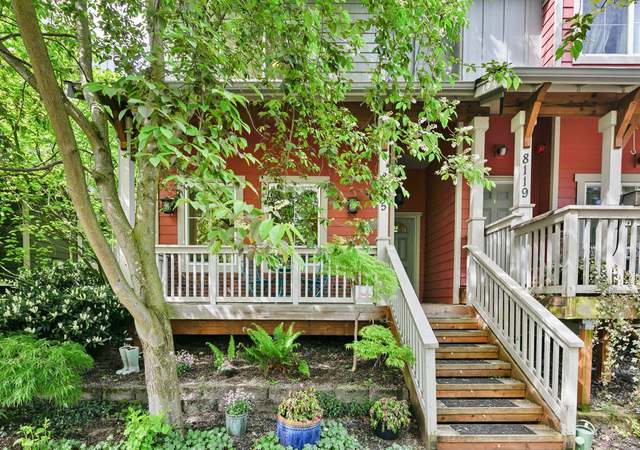
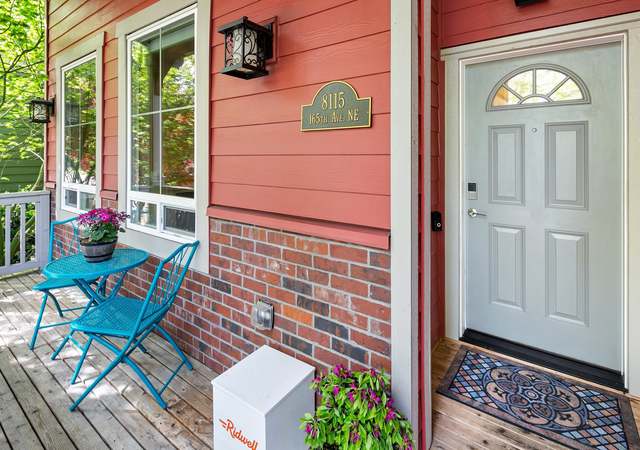
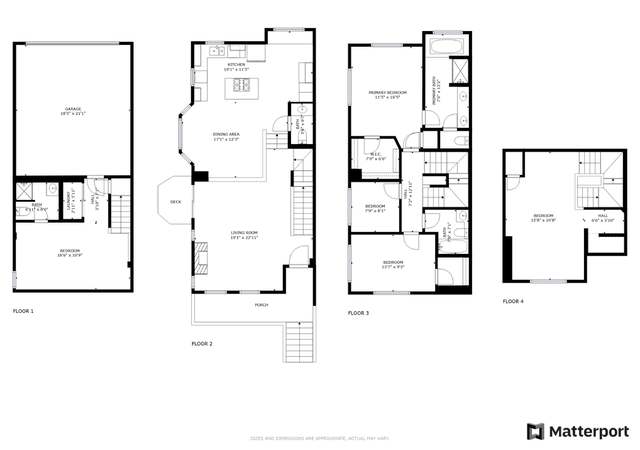
Fabulous downtown Redmond - no car needed for shopping, restaurants, library, entertainment, parks and more! This stunning townhome has 4 amazing levels with soaring ceiling heights! Main level living room features huge windows and a slider bringing in tons of natural light complete with a gas fireplace and opens to a gorgeous chef's kitchen. Corian countertops, beautiful cherry cabinetry, gas cooktop island and bamboo flooring. Relax in the spacious private primary with walk-in closet, 5 pc ensuite complete with soaking tub. Super spacious loft and lower level with endless options. Private garage, quiet street and wow location!
1/40
$1,350,000
3 beds3.5 baths2,180 sq ft1,763 sq ft (lot)
8115 165th Ave NE, Redmond, WA 98052
Listing provided by NWMLS as Distributed by MLS Grid
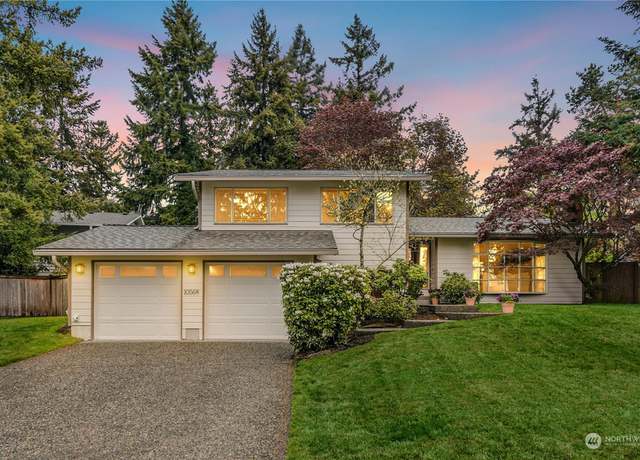
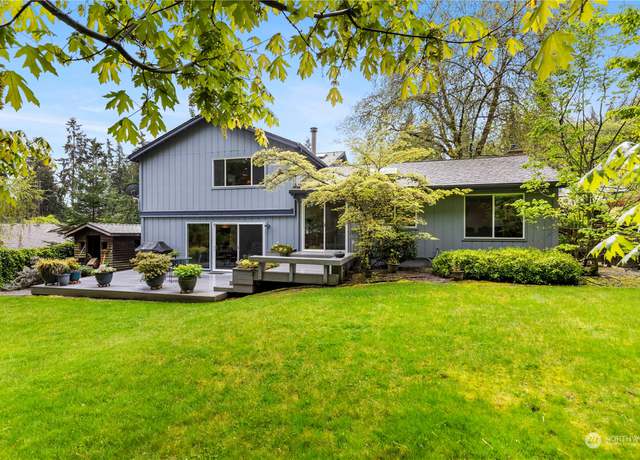
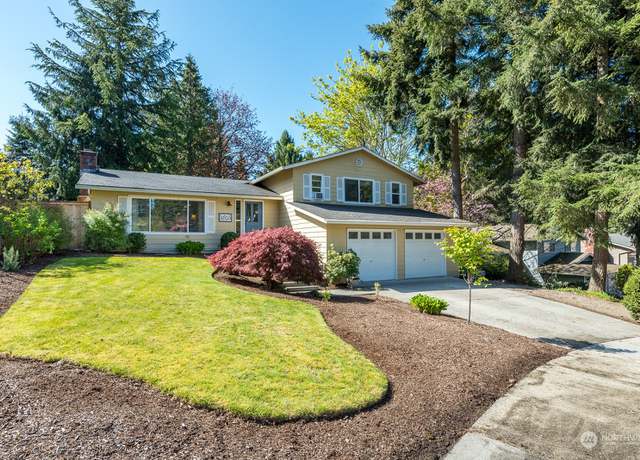
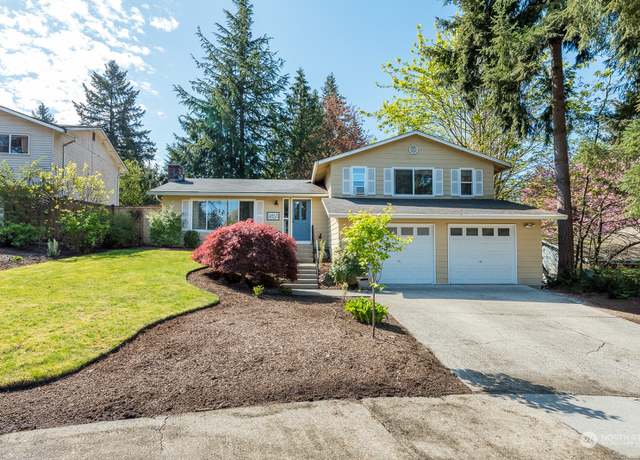
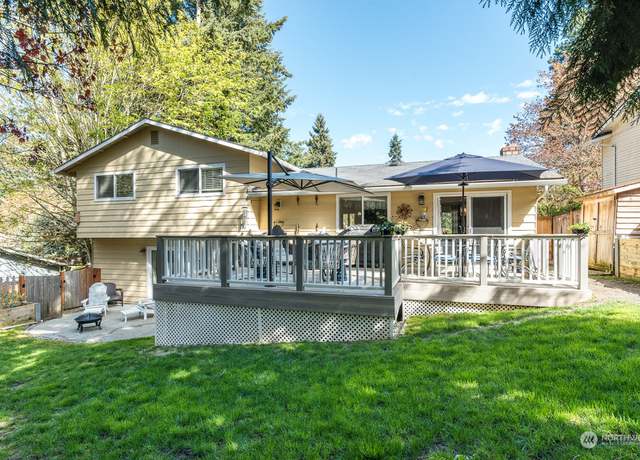
A Tri-level updated to perfection, offering a seamless blend of modern luxury & timeless charm. A gourmet kitchen; granite, stainless & custom cabinetry. A chef's delight & the heart of the home for culinary adventures/gatherings. Entertain with ease in the spacious dining area then retreat to the cozy living rm, where a gas fireplace provides warmth & ambiance. Serene, primary suite-private sanctuary with a lux ensuite & a custom closet. Descend to the lower level & find a versatile bonus rm, the perfect space for a home office, media, or play area plus a utility rm, full bath & bdrm. Backyard oasis, lush lawn & a big shed. Enjoy outdoor dini
1/34
$1,298,000
4 beds3 baths1,900 sq ft7,658 sq ft (lot)
10568 158th Ave NE, Redmond, WA 98052
Listing provided by NWMLS as Distributed by MLS Grid
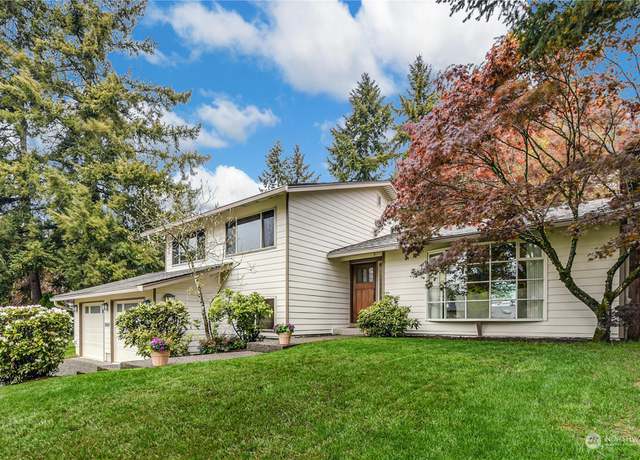
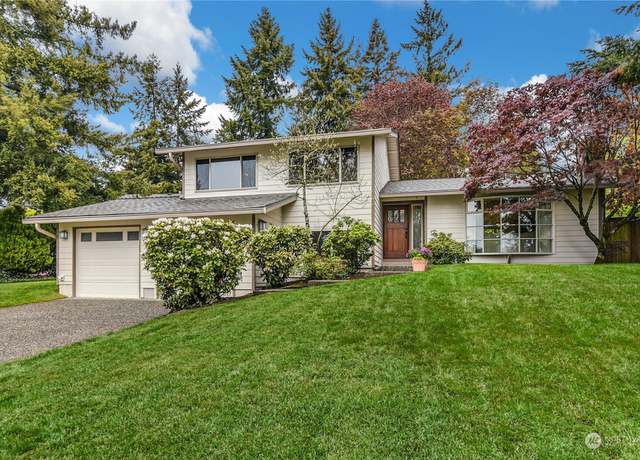
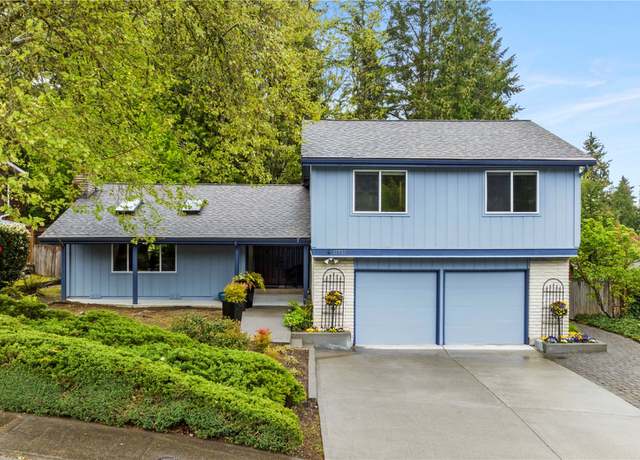
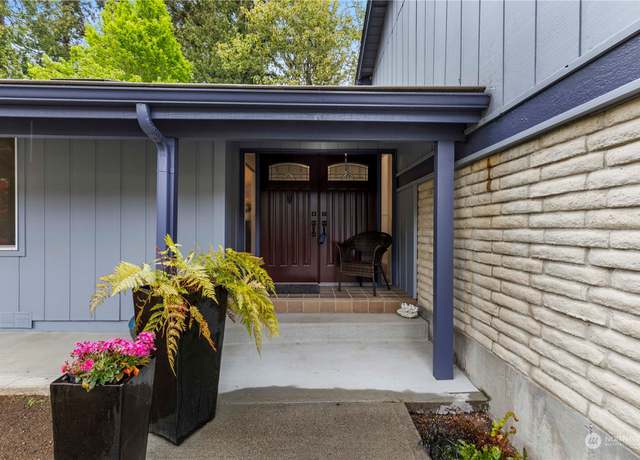
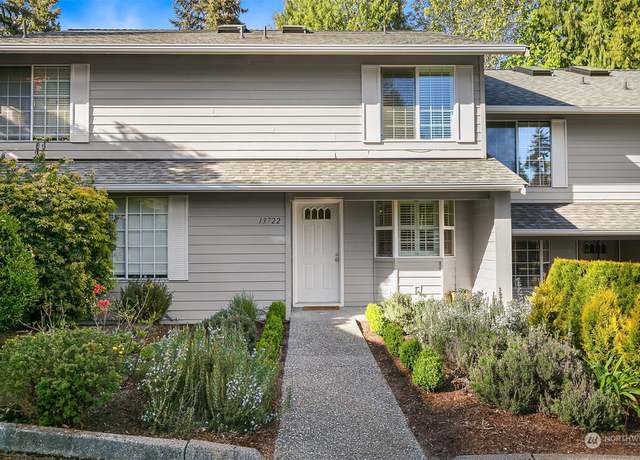
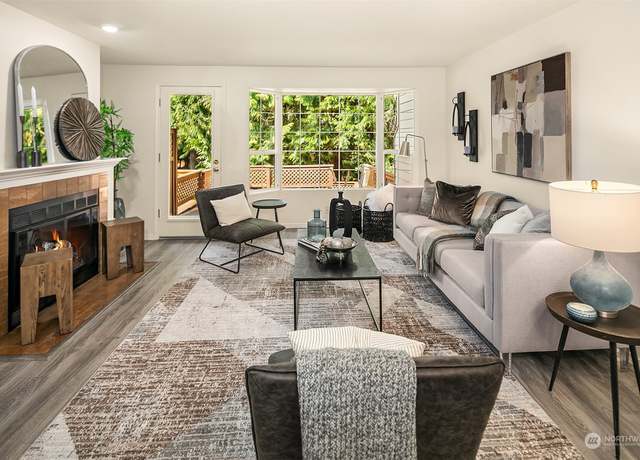
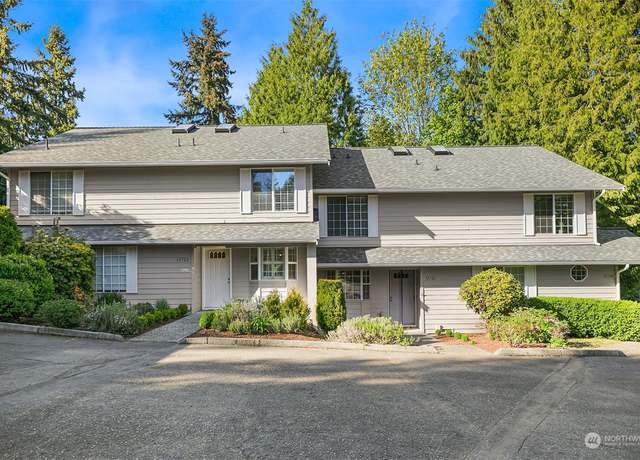
Tired of moldy oldies? This terrifically clean home is located in the desirable quiet Little Tree neighborhood which is incredibly convenient to Idylwood park, Audubon Elementary school, Microsoft, and the Overlake area. Tastefully updated in 2017 with all new kitchen, bathrooms and wet bar. New furnace and AC installed in 2021. Six skylights (most with shades and one opens) fantastically light up this 4 bedroom home. Lifetime guarantee on all the windows and all are glazed. All the closets have organizers. Roof installed in 2011 by Redmond roofing; lifetime limited warranty that is transferable to the buyer. Rare access to the backyard from the main level and lower level. The family room
1/23
$1,399,999
4 beds2.5 baths2,190 sq ft9,545 sq ft (lot)
17722 NE 27 St, Redmond, WA 98052
Listing provided by NWMLS as Distributed by MLS Grid
Step into elegance and comfort. .. This conveniently located home features an inviting open floor plan, engineered hardwood floors and a charming slate tile fireplace. The kitchen boasts stainless steel appliances, fresh quartz countertops, and an oversized island, ideal for gatherings. Upstairs, enjoy a serene primary suite with tiled shower, two bedrooms, and a full-size bathroom. The lower level offers a cozy family room, convenient half bath, and an additional bedroom or office space. All bedrooms have been freshly carpeted. Outside, relax on the spacious deck overlooking the fully fenced backyard and patio. Complete with a two-car garage, this home offers both style and functionality m
1/36
$1,189,000
4 beds2.5 baths1,680 sq ft7,191 sq ft (lot)
16433 NE 106th Pl, Redmond, WA 98052
Listing provided by NWMLS as Distributed by MLS Grid
Welcome to fabulous Maplebrook Lane, a gorgeous & sought after community of single-family homes conveniently located in a tranquil setting with easy access to downtown Redmond, Kirkland, Bellevue and both the 520 and 405 freeways! This home has been appealingly updated and is move-in ready. A brand new roof, skylight, gutters & downspouts were just installed last week! Updates/upgrades include; LVP flooring on the main level, freshly painted interior walls, stainless steel kitchen appliances, bathrooms & light fixtures. Wood-burning fireplace! Enjoy the private and serene, park-like setting off your rear patio & deck. Your own spacious, detached garage has loads of s
1/18
$800,000
2 beds2.5 baths1,150 sq ft1,326 sq ft (lot)
13722 NE 85th St, Redmond, WA 98052
Listing provided by NWMLS as Distributed by MLS Grid
This spacious, top floor, end unit features two large bedrooms and 1.75 baths. Large windows, slider and deck face south for lots of light and views over Swan Lake. Enjoy your privacy in this quiet complex with only 4 units per building. Well maintained with updated kitchen, fiber internet, wood burning fireplace, full-size washer and dryer in unit, storage off the deck, assigned covered parking and tons of extra guest parking. Located in a fantastic, central location with easy access to Microsoft, Bridle Trails, Grass Lawn Park, Redmond, Kirkland and 405. No rental-cap, pet friendly, and it's pre-inspected.
$475,000
2 beds2 baths945 sq ft
13801 Old Redmond Rd Unit G213, Redmond, WA 98052
Listing provided by NWMLS as Distributed by MLS Grid
Welcome to your dream retreat—a stunning modern barn home nestled on 4.45 acres of picturesque land. This meticulously upgraded property offers the perfect blend of luxury, comfort, and functionality, making it an ideal estate! With 3 bed, 2 bath & 2 bonus rooms. Escape the hustle and bustle of city life and immerse yourself in the tranquility of country living while 5 minutes from grocery stores, numerous restaurants, and other essential businesses. Whether you're an avid equestrian, a nature enthusiast, or simply seeking a serene retreat, this modern barn home offers the lifestyle you've been dreaming of. Don't miss your chance to make this stunning property your own. Prepare
$1,850,000
3 beds3 baths2,620 sq ft4.56 acres (lot)
24418 NE 102nd St, Redmond, WA 98053
Listing provided by NWMLS as Distributed by MLS Grid
Enjoy the vibrant Trilogy lifestyle in this highly sought-after 55+ adult community. This spacious 2678 sq ft "Monitcello" rambler offers stunning views of the eleventh fairway and lush greenbelt from its abundant natural light-filled interiors. Just one block from the Clubhouse, this home boasts an expansive kitchen with an oversized island and stainless steel appliances, perfect for hosting gatherings. Three bedrooms plus additional finished room that can serve as a home gym, office, craft room, or guest suite with the third bedroom and 3/4 bath. Oversized, partially covered deck. New roof 2022. A/C HOA dues cover access to the clubhouse, pool, gym, pickleball, tennis, trails, a
$1,750,000
3 beds3 baths2,678 sq ft6,888 sq ft (lot)
12308 235th Pl NE, Redmond, WA 98053
Listing provided by NWMLS as Distributed by MLS Grid
Enjoy panoramic greenbelt views from the main living areas of this comfortably elegant Hemlock plan home. Courtyard entry leads to the vaulted great room with a wall of windows framing the lush views. Hardwood floors thru the main living areas. Island kitchen w/ warm wood cabinetry w/ handy pull-outs & topped with granite counters lit by 3 Solatubes. Serene owner’s suite w/ 2 walk-in closets & beautifully tiled en-suite 5 piece bath. 2nd bdrm en-suite w/ private family rm. Large office. New interior paint & new bdrm carpets. Expansive deck is surrounded by nature. New furnace ‘20. HOA dues include the Trilogy clubhouse, trails, pickleball & tennis courts,
$1,500,000
2 beds2.5 baths2,300 sq ft6,074 sq ft (lot)
12628 Adair Creek Way NE, Redmond, WA 98053
Listing provided by NWMLS as Distributed by MLS Grid
A modernized end unit studio, ideally situated on the top floor, boasting a charming balcony within a meticulously managed HOA/community. The complex features newer siding/paint, new secure mailboxes, cement walkways well-maintained grounds, and lots of guest parking. Sport court & extra parking is nearby. Minutes away to downtown Redmond, Town Center, Evergreen Hospital, future light rail station, Bella Bottega, the Burke Gilman Trail, and the local library. Abundant natural light illuminates the space, complemented by the convenience of nearby covered parking. There is no rental cap, offering flexibility and investment potential. Preinspected!
$315,000
0 beds1 bath384 sq ft
9484 Redmond-Woodinville Rd NE Unit C301, Redmond, WA 98052
Listing provided by NWMLS as Distributed by MLS Grid
Experience the best of convenience and elegance at The Meadows at Marymoor. This 3-bed, 2.5-bath townhome offers granite countertops, new carpet, fresh paint, and a 5-piece primary bath. Enjoy a light-filled interior, a side-by-side 2-car garage, two parking spots in front of the unit, ample storage, and a large backyard. Located minutes from Microsoft's Main Campus and Marymoor Park, with top-rated Lake Washington schools nearby. No rental cap! Don't miss out on this perfect opportunity!
$975,000
3 beds2.5 baths1,546 sq ft
4629 168th Ct NE, Redmond, WA 98052
Listing provided by NWMLS as Distributed by MLS Grid
Welcome home to this meticulously maintained 2014 Pulte Resale. Beautiful Craftsman curb appeal, 9 feet ceiling height for all three levels! Generously sized office/flex room, with a 3/4 guest bath on the 1st floor. Super long island, gourmet kitchen, plus a planning center that offers extra storage. Open concept, abundant natural light, and a big deck that faces the green belt with gorgeous scenery especially in fall! Great privacy from all bedrooms windows. The bright basement area offers a bonus room, a 3/4 bathroom and a huge bedroom. The yard is very level and fully fenced, facing the green belt. This home sits on a quiet street with good space between neighbors. Great neighborhood and
$2,199,990
4 beds4 baths3,127 sq ft5,500 sq ft (lot)
17180 NE 123rd St, Redmond, WA 98052
Listing provided by NWMLS as Distributed by MLS Grid
Desirable location! The complex is located near the Sammamish River with easy access to the 520 Bike Trail, Redmond Town Center, Hwy 520, Microsoft, Marymoor Park, and public transit. This unit has been updated with fresh paint, new carpeting/flooring, new lighting, new hardware, kitchen/bath counters, handy seating bar. Covered deck for easy entertaining. Only gas BBQ allowed. Spacious bedroom area with mirrored closets. Covered parking in a prime location-good guest parking nearby. Plenty of storage in the approx 8'x 5' storage unit. Bicycle storage also avail. HOA is well run with good reserves. 3 licensed pets up to 75 lbs max allowed. No upcoming special assessments. Complex exterior u
$339,000
1 bed1 bath530 sq ft
15818 NE Leary Way Unit 5-204, Redmond, WA 98052
Listing provided by NWMLS as Distributed by MLS Grid
For the first time in 40 years, this cherished home is available, perfectly positioned just minutes from PCC, downtown Redmond, and key Eastside employers. It combines serene country and ease of city access. Set on acreage, the property features a master gardener’s touch with vibrant, year-round gardens, greenhouse, and a woodshop. A stone patio, two-car detached garage w/ wood burning stove further highlight the outdoor appeal. Inside, the open floor plan includes a spacious living area, two bedrooms, and 3/4 bath on main level, complemented by a partly finished basement with an additional bedroom and half bath. This home is ready for your personal touch, whether you choose to expand
$1,250,000
3 beds1.5 baths2,460 sq ft1.27 acres (lot)
18820 NE Novelty Hill Rd, Redmond, WA 98052
Listing provided by NWMLS as Distributed by MLS Grid
A great location, close to eastside workplaces yet private and quiet. 2-Story home originally built in 1989 was recently updated with new kitchen, bathrooms, refinished hardwood flooring, expanded back deck, tankless hot water, composition roof, and exterior paint. Large 1 acre lot supports flower and vegetable gardens, 2 storage sheds, paver patio, blueberry bushes and a nature trail.
$1,090,000
3 beds2.5 baths1,860 sq ft1.02 acres (lot)
4448 278th Ave NE, Redmond, WA 98053
Listing provided by NWMLS as Distributed by MLS Grid
Welcome home to this charming 2b2b TH in the center of Redmond. Two car garage, plus a finished flex room that can be used as a storage room or office. Vaulted ceiling with big windows bringing so much light in any season. New vanity in the bathrooms, new carpet, newly finished kitchen cabinet, and a fresh new paint - this sweet home is a turn-key! Big deck and patio, a fully fenced backyard, and great privacy as this home faces an open lawn space. The top floor features a loft area with the potential to be another office, great for the hybrid working style. Two generously sized bedrooms. Central AC! Well managed HOA, no rental cap, close to everything, lots of parks and trails, great schoo
$885,000
2 beds2.5 baths1,895 sq ft
7250 NE Old Redmond Rd Unit M149, Redmond, WA 98052
Listing provided by NWMLS as Distributed by MLS Grid
Discover your new retreat in Redmond's Union Hill neighborhood! This cozy Storybook Rambler on a . 35-acre lot welcomes you with a circular drive & a private setting. Inside, find a well-designed one-level layout with 3 bedrooms, 2 baths, & a den. The primary en-suite features a spacious walk-in closet, while two additional bedrooms share a full bath. The updated kitchen with Quartz countertops offers a modern feel & opens to the eat-in area, perfect for gatherings. Enjoy seamless indoor-outdoor living with a second living space opening to the patio & a level grass yard for summer cookouts & games. Conveniently located near Tech Hubs, LW schools, parks, & R
$1,050,000
3 beds2 baths1,560 sq ft0.35 acre (lot)
21303 NE 61st St, Redmond, WA 98053
Listing provided by NWMLS as Distributed by MLS Grid
Discover the perfect blend of comfort and convenience in this beautifully updated 2-bed, 1.75-bath townhome condo in an unbeatable location and in the most sought-after Green Condominium community in Bellevue. Classic NW architecture with vaulted ceilings, plenty of natural light, freshly painted interiors and brand-new flooring. Move in ready with all new kitchen SS appliances and fully remodeled bathrooms with elegant finishes. Enjoy your private deck and patio overlooking the grassy lawns. Includes one car carport, two additional parking spaces in the front, and storage. Quick access to Microsoft, shopping, dining, 520, Pro Club and the Light Rail. No rental cap. Pets are welcome. Don't
$594,900
2 beds2 baths1,131 sq ft
14709 NE 35th St Unit D36, Bellevue, WA 98007
Listing provided by NWMLS as Distributed by MLS Grid
Major 2024 updates on this lovely Education Hill home loved by the same owner for over 40 years. Brand new flooring, kitchen refresh, new GE Profile Appliances, two fully renovated bathrooms, canned lights, interior outlets, interior doors, Sherwin Williams interior paint, freshly painted exterior trim and newly stained ~800 square foot entertainment back deck. Desirable floor plan includes a huge primary ensuite w/ walk-in closet, new dual vanity, shower and tub. Basement has a large flex room that has been used as a 4th bedroom, office and rec room with it's own 3/4 bath. Two gas fireplaces and a huge 2 car garage. New fence in 2022 and leaf guard gutters. Located in a nice cul-de-sac clo
$1,500,000
4 beds3 baths2,410 sq ft0.24 acre (lot)
9620 162nd Ave NE, Redmond, WA 98052
Listing provided by NWMLS as Distributed by MLS Grid
A rare find in Redmond's Union Hill district! Updated 3bedroom rambler on a gorgeous private lot! Enjoy a cozy living room with a fireplace, updated kitchen with new white cabinetry, quartz counter and high quality stainless steel appliances. Dining room area plus an informal eating area. A lovely family room area with a slider that leads out to a entertainment sized patio area which sits on a gorgeous, level lot overlooking a pristine view. Primary bedroom offers a 3/4 bath plus an additional full bathroom for guests. New windows/doors. Ample sized 2 car garage w/ finished walls & floor. Quiet cul-de-sac location, only mins to Lake Washington schools, downtown Redmond hub, light rail
$925,000
3 beds2 baths1,290 sq ft8,060 sq ft (lot)
7565 206th Pl NE, Redmond, WA 98053
Listing provided by NWMLS as Distributed by MLS Grid
Experience community & luxury in this beautiful remodel walking distance to Downtown Redmond! Be the first to enjoy all new flooring/paint/fixtures/appliances. Feel secure with the brand new electrical panel and HVAC system - this home is fully updated and move-in ready for its new owners. The upper level of this split-level home spans an open floor-plan perfect for hosting. The opposite wing holds 3 BR including the primary with an en-suite bath. Downstairs brings a fully finished play/rec room with an office or extra storage, large laundry/bathroom. The pristine landscaping & care brings this nearly . 25 acre to life between the deck, terraced backyard & work space in th
$1,449,000
3 beds3 baths2,160 sq ft9,600 sq ft (lot)
16604 NE 92nd St, Redmond, WA 98052
Listing provided by NWMLS as Distributed by MLS Grid
Welcome to this Rose Hill charmer in the quiet Sam Hill neighborhood with over a half acre of mature landscape to call your own. Thoughtfully maintained and updated by the current (original) owners, including a massive primary walk-in closet, backup generator, and access to Award-winning Public Schools. An abundance of windows, vaulted ceilings, walnut hardwoods, custom cherry cabinets, granite slab counters, and a cozy family room with gas fireplace off the kitchen. Entertain from the formal living and dining, or the multiple exterior decks and patios. A convenient commute in all directions and near The Village at Totem Lake. Privately tucked away with a long aggregate drive and two-car ga
$1,650,000
4 beds2.5 baths2,380 sq ft0.58 acre (lot)
13227 NE 114th St, Redmond, WA 98052
Listing provided by NWMLS as Distributed by MLS Grid
A stunning & stylish remodel makes this home better than new! The oversized sunny lot enjoys privacy & sweeping greenbelt views. Al Fresco dining feels like living in a park. The open floor plan enjoys 10-ft ceilings, & is an ideal layout for hosting guests. The kitchen is a chef's dream w/ satin white cabinetry, professional grade appliances, double ovens, wine refrigerator, gorgeous marble countertops, oversized island & magazine ready finishes. The great room is the heart of the home & perfect to enjoy every day. 2 primary suites each feel like a resort vacation to relax & unwind. Heated floors, custom closets & blinds, abundant storage, butler's
$1,480,000
2 beds2.5 baths1,920 sq ft8,192 sq ft (lot)
24215 NE 130th Pl, Redmond, WA 98053
Listing provided by NWMLS as Distributed by MLS Grid
Welcome home to delightful Centre Cottages by Toll Brothers! This chic modern farmhouse cottage is located on a light-filled corner home site. Enjoy hard-surface flooring throughout this elegant home. An oversized, quintessential cottage front porch welcomes you with an 8-foot door. French doors on the first-floor flex space provide versatile living options. Cozy up to a gas fireplace with a full-height tile surround! Explore the nearby garden path along the South Plaza. Guest parking conveniently nearby. Welcome to an effortless lock and leave lifestyle as the community gardening team tends to the landscaping.
$1,195,156
2 beds2 baths1,259 sq ft
10257 (HS 23) 135th Cir NE, Kirkland, WA 98033
Listing provided by NWMLS as Distributed by MLS Grid
Honey, stop the car! Superbly styled, elegant & updated, this light & bright custom rambler is excellently located & offers buyers choice of Bellevue or Redmond schools! Gorgeously remodeled kitchen w/ custom cabinets, stainless appliances, quartz counters & tons of storage. Formal & informal living areas feature vaulted ceilings, hardwood floors, skylights & A/C. Spacious bedrooms include luxurious primary w/ marble spa-like ensuite bath. Amazing 100+ sf bonus sunroom w/ access to the private lush, fenced yard great for entertaining, pets & playtime. Large corner lot w/ 2 car garage. Ideal location close to fine dining, shopping, services, parks, t
$1,700,000
3 beds2.5 baths2,320 sq ft0.31 acre (lot)
2113 179th Ct NE, Redmond, WA 98052
Listing provided by NWMLS as Distributed by MLS Grid
Recently renovated unit in Eastbridge. Throughout the interior, fresh paint provides a clean, modern look. The kitchen has been updated with new cabinets, granite countertops, a stylish backsplash, and state-of-the-art appliances. New carpets and hardwood floors enhance the space, while new recessed lighting brightens every room. Situated in a beautiful and highly convenient location, it's close to MS, shopping areas, and the 520 FWY. Parking is conveniently available right in front of the unit. HOA dues cover water, sewer, garbage, and exterior maintenance. Residents can also enjoy access to the clubhouse and outdoor pool. This move-in ready unit has no rental cap, No special assessment an
$550,000
2 beds1 bath913 sq ft
14707 NE 31st St Unit B, Bellevue, WA 98007
Listing provided by NWMLS as Distributed by MLS Grid
Welcome to Ohana Cottage! Special and Rare, the premium home at the lauded 25-home Conover Commons community. Enjoy lush, fragrant gardens as you enter a room-sized front porch, old-fashioned screen door and welcoming front 'Dutch' door. Surrounded by hushed, permanently preserved woodlands, this charming, very private, extensively upgraded home is NOT to be missed. High end appliances, networked, 'smart' switches/plugs, Mitsubishi heating/cooling, heated bath floors/toilets throughout, Entertainment system, custom Roman shades/closets, garden sprinklers, and SO much more. Minutes to Eastside employment, I-405, plus DT Kirkland/Redmond too! Generous private garage with EV charger and stora
$1,585,000
3 beds3.5 baths2,472 sq ft
13424 NE 111th Ct, Redmond, WA 98052
Listing provided by NWMLS as Distributed by MLS Grid
Experience modern living in this stunningly renovated 2-story condo in DT Redmond with easy access to shopping, dining & transit—Microsoft nearby. Indulge in the luxury of a Mstr bathroom that boasts top-to-bottom upgrades, including new bathtub/state-of-the-art smart mirror/new vanity. New vinyl flooring on the main floor. Newly installed water heater, the fresh paint and new lighting that casts a glow in each room. A private deck. This home, complete w/ stainless steel appliances, a cozy fireplace. A covered parking space, extra storage at the parking spot & a closet by the patio. A lot of guest parking, the home is minutes from movie theater, Trader Joe's, QFC & r
$749,000
2 beds2.5 baths1,278 sq ft
9302 Redmond Woodinville Rd NE #206, Redmond, WA 98052
Listing provided by NWMLS as Distributed by MLS Grid
Modern sun-filled west facing townhouse with vaulted ceiling in Element. Center of location is all commuters' dream, on bus line. Blank new carpet for entire unit. New water tank in 2023. Newer paint. Full size of washer/dryer. 2 car tandem garage. Main floor boasts an open living RM & dining RM w/ fireplace for cozy winter, gleaming hardwood floor open to kitchen w/ bar, newer SS appliances. Second floor has master suite & 2nd BR w/ its own bath & walk-in closets, plus top floor loft as office or flex space. No rental cap! Well funded HOA. No Special assessment, low HOA due. Inspection done! Hops to highway, trail, restaurant, shopping. parks. Lake Washington Schools.
$900,000
2 beds2 baths1,205 sq ft3.60 acres (lot)
15209 NE 81st Way #103, Redmond, WA 98052
Listing provided by NWMLS as Distributed by MLS Grid
Prime Redmond location just steps away from the Redmond Technology Station and Microsoft campus! This two-story townhouse-style condo boasts contemporary finishes and a well-designed layout. A roomy entry leads to an open living room with a cozy fireplace, a dining room, and an extra-large kitchen with a breakfast bar. Upstairs, discover two spacious bedrooms, including a generously-sized master suite with a private bath. This distinctive unit backs up to a greenbelt, offering a serene outdoor retreat, and a private garage.
$770,000
2 beds2.5 baths1,289 sq ft
4107 159th Ave NE Unit 22C, Redmond, WA 98052
Listing provided by NWMLS as Distributed by MLS Grid
A rare gem of a lakefront sanctuary with an income producing 2BR/2BA/Office detached ADU, a heated 3-car garage plus workshop, salon, and a brand new parkway-to-lake hillside elevator. The main home features 5BR/3BA/Office, outdoor dining and lounging by the fireplace, custom tiled patio, covered decks, and huge window seats/daybeds with Mt. Rainier views on every floor. Sophisticated modern amenities including tall ceilings, radiant heated floors, marble stairs, scenic glass doors, and dual primary suites each with cozy see-thru fireplace, walk-in shower and luxurious soaking tub. Experience the magic of living on the beachfront with a massive Thru-Flow composite dock where sports, luxury,
$4,395,000
7 beds5.5 baths5,068 sq ft9,983 sq ft (lot)
2006 W Lake Sammamish Pkwy NE, Redmond, WA 98052
Listing provided by NWMLS as Distributed by MLS Grid
Welcome to your dream Craftsman-style estate in the sought after Ames Lake area of Redmond. This stunning 4-bedroom custom built house boasts an office, media room, & spacious Chef’s kitchen that opens to the eating area & family room. Step inside to discover beautiful hardwood floors throughout, new carpeting, & an open floor perfect for entertaining. The covered front deck offers a serene outdoor space to enjoy over 2 acres of mature panoramic landscaping, while the new rear Trex Enhance deck is ideal for summer BBQs under the beautiful Japanese maple. Conveniently located with easy access to major highways, shopping centers, & parks, this house offers both priv
$1,825,000
4 beds2.5 baths3,460 sq ft2.36 acres (lot)
27458 NE Ames Lake Rd, Redmond, WA 98053
Listing provided by NWMLS as Distributed by MLS Grid
MLS#2213531 VIRTUAL MODEL PHOTOS ADDED. September/October Completion! The E1B presents a delightful 2-bedroom townhome accompanied by a 1-car garage. On the low level, you'll find a den and a powder room. Moving to the main level, a spacious covered deck extends from the living room, complemented by the dining room and kitchen. Ascending to the upper level reveals the primary bedroom with an ensuite dual vanity bathroom, a second bedroom, a guest bathroom, and a conveniently positioned washer/dryer. Design options include: Classic Canvas Collection - Concerto. Builder broker registration policy requires, if represented, your broker register you with Community Site agent prior to OR with you
$1,304,990
3 beds3.5 baths1,769 sq ft
19374 NE 69th Cir #107, Redmond, WA 98052
Listing provided by NWMLS as Distributed by MLS Grid
Welcome to Bellevue Manor! The best location, across from Microsoft, near Bell-Red shopping/dining, bus routes and great schools. A one level, ground floor condo with pool views and a private patio. All refreshed for you, new carpet/flooring, new paint, new blinds, new lights, New quartz counters, new appliances and a trendy ship-lap wall! Lots of storage with 4 big closets. A secure entrance with an access phone to buzz people in. There is a tennis court, pool, lots of visitor parking plus one assigned space. WHY pay rent when you can own your own home! It's a bright and light unit with room for stools at the breakfast bar and your dining room table. Comfortable, radiant heat. Come see thi
$298,000
1 bed1 bath680 sq ft
14645 NE 34th St Unit C 5, Bellevue, WA 98007
Listing provided by NWMLS as Distributed by MLS Grid
MLS#2221032 December/January Completion! Explore the charming C3 condo flat at Woodside, showcasing an open-concept floorplan complemented by a covered deck adjoining the dining area. This single-level design encompasses a primary bedroom with a spacious walk-in closet and ensuite bath, a second bedroom and bathroom, as well as a conveniently situated laundry area. The welcoming entryway and garage are on the 1st floor and all the living space on the 2nd floor. Upgraded finishes included! Builder broker registration policy requires, if represented, your broker register you with Community Site agent prior to OR with you, on your 1st visit to receive Broker Commission.
$794,990
2 beds2 baths1,215 sq ft
19319 NE 69th Cir #202, Redmond, WA 98052
Listing provided by NWMLS as Distributed by MLS Grid
MLS#2221618. December/January Completion! The D3 at Woodside is a 2 bed/2 bath condo flat with an attached 1-car garage. The entryway and garage are on the 1st floor & all the living space on the 2nd floor. Once upstairs, enter into the open concept living area & kitchen that flow into one bright & airy space. A covered deck off the dining area is ideal for relaxing outdoors. Primary bedroom boasts a walk-in closet & ensuite bathroom. Design highlights: 42" upper kitchen cabinets, quartz counters, mini split for A/C, RevWood floors, & SS electric appliances. Builder broker registration policy requires, if represented, your broker register you with Community
$899,990
2 beds2 baths1,504 sq ft
19319 NE 69th Cir #201, Redmond, WA 98052
Listing provided by NWMLS as Distributed by MLS Grid
MLS#2221690 December/January Completion! Discover the charm of Woodside's D2A-ADA condo, boasting a covered entry, expansive great room, and a kitchen with a pantry. This single-level design includes a primary bedroom with dual spacious closets and an ensuite bathroom, a second bedroom and bathroom, plus an all-in-one washer and dryer for convenience. Embracing accessibility, the D2A-ADA plan incorporates thoughtful features like a shallow kitchen sink, a range with a hooded microwave, and a primary bathroom with a bathtub and tile wall surrounds compliant with ADA standards. Elevate your living experience in this beautifully designed condominium.
$804,990
2 beds2 baths1,367 sq ft
19319 NE 69th Cir #101, Redmond, WA 98052
Listing provided by NWMLS as Distributed by MLS Grid
MLS# 2221722. October/November Completion! The D3 at Woodside is a 2 bed/2 bath condo flat with an attached 1-car garage. The entryway and garage are on the 1st floor & all the living space on the 2nd floor. Once upstairs, enter into the open concept living area & kitchen that flow into one bright, airy space. A covered deck off the dining area is ideal for relaxing outdoors. Primary bedroom boasts a walk-in closet & ensuite bathroom. Design highlights: 42" upper kitchen cabinets, quartz counters, mini split for A/C, RevWood floors, & SS electric appliances. Builder broker registration policy requires, if represented, your broker register you with Community Site
$909,990
2 beds2 baths1,504 sq ft
19347 NE 69th Cir #204, Redmond, WA 98052
Listing provided by NWMLS as Distributed by MLS Grid
Welcome home to the beautiful Meadowview Village. This private light filled end unit is a 2 bedroom + loft that can be converted to 3rd bedroom + large bonus room perfect for gym, home office, extra storage, you name it. Eat-in chef's kitchen boasts Wolf stove, access to private trex deck, and ample storage space with custom built-in shelving and cabinets. Generous primary bedroom with vaulted ceiling and large walk-in closet. Central A/C, 2 car garage, visitor parking. Convenient prime location in downtown Redmond close to Sammamish River Trail, grocery store, restaurants, shopping. No special assessments and NO RENTAL CAP!
$997,500
2 beds2.5 baths1,885 sq ft
16220 NE 90th Ct #2403, Redmond, WA 98052
Listing provided by NWMLS as Distributed by MLS Grid
A long curved driveway brings you through stunning landscaping to this meticulously maintained northwest contemporary home in a gorgeous neighborhood. On just shy of an acre, you'll get lost in the tranquil beauty of this stunning yard. Between the pathways through old growth trees & thoughtfully planted specimen Rhododendrons & maple trees, you'll want to spend your time on the deck taking in the view, but don't miss the beauty inside! 2 fireplaces, a large kitchen with plenty of workspace, & stunning floor to ceiling windows in the dining room bring the beautiful outside in. Primary suite with vaulted ceilings & soaking tub w/ skylight creates a relaxing retreat. Ju
$1,899,900
5 beds3 baths2,860 sq ft0.90 acre (lot)
17116 NE 126th Pl, Redmond, WA 98052
Listing provided by NWMLS as Distributed by MLS Grid
Based on information submitted to the MLS GRID as of Fri Apr 26 2024. All data is obtained from various sources and may not have been verified by broker or MLS GRID. Supplied Open House Information is subject to change without notice. All information should be independently reviewed and verified for accuracy. Properties may or may not be listed by the office/agent presenting the information. Some IDX listings have been excluded from this website.
This area's enrollment policy is not based solely on geography. Please check the school district website for more information.
Elementary schools
Middle schools
High schools
GreatSchools Summary Rating
9/10
Benjamin Rush Elementary School
Public, K-5
9/10
John J. Audubon Elementary School
Public, K-5
8/10
Norman Rockwell Elementary School
Public, K-5
8/10
Albert Einstein Elementary School
Public, K-5
8/10
Redmond Elementary School
Public, K-5
Only showing 5 of
10 elementary schools.
School data is provided by GreatSchools, a nonprofit organization. Redfin recommends buyers and renters use GreatSchools information and ratings as a first step, and conduct their own investigation to determine their desired schools or school districts, including by contacting and visiting the schools themselves.Redfin does not endorse or guarantee this information. School service boundaries are intended to be used as a reference only; they may change and are not guaranteed to be accurate. To verify school enrollment eligibility, contact the school district directly.
Homes for sale in Redmond have a median listing price of $1.17M. Some of these homes are Hot Homes, meaning they're likely to sell quickly.
What are some of the most popular neighborhoods in Redmond?
Popular neighborhoods include Northeast Bellevue, Grass Lawn, English Cove, North Redmond, North Rose Hill, Education Hill, Bridle Trails, South Rose Hill, Overlake, and Downtown Redmond.
Redmond, Washington boasts a well-developed transportation system, including public transit options. The city is served by King County Metro Transit and Sound Transit, providing bus and light rail services respectively. Traffic levels for car travel can be high, particularly during peak commuting hours. Additionally, Redmond is conveniently located near several major highways, including State Route 520 and Interstate 405, facilitating easy access to surrounding regions. Learn more on our Redmond city guide.
What types of properties are available in Redmond?
Redmond, Washington offers a variety of single-family home types, including ranch-style homes, split-level homes, and contemporary homes, among others. These homes can be found throughout the city, with ranch-style homes typically built in the 1960s and 1970s, split-level homes built in the 1980s and 1990s, and contemporary homes built in recent years. To explore different property types for sale in Redmond, Washington, use the 'Home type' filter located above the active listings. Customize your search by selecting options like single-family homes, condos, townhomes, and more.
What is life like in Redmond?
Redmond, Washington offers a vibrant and engaging lifestyle with a diverse range of activities and amenities. The region boasts a picturesque landscape, encompassing lush greenery, rolling hills, and serene lakes. The weather in Redmond is characterized by mild winters and warm summers, allowing residents to enjoy a variety of outdoor pursuits year-round. The city is renowned for its thriving job market, with numerous opportunities in technology, innovation, and entrepreneurship. Redmond provides a plethora of recreational options, including parks, trails, and community events, ensuring residents can always find something exciting to do.
What are the schools and amenities like in Redmond?
Redmond, Washington boasts a variety of public amenities for all residents to enjoy. You can find an array of dining options, as the city is home to numerous restaurants offering diverse cuisines. Outdoor enthusiasts will appreciate the numerous parks scattered throughout the city. For your grocery needs, Redmond hosts several grocery stores providing a wide selection of goods. Additionally, the city offers other amenities such as libraries, fitness centers, and shopping centers for your convenience.
In the past month, 59 homes have been sold in Redmond. In addition to houses in Redmond, there were also 36 condos, 32 townhouses, and 1 multi-family unit for sale in Redmond last month. Redmond is a minimally walkable city in King County with a Walk Score of 33. Redmond is home to approximately 54,152 people and 90,857 jobs. Find your dream home in Redmond using the tools above. Use filters to narrow your search by price, square feet, beds, and baths to find homes that fit your criteria. Our top-rated real estate agents in Redmond are local experts and are ready to answer your questions about properties, neighborhoods, schools, and the newest listings for sale in Redmond. Our Redmond real estate stats and trends will give you more information about home buying and selling trends in Redmond. If you're looking to sell your home in the Redmond area, our listing agents can help you get the best price. Redfin is redefining real estate and the home buying process in Redmond with industry-leading technology, full-service agents, and lower fees that provide a better value for Redfin buyers and sellers.

 REDFIN IS COMMITTED TO AND ABIDES BY THE FAIR HOUSING ACT AND EQUAL OPPORTUNITY ACT. READ REDFIN'S FAIR HOUSING POLICY AND THE NEW YORK STATE FAIR HOUSING NOTICE.
 United States
 Canada