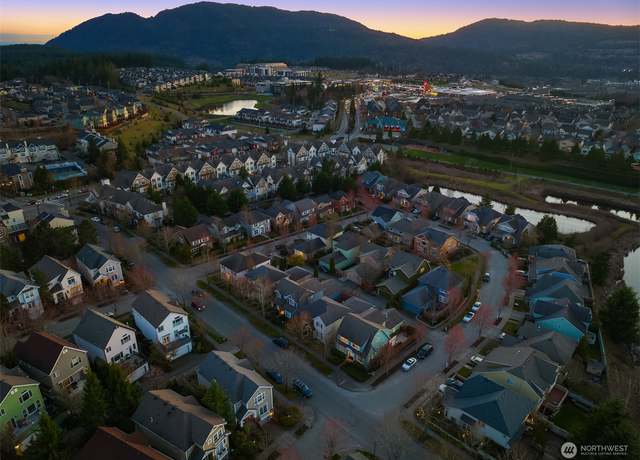
Welcome to this stunning end-unit townhome in Klahanie, newer paint, and featuring luxurious carpeting. Kitchen and bathrooms are fully updated. This home offers formal living and dining areas, a cozy fireplace, and a kitchen equipped with stainless steel appliances. The primary suite includes a walk-in closet and a luxurious 5-piece bath. Generous bonus room provides a flexible space that can serve as a fourth bedroom, play area, or office, complete with a large storage area. Enjoy the convenience of an oversized 2-car garage, a patio and small yard off the dining room, and balcony off the family room. Nearby grocery stores & shops. Klahanie amenities include: 2 pools, tennis courts,
1/40
$998,000
3 beds3 baths1,949 sq ft1 sq ft (lot)
4439 249th Ter SE, Sammamish, WA 98029
Listing provided by NWMLS as Distributed by MLS Grid
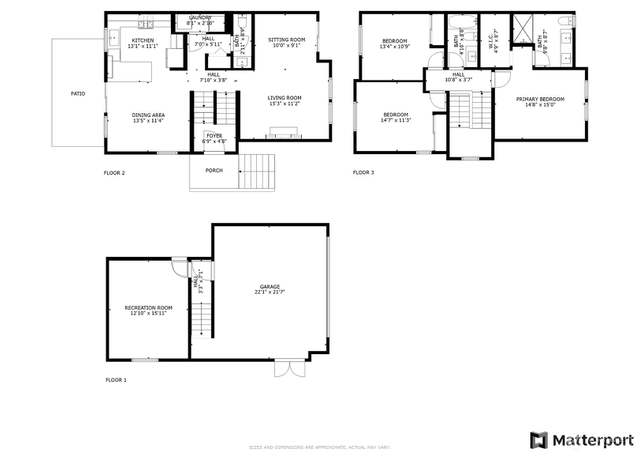
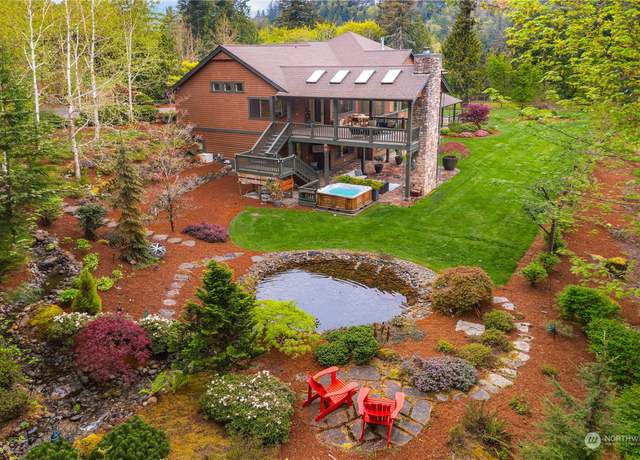
Welcome home to the wanderers, the hobbyists, the nurturers who yearn for a retreat close in. A shy 7 acres wrapped in breathtaking views of the Tiger Mountain Foothills, yet a private sanctuary onto its own filled with a waterfall, fruits trees, verdant lawn and gardens seasoned to capture the senses. Stone, hand hewn beams, soaring ceilings with massive windows highlight the views & substance. Main level living with a fully finished lower level below for versatility, the 5,920 sf of living is gracious & detailed to love life. Wine cellar, hot tub, outdoor fireplaces with covered decks, 5 car garage, open floorplan & room to savor the details.
1/30
$2,700,000
4 beds3.5 baths5,920 sq ft6.96 acres (lot)
14229 228th Ave SE, Issaquah, WA 98027
Listing provided by NWMLS as Distributed by MLS Grid
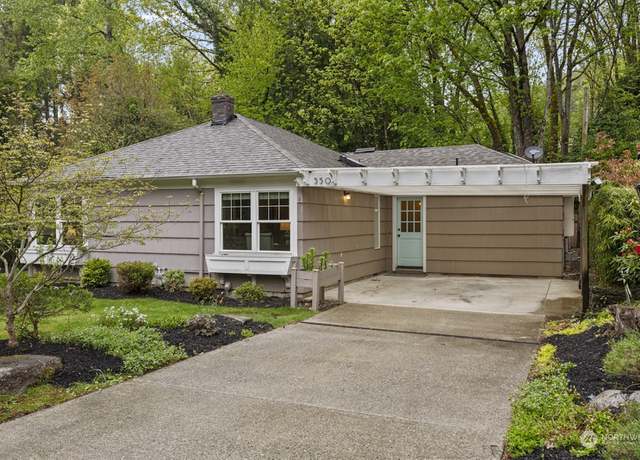
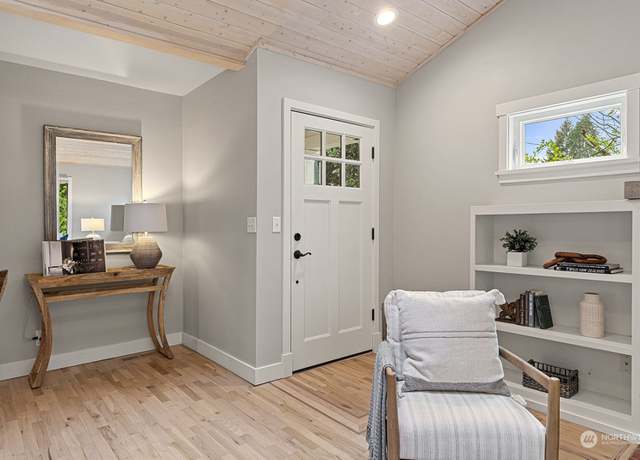
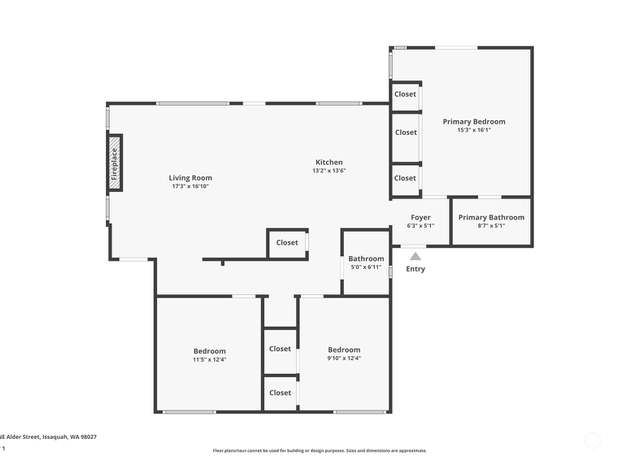
Fall in love with this creekside gem located in charming and quaint Historic Downtown Issaquah. Cocooned in nature, this rambler offers a serene retreat and a sense of tranquility rarely found. One-level living at its best. Beautifully updated. The open floor plan is perfect for entertaining. Primary with ensuite bathroom. Vaulted ceilings. Oversized windows frame the views of the forest & creek. The backyard is a nature lover's paradise with privacy, views of mature trees and direct Issaquah Creek waterfront. Minutes to downtown Issaquah with its fun restaurants / amenities. Quick access to 1-90. Award-winning Issaquah schools. Steps from all the action yet feels away from it all. Pr
1/35
$1,075,000
3 beds2 baths1,300 sq ft5,362 sq ft (lot)
550 NE Alder St, Issaquah, WA 98027
Listing provided by NWMLS as Distributed by MLS Grid
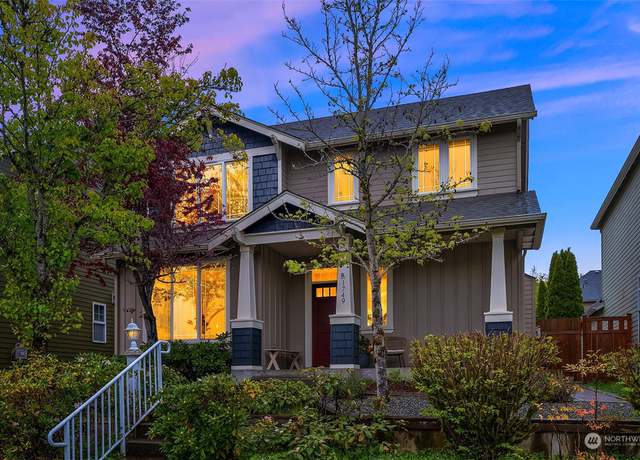
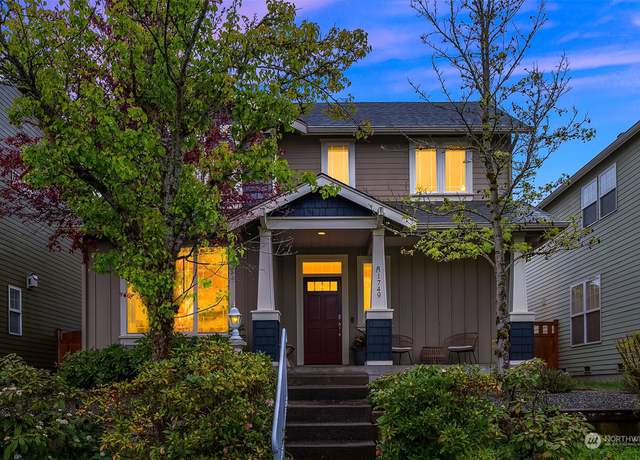
A captivating home tucked away on a quiet walk with a clever aesthetic & inspired design. Brilliantly remodeled kitchen w/ custom island, cabinets, Quartz counters, black SS Kitchen Aid appliances, Zephyr wine fridge, mosaic marble backsplash & Pottery Barn pendants. Bright living space w/ textured white oak hardwoods perfectly paired alongside a custom fireplace w/ floating wood mantel & slate surround. Ridgeline views from primary suite & enticing bath w/ frameless shower, free-standing tub, custom lighting, cabinets & large walk-in closet. Zeroscape modern backyard, professionally installed turf, full sun patio & new spring-loaded fence
1/38
$1,250,000
3 beds2.5 baths1,714 sq ft3,200 sq ft (lot)
1749 14th Ave NE, Issaquah, WA 98029
Listing provided by NWMLS as Distributed by MLS Grid
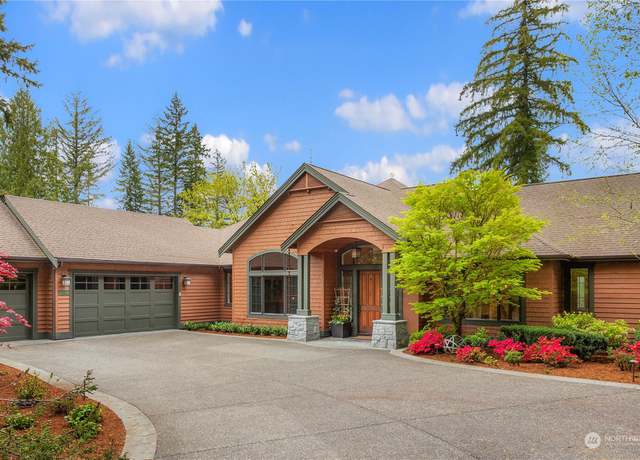
Secluded 10-acre estate, minutes from downtown Issaquah. Enjoy quiet and total privacy just a quick jaunt from shops, restaurants, and I-90. Expansive, light-filled 1996 home features 5 bedrooms, 6 baths, and 4 bonus rooms. Almost 6000 sq ft on 3 levels with space for all your dreams. Main floor features beautiful alder hardwoods, a spacious kitchen, formal and casual living and dining rooms, family room with fireplace and view deck, and powder room. Upstairs, find all new carpeting, 4 bedrooms, and primary suite with balcony, soaking tub, and walk-in closet. Huge lower level with bed & bath has MIL/ADU potential. 2-car attached garage, generator, great cell service & internet.
1/40
$2,195,000
5 beds5.5 baths5,940 sq ft10.19 acres (lot)
26020 SE Old Black Nugget Rd, Issaquah, WA 98029
Listing provided by NWMLS as Distributed by MLS Grid
Welcome to your Pacific Northwest paradise! Dream kitchen built for entertaining and features newer stainless-steel appliances, a charming double door pantry, granite countertops, and adjacent breakfast bar and family room. Newly refinished hardwood floors and new carpeting throughout. The daylight basement offers a brilliant volume of space for flexible everyday living. Additional rooms provide an exercise room, office, additional bedroom, or whatever your imagination needs. Property features walking paths among the cedars and gardens, and recirculating water feature wraps around the house to a goldfish pond. Oversized 2-car garage with an adjacent heated shop is perfect for hobbies and to
$1,700,000
4 beds3.5 baths3,670 sq ft1.40 acres (lot)
20829 SE 123rd St, Issaquah, WA 98027
Listing provided by NWMLS as Distributed by MLS Grid
This Burnstead beauty invites a harmonious connection with nature, backing to the serene forested greenbelt surrounding nearby Yellow Lake. Curl up with a beverage or book & savor the peaceful wooded views overlooking the trail from the spacious deck. Venturing inside you'll relish the soaring ceilings, flowing floorplan, tastefully remodeled kitchen w/ island & adjoining Great room. Quartz counters in kitchen, baths w/ stunning bamboo flooring throughout. Large primary suite, features 5 piece bath, skylight w/ walk-in closet. Plentiful pride of ownership. Near Challenger Elem/Award winning Issaquah SD! Enjoy the countless amenities of Klahanie, beginning at your door step. Ahh,
$1,475,000
4 beds2.5 baths2,230 sq ft4,558 sq ft (lot)
24841 SE 38th St, Sammamish, WA 98029
Listing provided by NWMLS as Distributed by MLS Grid
Welcome to your serene oasis in the heart of the vibrant 55+ Tiger Mountain senior mobile home park! This meticulously maintained 1,440 sqft abode offers a blend of comfort and tranquility. Revel in the spaciousness of 3 bedrooms, 1.75 baths, and the cozy ambiance of a wood-burning fireplace. Light and bright, covered porches! Embrace the outdoors in your private lot, complete with a shed for storage. With park approval required, enjoy peace of mind and community amenities. Space rent to be $875/month, inclusive of water, septic, garbage, and yard mowing this is the epitome of hassle-free living!
$110,000
3 beds2 baths1,440 sq ft
23800 SE Tiger Mountain Rd #65, Issaquah, WA 98027
Listing provided by NWMLS as Distributed by MLS Grid
Welcome to Mirrormont. This expansive home on over an acre lot offers main floor & lower level access for versatile living options. Main floor greets you w/ high ceilings, updated kitchen, & striking living room w/ fireplace. Prepare to be impressed by the primary suites spacious layout, custom closet, luxurious en suite, & private backyard access. Two sizable guest beds & a full bath complete the main level, ensuring comfort & convenience. Descend to the lower level, ideal for Airbnb or multigenerational options, offering family room w/ wood stove, two additional beds, office, & a 3/4 bath. Outside, immerse yourself in the serene wooded surroundings w/ wrap
$1,499,950
5 beds3 baths4,130 sq ft1.05 acres (lot)
14702 255th Ave SE, Issaquah, WA 98027
Listing provided by NWMLS as Distributed by MLS Grid
Nestled in the tranquil Woods at Issaquah on Squak Mountain, this elegant 4-bedroom, 2.25-bathroom home offers comfort and style. A covered walkway opens to interiors with hardwood floors, vaulted ceilings, and a fireplace. Large windows illuminate the main floor, while the dining room and kitchen, featuring an eat-in nook, overlook a spacious deck and private backyard—ideal for outdoor entertainment. Upstairs, find three bedrooms, a full bath, and a primary suite with dual closets and an ensuite. The lower level houses a versatile family room, utility room, and half bath. Recent updates include fresh paint, solar panels, and extensive parking for boats or RVs, making this home a perf
$1,300,000
4 beds2.5 baths2,360 sq ft9,600 sq ft (lot)
500 Kalmia Pl NW, Issaquah, WA 98027
Listing provided by NWMLS as Distributed by MLS Grid
Welcome to this Tiger Mountain Retreat! This stunning, very private custom-built home is nestled on over 5 acres of prime land atop the picturesque Tiger Mountain in Issaquah. Boasting 4 spacious bedrooms w/ the primary on the main & 2.75 baths. Incredible kitchen & main living area are spacious & offer tons of natural light. This home has all the high end finishes; Viking appliances, copper sinks, travertine floors, heated bathroom floors, solid mahogany doors, 2 High Efficiency furnaces w/ HRV systems, fireplace is a low emission/high efficiency unit, The unfinished basement spans 2,149 sq ft, w/ 10' ceilings & is plumbed for a full bath & laundry. Whole hous
$1,699,950
4 beds3 baths5,820 sq ft5.51 acres (lot)
25222 SE 133rd St, Issaquah, WA 98027
Listing provided by NWMLS as Distributed by MLS Grid
FINAL OPPORTUNITY! Just off the shores of Lake Sammamish these NW Contemporary Homes feature cutting edge original plans. The Move in Ready Eldorado Plan on lot 6 features 4 bed | 3.25 bath | Rec-Room. Open Concept Main floor flooded with natural light through floor to ceiling windows and 10 Ft ceilings with territorial and greenbelt Views. Lower level walk out basement with 9 foot ceilings, rec room and guest bedroom. Primary suite with sprawling vaulted Window Wall and spa like bath. Spacious secondary beds and well appointed laundry room upstairs. Designer selected finishes throughout. Established community in Premier location. Highest Quality Construction by one of the regions Most Resp
$1,965,000
4 beds3.5 baths2,806 sq ft3,120 sq ft (lot)
4285 216th Pl SE, Issaquah, WA 98029
Listing provided by NWMLS as Distributed by MLS Grid
Discover a rare gem showcasing the finest of Issaquah Highlands living: Among the select few residences in the area, this home features a detached 400 sqft living space above the garage, with a kitchen and full bath—a versatile space ideal for many uses. Conveniently located mere moments from I-90 and nestled within the highly coveted Issaquah school district, this meticulously maintained southeast-facing corner property offers panoramic views and a backyard retreat featuring an infrared sauna, rejuvenating cold water pull shower, greenhouse, and a convenient gas hookup for outdoor cooking. Recent upgrades include kitchen/bathrooms remodeled in 2023, a new roof in 2020, a furnace &am
$1,780,000
3 beds3.5 baths3,050 sq ft5,743 sq ft (lot)
1188 NE Katsura St, Issaquah, WA 98029
Listing provided by NWMLS as Distributed by MLS Grid
Spectacular acreage estate! An offering rarely found. Prime acreage, spacious one-level home, barn & shop. This property has it all! 7.18 level, sunny, useable, cleared, cross-fenced equestrian acres adjoining Tiger Mountain State Forest for privacy w/ trail access. Multiple pastures. Mountain views. Custom rambler home features soaring ceilings, light-filled spaces. Phenomenal floor plan w/ space for everyone. Lofted room w/ private bath, perfect for guests or potential 2nd primary. Relax, recharge, entertain on your oversized deck. 45' x 50' barn. 36' x 60' shop offers space for all your projects. Prized Issaquah schools. Your own private sanctuary away from it all yet just minutes
$1,875,000
5 beds3.5 baths3,810 sq ft7.18 acres (lot)
33407 SE 126th St, Issaquah, WA 98027
Listing provided by NWMLS as Distributed by MLS Grid
Meticulously maintained Newer home conveniently located in the center of Issaquah/Sammamish, easy access onto I-90 to Seattle, Bellevue, Redmond and Costco Corporate headquarter office. Close to Shopping on Issaquah Highland and Klahanie. This Northwest Contemporary home feathers 5 Bedrooms, 3.5 Bathrooms plus Den and Media Room! The Huge airy kitchen with large Island is open to the Great family room adjacent to the covered balcony and home office! One guest bedroom and 3/4 Bathroom and Media room are on main floor. Primary suite includes soaking tub, separate shower and double vanity with another 3 Bedrooms are on the upper floor. Walking distance to Pacific Cascade middle. Awarding winni
$1,799,500
5 beds3.5 baths3,038 sq ft3,027 sq ft (lot)
4764 SE 244th Ct, Sammamish, WA 98029
Listing provided by NWMLS as Distributed by MLS Grid
Fantastic & updated home in Klahanie! Great location close to I-90, healthcare, shopping, dining, entertainment, also trails, parks, & pool. High ceiling entrance, full of natural light both floors. New interior paint, new carpet, resurfaced hardwood floor, and new elegant lights. New kitchen counter w/ quartz countertop & new cabinet. Upstairs bathrooms feature new counter w/ quartz countertop and new quartz shower walls. Newly landscaped whole yard, newly installed instant lawn front yard, fully fenced private backyard, overlooking tranquil pond. Highly rated Issaquah School District. Community & HOA info at klahanie.com. Welcome to your dream home!
$1,468,000
4 beds2.5 baths2,140 sq ft7,278 sq ft (lot)
4313 239th Pl SE, Sammamish, WA 98029
Listing provided by NWMLS as Distributed by MLS Grid
Award winning schools. Ease of living in this ground floor unit with a yard beyond your private outside patio. Well managed complex is close to everything with tons of amenities - swimming pool, hot tub, tennis and basketball courts, club house, playground. One assigned parking space and plenty of guest and tenant parking. Updated kitchen and bath, a huge walk-in closet. Lake Sammamish State Park near by. Bike lanes, hiking trails, and access to eastside public transit.
$367,500
1 bed1 bath753 sq ft
4737 W Lake Sammamish Pkwy SE Unit A101, Issaquah, WA 98027
Listing provided by NWMLS as Distributed by MLS Grid
This beautiful, 1.1+ acre secluded, spacious, and refreshed mid century Issaquah home is ready for you to call it home! Bordering a creek at the back of the property and in the highly rated Issaquah school district, including a huge yard with room for gardening and playing. 2 bedrooms upstairs, 1 bedroom and primary suite (staged as family room) downstairs. Each floor has a full bath! Newer chefs kitchen with Viking stove, updated bathrooms, new well head, and plumbing to the septic. Light, bright, airy, and private. 2 car detached garage with room for shop space and hobbies, too! The yard is phenomenal with RV parking space, a concrete pad for your chicken coop, and partially fenced for yo
$998,000
4 beds2 baths2,400 sq ft1.16 acres (lot)
22425 SE May Valley Rd, Issaquah, WA 98027
Listing provided by NWMLS as Distributed by MLS Grid
Brilliantly designed 2 BD, 2 BA, 1-level home in Forest Village of premier 55+ Providence Point! Spacious living & dining room, w/ elegant gas fireplace, private wooded views, large deck & lots of light from S/E exposure! Remodeled kitchen w/ stone counters, pull-out cabinet shelving & extra dining nook space. Beautiful primary suite with 3/4 bath. Guest room on opposite side of the home w/ full bathroom across the hall. Fresh paint. Central A/C! Rare 2 single-car garages; use both or rent one out to a neighbor! Enjoy wildlife viewing, as the home backs up to Jacob's Creek trail. Enjoy amenities & social activities incl: indoor pool, clubhouse, classes, tennis, pickl
$575,000
2 beds2 baths1,237 sq ft
4307 Providence Point Pl SE #2604, Issaquah, WA 98029
Listing provided by NWMLS as Distributed by MLS Grid
Welcome to the desirable Greenwood Point community. Spacious & light filled, this well appointed home is here to impress. Thoughtfully cared for and tastefully refreshed with new fixtures, designer paints, built-ins and updated bathrooms. 4 beds on the upper level, primary suite plus another bedroom ensuite make this home ideal for multi generational living. Enjoy the chef's kitchen with SS appliances and tons of storage. Entertain effortlessly between the formal and informal spaces. Glass slider leads to large deck, perfect for summer BBQs. Mature landscaping is a gardener's delight. 2 car garage, AC & newer roof complete this gem. HOA has private beach access for your enjoymen
$1,825,000
4 beds3.5 baths3,240 sq ft8,671 sq ft (lot)
4554 187th Pl SE, Issaquah, WA 98027
Listing provided by NWMLS as Distributed by MLS Grid
Fully Assumable 4.75% VA Loan Open to Anyone! Nestled amidst a serene natural backdrop, this end unit in historic downtown Issaquah exudes charm. Bathed in natural light, the unit has been updated with fresh paint and new carpet, creating a spacious and inviting atmosphere. Featuring a large eat-in kitchen, cozy living room w/ tile fireplace, and huge primary bedroom. Unit also includes a stacked W/ D and a walk-in storage closet. Enjoy the outdoors on the covered deck or access miles of trails close by. With assigned parking, clubhouse, and fitness center, convenience is at your fingertips. Access to I-90, public transit, and Grand Ridge Center for shopping, dining, and theaters is just mi
$425,000
1 bed1 bath786 sq ft
700 S Front St Unit E201, Issaquah, WA 98027
Listing provided by NWMLS as Distributed by MLS Grid
An unbelievable location in downtown Issaquah next to restaurants, theaters, live music & nature - this condo has it all! Stunning & sweet this two-bedroom condo is full of quality upgrades. Sleek bamboo hardwoods throughout, stylish interior colors, upgraded lighting & more. Oversized kitchen with large eating area features new quartz counters, quality cabinetry, updated backsplash, new sink & faucet. Two sizable bedrooms filled with light have custom closet systems & scenic outlooks. Distinctive custom vanity in full bathroom along with newer flooring, new lighting & paint. A rare opportunity to be in the center of everything that makes Issaquah special
$399,000
2 beds1 bath828 sq ft
210 SW Clark St Unit A201, Issaquah, WA 98027
Listing provided by NWMLS as Distributed by MLS Grid
Discover architectural elegance in this A-frame home nestled in the serene Mirrormont community. This hard-to-find style is perfectly designed to blend lodge-style charm w/ exposed beams accentuating high, peaked ceilings along w/ dramatic, floor-to-ceiling windows that offer views of beautiful, landscaped grounds. Enjoy using 2 decks to host a summer BBQ or quiet morning coffee or evening wine. Master suite on main w/ a connected bonus rm that could be used for. .. ? Upstairs, find 2 cozy bdrms +full bath & versatile open loft area; homework, home office? LL offers large fun/media rm you can adapt to any need + w/ full bath & 2nd kitchen, make a great MIL or 4th bdrm. Storage s
$1,198,500
3 beds3 baths3,000 sq ft0.91 acre (lot)
15601 258 Pl SE, Issaquah, WA 98027
Listing provided by NWMLS as Distributed by MLS Grid
Nestled in Issaquah’s Montreux neighborhood, Pacific Northwest at its best unfolds here. With over 3,800-square-feet, this Ben Leland designed home was built for gracious entertaining. Overlooking Lake Sammamish, picture windows showcase views of the Cascades framed by lush greenery, bringing the outdoors in while inviting ample daylight into the home. Warm chilly evenings with a wood-burning fireplace in the main living room, gather with friends for movie night in the theater room, or simply relax on the back patio as the sun sinks into the distance. Each room was crafted for ease, with spacious home office, wine cellar, large main floor primary bedroom with ensuite, and more. Sited
$2,499,999
3 beds3.5 baths3,860 sq ft0.49 acre (lot)
18208 NW Montreux Dr, Issaquah, WA 98027
Listing provided by NWMLS as Distributed by MLS Grid
Final Opportunity in Steve Burnstead's Coveted Mallard Pointe. Move in Ready Home features 5 bed | 3.25 bath | Rec-Room on a greenbelt backing lot. Open Concept Main floor flooded with natural light through floor to ceiling windows with Greenbelt/Mountain Views. Chefs kitchen with slab counters and custom tile opens to dedicated dining/living spaces. Lower level basement with covered view deck, rec room, and 2 additional guest bedrooms. Primary suite with sprawling vaulted Greenbelt Window Wall and spa like bath. 2 spacious secondary beds and well appointed utility room upstairs. Designer selected finishes throughout. Established community in Premier location. Luxury home by one of the regi
$1,898,000
5 beds3.5 baths2,826 sq ft2,790 sq ft (lot)
4295 216th Pl SE, Issaquah, WA 98029
Listing provided by NWMLS as Distributed by MLS Grid
Final Opportunity in Steve Burnstead's Coveted Mallard Pointe. Move in Ready Home features 5 bed | 3.25 bath | Rec-Room on a greenbelt backing lot. Open Concept Main floor flooded with natural light through floor to ceiling windows with Greenbelt/Mountain Views. Chefs kitchen with slab counters and custom tile opens to dedicated dining/living spaces. Lower level basement with covered view deck, rec room, and 2 additional guest bedrooms. Primary suite with sprawling vaulted Greenbelt Window Wall and spa like bath. 2 spacious secondary beds and well appointed utility room upstairs. Designer selected finishes throughout. Established community in Premier location. Luxury home by one of the regi
$1,898,000
5 beds3.5 baths2,826 sq ft2,790 sq ft (lot)
4297 216th Pl SE, Issaquah, WA 98029
Listing provided by NWMLS as Distributed by MLS Grid
This secluded one bedroom home is located on 1.51 acres in Issaquah. This small house on a huge lot offers endless possibilities for expansion and customization. Building your dream home + Keeping the blue house as a guest house? Plenty of room to park your RV, boat or other outdoor toys. Discover the perfect blend of privacy and convenience in this prime location, just minutes away from shopping and amenities. The perfect blend of comfort and space, this small house is a dream for those seeking peace and tranquility. Utilities available in street.
$1,399,000
1 bed1 bath820 sq ft1.51 acres (lot)
22122 SE 51st Pl, Issaquah, WA 98029
Listing provided by NWMLS as Distributed by MLS Grid
Enchanted world of unmatched quality and charm. Architecturally stunning, this Custom built home is nestled on 5+ acres in Black Nugget Estates. Unique open layout filled w/ large windows brings the natural beauty indoors while high ceilings and exposed beams add a touch of rustic elegance. The kitchen is a chef's delight boasting two prep islands and high end appliances. Spectacular outdoor kitchen addition just in time for summer entertaining. 5 generous bedrooms up and separate Guest quarters on the lower level offers privacy for out of town visitors. 3 zone heating, A/C, 3 car garage, Greenhouse and so much more. Discover your private sanctuary just minutes from I-90. Tranquility meets
$3,950,000
6 beds5.5 baths7,210 sq ft5.02 acres (lot)
26709 SE Old Black Nugget Rd, Issaquah, WA 98029
Listing provided by NWMLS as Distributed by MLS Grid
Rarely available street to lake level waterfront parcel with easy access. Gated entry. Circled driveway with additional huge parking lot. Beautiful koi pond. Elegant round greenhouse. Long level yard with beautiful flowers and fruit trees. Newly remodeled home with huge deck. New roof, windows & doors, new insulation, new kitchen and 2 bathrooms, newly installed gas and water line, ac. Separate BBQ house and shop. Gorgeous Lake and Mountain view. Private dock. Convenient location, mins to I-90, Costco, State park, trails and schools. Great Issaqush school district. Move in immediately or build your Waterfront Mansion. Endless possibilities! Bring your vision!
$5,828,000
2 beds2 baths1,320 sq ft0.94 acre (lot)
5104 NW Sammamish Rd, Issaquah, WA 98027
Listing provided by NWMLS as Distributed by MLS Grid
Stunning 1st floor remodeled condo offers high end updates throughout. 2 bed/1.75 ba in highly desirable Rainier Bldg of WA Village. Designer kitchen features quartz counters and new SS appliances. Luxury hard surface flooring throughout. Primary suite with dual closets & custom updated bath featuring new floor, granite counters, and tiled shower with stone floor & frameless door. 2nd bedroom & updated bath. Neutral colors and quality features show throughout. Newer water heater & w/ d. Newer windows. Hall closet storage. Prime location near pea patch garden. Active fun neighborhood offers an indoor pool, gym, trails, pea patch, library, sport court, activities, club
$480,000
2 beds2 baths1,165 sq ft
4109 224th Ln SE #112, Issaquah, WA 98029
Listing provided by NWMLS as Distributed by MLS Grid
Charming fenced courtyard leads to this private one bedroom PLUS den home in popular Garden Village neighborhood. Spacious kitchen with breakfast nook opens to huge sunny patio to enjoy morning coffee. Vaulted ceilings and solartubes provide natural light to open living room, dining room and den. Cozy gas fireplace. Exceptional 12' x 18' primary suite with triple closets, new walk-in shower, room for sitting area or desk. Second full bath. Central A/C. Attached extra-large, one-car garage supplies loads of storage space plus driveway parking. Active Adult 55+ Community amenities include indoor pool + spa, clubhouse, tennis + pickle ball courts, library, pea patches, trails, transportation,
$499,950
1 bed2 baths1,198 sq ft
3656 225th Pl SE #2319, Issaquah, WA 98029
Listing provided by NWMLS as Distributed by MLS Grid
Welcome to this delightful mid-entry home close to Lake Sammamish! Tasteful renovations to the home's living & designer kitchen at the center of the home. Mainfloor master, updated baths, 2 over-sized bedrooms. Private 4th bedroom down with family room, office or workspace and step-out patio to fully fenced grounds. Walking distance to Meerwood, Timberlake Wft & nearby Blackberry park. And quick access to I-90 or local roads to more restaurants and shops!
$1,575,000
4 beds3 baths2,015 sq ft7,712 sq ft (lot)
18927 SE 42nd Pl, Issaquah, WA 98027
Listing provided by NWMLS as Distributed by MLS Grid
Just what you've been waiting for. .. 2 BD/2 BA level entry condo w/ sunny west exposure deck, peaceful greenbelt & trail access! Kitchen boasts stone countertops, tons of storage & sunny east exposure eating nook. Beautiful hardwoods flow to the living & dining room w/ electric fireplace, bay window seat, new carpet & access to deck. Primary bedroom suite features 2 double closets & bathroom w/ step-in shower. Guest bedroom w/ slider to deck & full bath are located down the hall. Fresh paint. Central AC! XL 1-car garage w/ additional parking & covered walkway to front door. Enjoy amenities & social activities including: indoor pool, clubhouse
$519,900
2 beds2 baths1,170 sq ft
4005 220th Pl SE #2127, Issaquah, WA 98029
Listing provided by NWMLS as Distributed by MLS Grid
Incredible 2 BD/2 BA/media room/2 car parking/Central AC! Beautiful open kitchen w/ stone counters, SS appl & large built-in office+nook space. Open design dining & living w/ coffered ceiling, built-in hutch, elegant gas fireplace & beautiful green views. Private deck off LR & large media room w/ French doors. Spacious primary suite w/ huge WIC, 3/4 bath & double vanity. Guest bedroom boasts WIC. Full bath located across the hall. Full size laundry w/ utility sink & storage. Close to garage elevator; extra storage room located on same floor. Live independently in a vibrant community of amenities & social activities incl: indoor pool, clubhouse, clas
$685,000
2 beds2 baths1,714 sq ft
4406 Providence Point Pl SE #211, Issaquah, WA 98029
Listing provided by NWMLS as Distributed by MLS Grid
Welcome to this stunning ground level unit in the coveted Sammamish Hills Condominiums. Spanning 879 SF, this home features 2 BR, 2BA, and new interior paint / carpets. The primary suite boasts a full bathroom and walk-in closet. The 2nd bedroom is generously sized. The bright and open kitchen has quartz counter tops, stainless steel appliances and ample cabinet storage, making it both functional and inviting. Step outside to the backyard patio that backs to a greenbelt, providing ultimate privacy. 1 covered parking spot and plenty of guest parking. Conveniently located, just mins away to DT Issaquah/Bellevue, I-90 and steps away to trails and parks. Zoned into award winning Issaquah School
$465,000
2 beds2 baths879 sq ft
18501 SE Newport Way Unit M152, Issaquah, WA 98027
Listing provided by NWMLS as Distributed by MLS Grid
Stylish 2bdrm 1.75 bath private corner unit move-in ready in the beautiful Prov. Pt. Renovated with modern designs, this home offers state-of-the-art recessed lighting throughout, a new kitchen/ appliances with a breakfast nook and dashing bathrooms. Private ground-level door steps into a formal entryway, leading to a spacious living and dining room, a fireplace, and access to a private patio surrounded by timeless trees. Windows with serene views and natural lights all around, this unit offers a primary suite with a double sink bath, 2nd large bedroom and full bath, hallways with ample closets, walk-in laundry/utility (new furnace), individual 1 car garage, and a detached storage room. The
$670,000
2 beds2 baths1,394 sq ft
4085 223rd Pl SE #1019, Issaquah, WA 98029
Listing provided by NWMLS as Distributed by MLS Grid
Sited in highly sought area in Issaquah. This meticulously maintained 2 bedroom, 2 bathroom condo is like new! Ample 1-car attached garage plus private exterior parking. New carpet, quartz counter tops, stainless steel appliances. Brand new W/ D. It is less than a mile away from shops and restaurants in the Issaquah Highlands and big stores like Home Depot, Best Buy, QFC, Safeway, QFC. Award winning schools & I-90 are minutes away. HOA due covers Water and Sewer.
$619,500
2 beds2 baths1,021 sq ft
5276 237 Ter SE, Issaquah, WA 98029
Listing provided by NWMLS as Distributed by MLS Grid
This beautiful 5-bedroom, 2.5-bathroom home is located in the highly sought-after Autumn Glen neighborhood, nestled on a private easement, ensuring privacy and seclusion. As you enter the home, you'll be greeted by vaulted ceilings that flow into the great room, features fresh carpets throughout. The kitchen has been thoughtfully renovated with stainless steel appliances, granite countertops and new hardware. The tiled bathrooms feature matching countertops, and the primary bedroom boasts an attached bath, custom shower and two walk-in closets. The exterior and interior have been freshly painted, and features a spacious wrap-around cedar deck, lifetime presidential roof, and plenty of priva
$1,785,000
5 beds2.5 baths2,600 sq ft6,296 sq ft (lot)
4660 244th Pl SE, Sammamish, WA 98029
Listing provided by NWMLS as Distributed by MLS Grid
No Special Assessment! Charming 1 bedroom/1 bath condo in the heart of downtown Issaquah. Significant building renovations just completed including new siding, decks, doors, windows, and roof. Updated kitchen w/ shaker cabinets and quartz counters, plank style laminate flooring, new carpet, and a beautifully remodeled bathroom w/ tile shower surround. Cozy up by your wood burning fireplace, or relax on your private deck looking out at the trees. In unit washer/dryer with a large utility closet, perfect for a pantry or extra storage. Walk to trails, restaurants, library, and transit in minutes. 1 assigned parking space plus plenty of guest parking. No rental cap, don't miss this one!
$348,000
1 bed1 bath648 sq ft
230 SW Clark St Unit C303, Issaquah, WA 98027
Listing provided by NWMLS as Distributed by MLS Grid
Based on information submitted to the MLS GRID as of Sat Apr 27 2024. All data is obtained from various sources and may not have been verified by broker or MLS GRID. Supplied Open House Information is subject to change without notice. All information should be independently reviewed and verified for accuracy. Properties may or may not be listed by the office/agent presenting the information. Some IDX listings have been excluded from this website.
This area's enrollment policy is not based solely on geography. Please check the school district website for more information.
Elementary schools
Middle schools
High schools
GreatSchools Summary Rating
9/10
Endeavour Elementary School
Public, K-5
9/10
Grand Ridge Elementary School
Public, K-5
8/10
Challenger Elementary School
Public, K-5
7/10
Clark Elementary School
Public, K-5
6/10
Issaquah Valley Elementary School
Public, K-5
School data is provided by GreatSchools, a nonprofit organization. Redfin recommends buyers and renters use GreatSchools information and ratings as a first step, and conduct their own investigation to determine their desired schools or school districts, including by contacting and visiting the schools themselves.Redfin does not endorse or guarantee this information. School service boundaries are intended to be used as a reference only; they may change and are not guaranteed to be accurate. To verify school enrollment eligibility, contact the school district directly.
Homes for sale in Issaquah have a median listing price of $875K. Some of these homes are Hot Homes, meaning they're likely to sell quickly.
What are some of the most popular neighborhoods in Issaquah?
Popular neighborhoods include Pine Lake, Greenwood Point, Klahanie, Montreux, Olde Town, North Issaquah, Issaquah Highlands, Downtown Issaquah, Squak Mountain, and Providence Point.
Issaquah, Washington boasts a well-structured transportation system that supports both car travel and public transit. The city experiences moderate traffic levels, making driving a viable option for residents. For those who prefer public transportation, Issaquah is served by King County Metro Transit and Sound Transit, offering convenient bus services. Additionally, the city is in close proximity to major highways, including Interstate 90, providing easy access for car travel to neighboring areas. Learn more on our Issaquah city guide.
What types of properties are available in Issaquah?
Issaquah, Washington offers a variety of single-family home types, including ranch-style, split-level, and contemporary homes. These homes can be found throughout the city, including neighborhoods such as Talus, Montreux, and Issaquah Highlands. Most properties feature three to five bedrooms and were built between the 1970s and the present day. To explore different property types for sale in Issaquah, Washington, use the 'Home type' filter located above the active listings. Customize your search by selecting options like single-family homes, condos, townhomes, and more.
What is life like in Issaquah?
Issaquah, Washington offers a unique living experience with its picturesque surroundings. The landscape is characterized by stunning natural beauty, including lush green forests, majestic mountains, and cascading waterfalls. The weather in Issaquah is known for its mild summers and cool winters, providing a pleasant climate throughout the year. There are diverse job opportunities available in various industries, ranging from technology and healthcare to retail and hospitality. Residents can enjoy a wide range of recreational activities, such as hiking, biking, fishing, and exploring the numerous parks and trails in the area.
What are the schools and amenities like in Issaquah?
Issaquah, Washington offers a variety of public amenities to cater to the needs of its residents. The city is home to several restaurants, providing a range of dining options. There are also numerous parks available for outdoor enjoyment and relaxation. For everyday shopping needs, residents can visit one of the many grocery stores located throughout the city. Additionally, Issaquah offers other amenities such as libraries, gyms, and community centers.
In the past month, 63 homes have been sold in Issaquah. In addition to houses in Issaquah, there were also 46 condos, 17 townhouses, and 1 multi-family unit for sale in Issaquah last month. Issaquah is a minimally walkable city in King County with a Walk Score of 31. Issaquah is home to approximately 29,419 people and 20,459 jobs. Find your dream home in Issaquah using the tools above. Use filters to narrow your search by price, square feet, beds, and baths to find homes that fit your criteria. Our top-rated real estate agents in Issaquah are local experts and are ready to answer your questions about properties, neighborhoods, schools, and the newest listings for sale in Issaquah. Our Issaquah real estate stats and trends will give you more information about home buying and selling trends in Issaquah. If you're looking to sell your home in the Issaquah area, our listing agents can help you get the best price. Redfin is redefining real estate and the home buying process in Issaquah with industry-leading technology, full-service agents, and lower fees that provide a better value for Redfin buyers and sellers.


 REDFIN IS COMMITTED TO AND ABIDES BY THE FAIR HOUSING ACT AND EQUAL OPPORTUNITY ACT. READ REDFIN'S FAIR HOUSING POLICY AND THE NEW YORK STATE FAIR HOUSING NOTICE.
 United States
 Canada