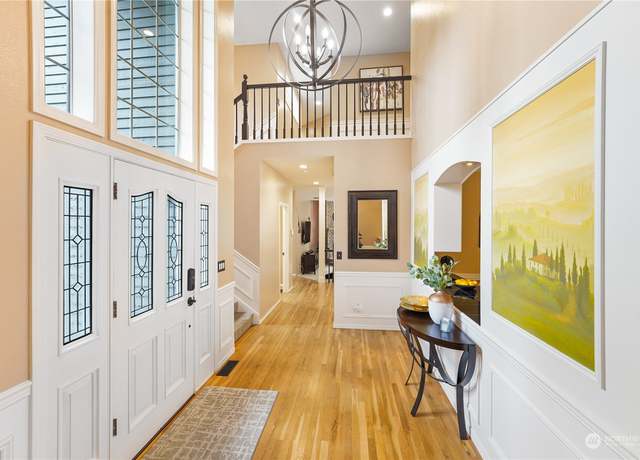
Evergreen, nestled within the Mill Creek Country Club, stands out as the premier neighborhood. Surrounded by scenic parks, winding paved trails, and a pristine greenbelt, this coveted Evergreen home exudes timeless elegance and practicality. Let the soothing sounds of the water fountain envelop you as you revel in complete privacy and expansive open spaces. Notable features include a stunning chef’s kitchen with granite island, a 5-burner gas range, an inviting family room with a focal fireplace, meticulously designed formal dining & living areas, butlers' pantry, four spacious bedrooms plus a main floor office with built-ins, and beautiful vaulted ceilings. The unique trail nex
1/40
$1,650,000
4 beds3 baths3,586 sq ft0.30 acre (lot)
15022 16th Ave SE, Mill Creek, WA 98012
Listing provided by NWMLS as Distributed by MLS Grid
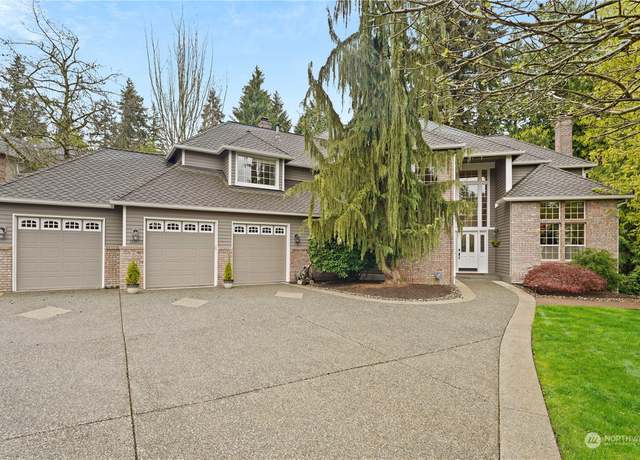
This beautiful home offers the convenience of the city and the serene privacy of the country. Sited on approx 14 Acres. 3 LARGE Bedrooms PLUS a very large Bonus room/possible 4th bedroom. The Primary Suite has a separate shower and soaking tub. All bedrooms are on the upper floor and feature brand-new carpeting. The main floor features a Great Room floor plan with Living, Dining, and, Kitchen areas, as well as a home office. Beautiful granite countertops and a large kitchen island. Stainless steel appliances, propane cooking, and propane fireplace and, 240v EV charging outlet in the 3 car garage. Your backyard oasis has a large covered patio with a beautiful territorial view of 14 acres of
1/38
$1,300,000
4 beds2.5 baths2,810 sq ft14.11 acres (lot)
1507 136th St SE, Mill Creek, WA 98012
Listing provided by NWMLS as Distributed by MLS Grid
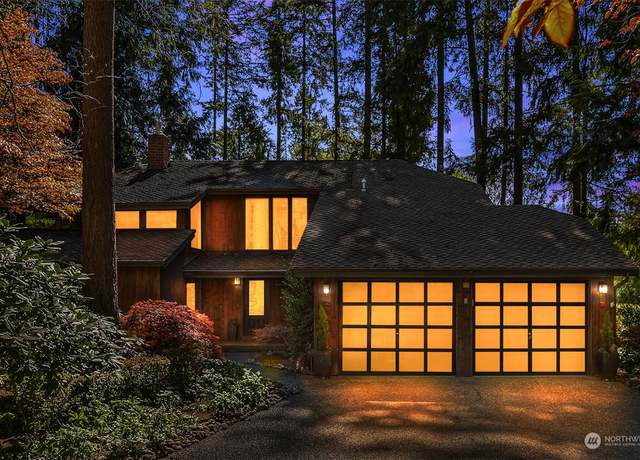
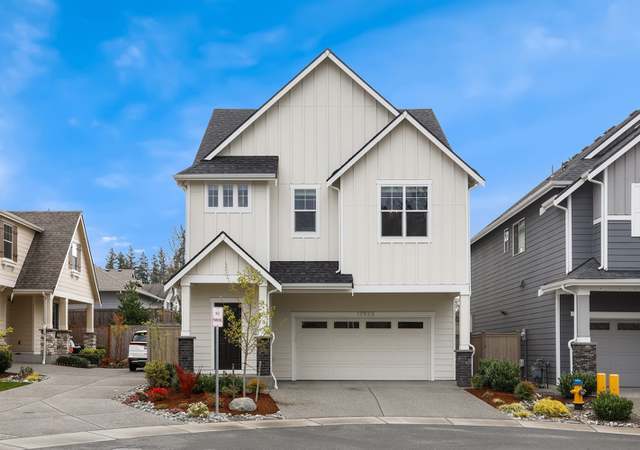
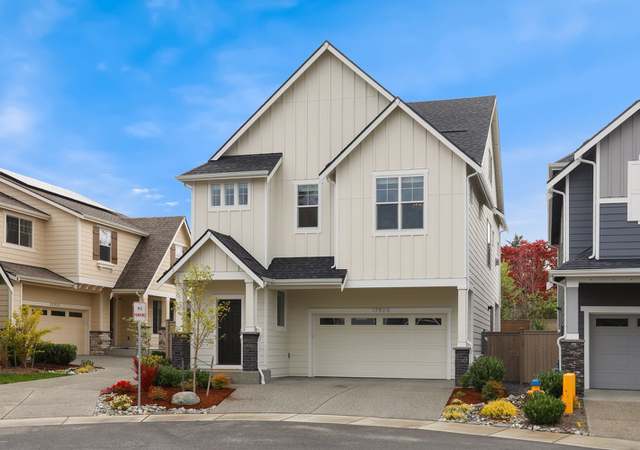
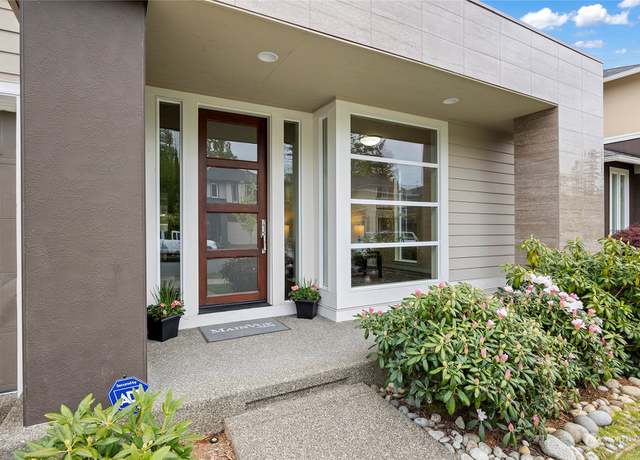
Timeless Northwest Contemporary home in Mill Creek. This light-filled home exudes modern charm and is equipped w/ all the latest amenities. The main floor boasts a spacious great room with hardwood flooring, a newly remodeled chef’s kitchen w/ high-end appliances, quartz countertops and eat in bar. An entertainment deck off the kitchen leads to a fully landscaped backyard overlooking a golf course. The outdoor space is ideal for intimate gathering and entertaining. A formal living, dining room and a utility room completes the main floor. Upstairs, you'll find a stunning primary suite w/ a spa-like bathroom, along with 3 additional bedrooms, and a remodeled bath. A 2 car garage with at
1/40
$1,425,000
4 beds2.5 baths2,735 sq ft0.23 acre (lot)
2324 150th Ct SE, Mill Creek, WA 98012
Listing provided by NWMLS as Distributed by MLS Grid
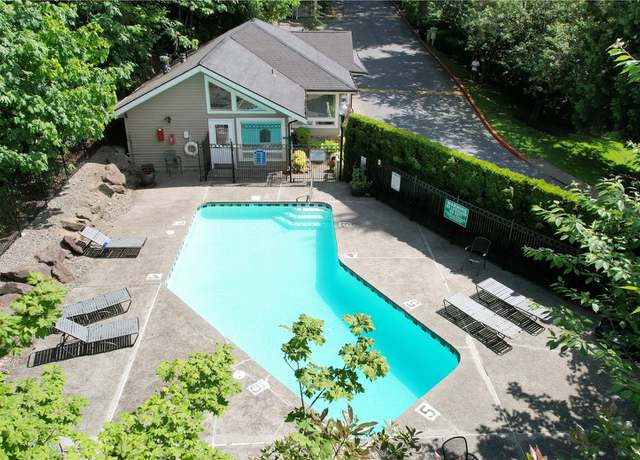
It’s all about the location! This move in ready 3-bed/2-bath TOP FLOOR CORNER UNIT is across from the MCTC, Town & Country Market, restaurants & shops+NO RENTAL CAP. Vaulted ceilings & filled w/ natural light this open concept home is warm & inviting. The kitchen has ample cabinet & counter space w/ granite & SS appls open to dining area & spacious family room w/ FP & slider to your private deck backing to green space. Large Primary w/ ensuite full bath is private & peaceful w/ views of the greenbelt. 2 more good sized beds & full bath. 2 assigned parking spaces-1 covered. Extra storage on patio. Enjoy the amenities:Pool, Cab
1/22
$484,900
3 beds2 baths1,077 sq ft
16101 Bothell Everett Hwy Unit C304, Mill Creek, WA 98012
Listing provided by NWMLS as Distributed by MLS Grid
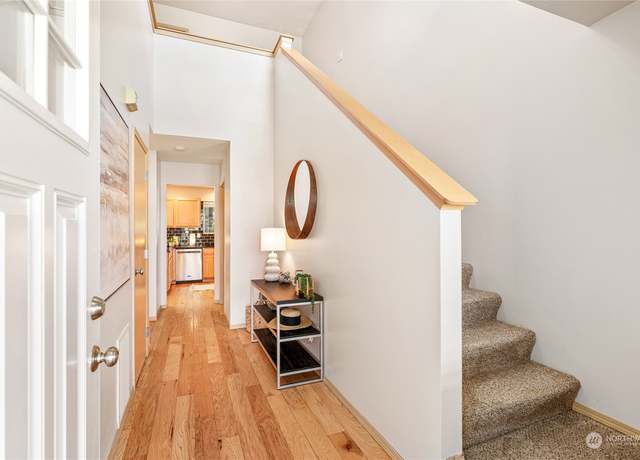
Welcome Home to Copper Tree!! This Loft style Townhome features 2 bedrooms and 2 bath. Vaulted Ceilings in the living room, Loft style Primary Suite on Upper level & great size Main floor bedroom with adjacent full bath. Fully fenced front courtyard and backyard with raised garden beds ready for your creativity. This location has so much to offer. Out the backyard gate you run right into paved walking trails that are part of 120 Acre Nature Preserve maintained by Mill Creek Community Association. The Mill Creek Golf Country, Swimming & Tennis Clubs are all close by. Mill Creek Town Center, local restaurants and so much more!
1/35
$700,000
2 beds2 baths1,839 sq ft
15800 Village Green Dr #7, Mill Creek, WA 98012
Listing provided by NWMLS as Distributed by MLS Grid
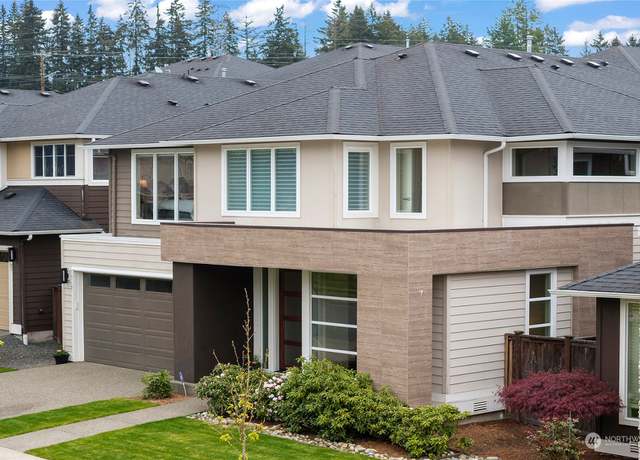
Overlooking a protected greenbelt, this magnificent John F Buchan resale in the River Crossing community is hard to come by. Timeless architecture w/ bright, open layout is designed to optimize privacy & view of the scenic nature preserve from all living areas. 4 bed/2.5 bath w/ bonus room boasts grand entry w/ dramatic ceilings, office/bedroom on main, expansive real hardwood floors, great room w/ gas fireplace, extensive stone & wood work, chef’s dream kitchen w/ custom cabinetry, double pantry, wrought iron spindle staircase, primary suite w/ walk in closet, 5-piece bath w/ soaking tub, built-in closets in every room, 3-car garage, A/C. 5 houses away from community play
1/29
$1,580,000
4 beds2.5 baths3,000 sq ft6,970 sq ft (lot)
14521 3rd Dr SE, Mill Creek, WA 98012
Listing provided by NWMLS as Distributed by MLS Grid
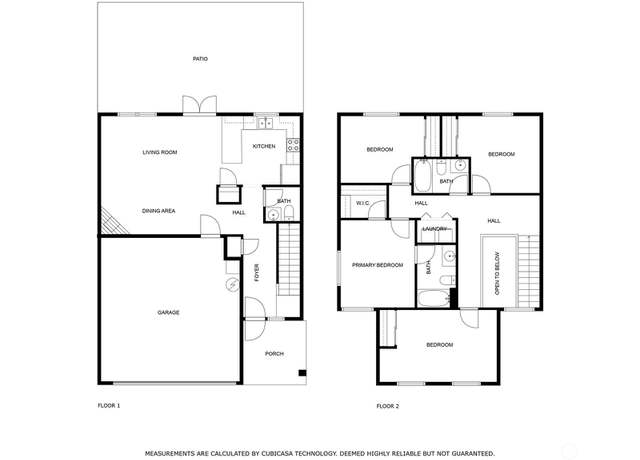
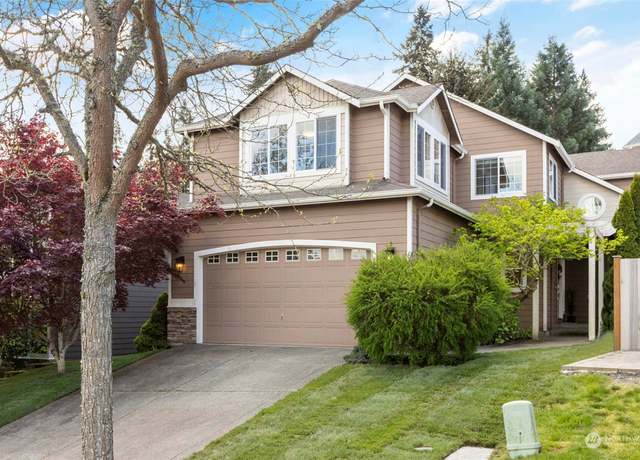
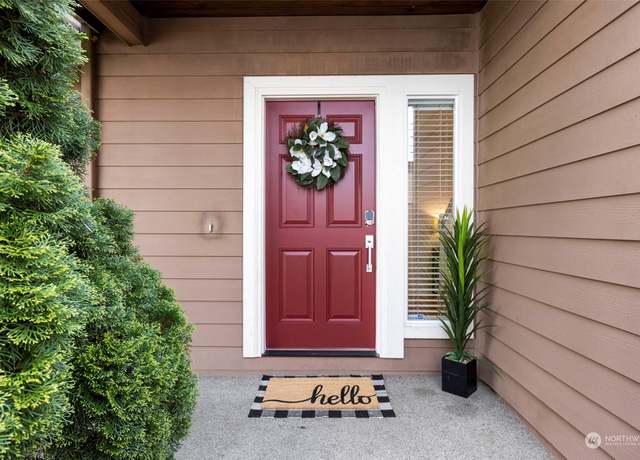
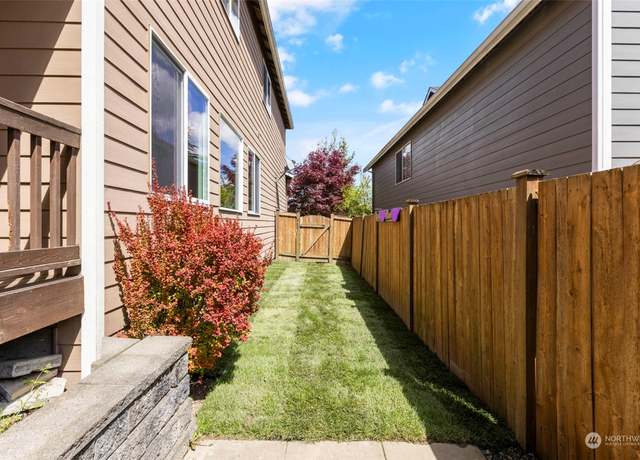
Step into this newly constructed townhome offering a comfortable 2,549 sqft of contemporary luxury. The ground floor presents a generously sized bonus room and entry, all leading to the second level with chef's kitchen, high-end appliances, hardwood floors, half bath, an open spacious living and dining area, and deck. The third floor has a generously sized primary bedroom with WI closet and opulent bathroom featuring a shower, soaking tub, double vanities, and smart mirror. Two additional bedrooms and a practical laundry room complete this exceptional home. All appliances included, ductless heat/AC and high-efficiency hot water tank for your comfort. With 3 bedrooms and 2.5 baths, this new
1/37
$860,000
3 beds2.5 baths2,549 sq ft2,683 sq ft (lot)
13124 12th Dr SE Unit A, Everett, WA 98208
Listing provided by NWMLS as Distributed by MLS Grid
Welcome to St Moritz, a stunningly maintained condominium located in the heart of Mill Creek. This 3 bedroom 1.75 bath has just had some magical updates including new carpet, new paint, extended kitchen space and cabinets and a beautifully newly added walk in closet in the primary bedroom. From your first steps into this home, this entrance opens to spacious and welcoming layout that has the perfect space for entertaining. Enjoy your colder nights around the cozy fireplace and in the summer days enjoy your covered patio deck with all the feels of a PNW breeze. St Moritz is in close proximity to the local Country Club, golf courses, tennis courts, and numerous trails for your daily dose
1/24
$585,000
3 beds2 baths1,518 sq ft
15512 Country Club Dr Unit B-36, Mill Creek, WA 98012
Listing provided by NWMLS as Distributed by MLS Grid
Step into this newly constructed townhome offering a comfortable 2,549 sqft of contemporary luxury. The ground floor presents a generously sized bonus room and entry, all leading to the second level with chef's kitchen, high-end appliances, hardwood floors, half bath, an open spacious living and dining area, and deck. The third floor has a generously sized primary bedroom with WI closet and opulent bathroom featuring a shower, soaking tub, double vanities, and smart mirror. Two additional bedrooms and a practical laundry room complete this exceptional home. All appliances included, ductless heat/AC and high-efficiency hot water tank for your comfort. With 3 bedrooms and 2.5 baths, this new
1/34
$860,000
3 beds2.5 baths2,549 sq ft2,683 sq ft (lot)
13128 12th Dr SE Unit B, Everett, WA 98208
Listing provided by NWMLS as Distributed by MLS Grid
Welcome to this timeless gem! Nestled in tranquil River Crossing community, this 2006 John Buchan home offers harmonious blend of elegance and comfort. 10-minute stroll takes you to the vibrant Mill Creek Town Center, over 70 stores and restaurants. Step inside through grand entryway, opened great room boasts stoned fireplace & built-in shelf. French door den with Lg WIC, can be 5th BR. Crown molding graces formal dining room, Chef’s kitchen features slab granite countertops, top-of-the-line SS appliances, and walk-in pantry. Upstairs, discover spacious primary ensuite with large tiled shower, offering a private retreat. Bonus room and 3 BR. Tandem 3 car garage. Heat pump for A/
1/40
$1,650,000
4 beds3.5 baths3,334 sq ft6,534 sq ft (lot)
225 146th Pl SE, Mill Creek, WA 98012
Listing provided by NWMLS as Distributed by MLS Grid
Single family detached home located next to the popular Mill Creek Town Center. This rarely available 3-bedroom home is just a short walk from shopping, restaurants, and LA Fitness. This beautiful, abundant light-filled home is move-in ready with freshly painted walls, stainless steel appliances, granite countertops, and recently installed beautiful flooring. Open Great Room floor plan that is perfect for entertaining. Small patio and garden in the backyard that gets plenty of sun. Numerous trails and amenities nearby for those who enjoy a walkable lifestyle. Attached garage and driveway parking for a total of 2 cars. Street parking is also available.
1/19
$889,950
3 beds2.5 baths1,617 sq ft2,178 sq ft (lot)
823 148th Pl SE, Mill Creek, WA 98012
Listing provided by NWMLS as Distributed by MLS Grid
Welcome to an exceptional, fully remodeled move-in-ready great room concept home! Boasting an expansive 11,209 sq ft lot perfect for an already planned space for an ADU or RV. The 550 sq ft garage, permitted as living space can be used as a MIL, Gym or additional utility room making this home 2,326 sq ft. of living space. Featuring 3 beds, 2.5 baths, and ample parking, it's an ideal haven for multi-generational living. Close proximity to amenities, and a convenient bus line, makes this a unique and very versatile home. The upgraded kitchen is modern with an island, stainless steel applicances and granite countertops. Composite decks require minimal maintenance. New furnace/ heat pump/AC an
1/35
$978,878
3 beds2.5 baths2,326 sq ft0.26 acre (lot)
13331 Seattle Hill Rd, Snohomish, WA 98296
Listing provided by NWMLS as Distributed by MLS Grid
2% Builder credit and special financing with preferred lender. Step into this newly constructed townhome offering a comfortable 2,549 sqft of contemporary luxury. The ground floor with large bonus room and entry leading to the second level with chef's kitchen, high-end appliances, hardwood floors, half bath, an open spacious living/dining area, and deck. The third floor has a generously sized primary bedroom, WI closet, opulent bathroom featuring a shower, soaking tub, double vanities, and smart mirror. Two additional bedrooms and a practical laundry room complete this exceptional home. All appliances included, ductless heat/AC and high-efficiency hot water tank. 3 bedrooms and 2.5 baths, t
1/33
$860,000
3 beds2.5 baths2,549 sq ft1 sq ft (lot)
13124 12th Dr SE Unit B, Everett, WA 98208
Listing provided by NWMLS as Distributed by MLS Grid
Incredible single-family or potentially multi-family building change near Silver Lake! This flat, level lot with awesome surrounding with businesses, parks, golf, and park and drive. Opening building site with existing water, power, and sewer available across the street. Property had single-wide for a long time; it was then cleared, leveled and ready for new owner with a vision! Existing & updated 2-bedroom septic is ready for use! Excellent location very close to Mill Creek Town Center, I-5, restaurants & shopping centers.
1/21
$380,000
— beds— baths0.32 acre (lot)
13121 12th Dr SE, Everett, WA 98208
Listing provided by NWMLS as Distributed by MLS Grid
Mill Creek Cul-de-sac lot located in serene neighborhood minutes from Mill Creek Town Center, grocery stores, MC country club and freeway access. Great secluded location to build your dream home. Plenty of treed open space to East of the property creating a bit more privacy. Please park in cul-de-sac when viewing property if possible.
1/13
$224,950
— beds— baths0.28 acre (lot)
502 158th St SE, Mill Creek, WA 98012
Listing provided by NWMLS as Distributed by MLS Grid
There is a great opportunity for residential building on this LDR Zoned property in a well-maintained, established neighborhood. First time on the market in 45 years. Just inside the Mill Creek city limits. Buyer to verify all information. See sketches/pictures in supplements.
1/2
$975,000
— beds— baths1.91 acres (lot)
0 XXX 143rd St SE, Mill Creek, WA 98208
Listing provided by NWMLS as Distributed by MLS Grid
Stunning Bothell home, boasting quality craftmanship throughout! Built in 2021, the home has been impeccably-maintained & boasts a lower level family room, 3/4 bath, & bedroom with access to the fenced yard & covered patio. Head up to the open main level w/ ample natural light, a powder room, laundry, & the primary suite w/ 2 walk-in closets & a dazzling 3/4 bath. Living room + modern gas fireplace, sunny dining area, & designer kitchen w/ quartz counters, center island, tile backsplash, walk-in pantry, farmhouse sink, & high-quality stainless steel appliances. Upstairs is a loft/bonus room, 2 more bedrooms, & a full bath. Tankless water heater, ce
1/45
$1,275,000
4 beds3.5 baths2,721 sq ft3,049 sq ft (lot)
17925 31st Dr SE, Bothell, WA 98012
Listing provided by NWMLS as Distributed by MLS Grid
This immaculate 3,908 sq ft home is nestled in the sought after Parkhaven community of Bothell. The home presents a blend of style, comfort, & functionality. It has every luxury upgrade available w/ a stunning open floor plan. From the soaring ceilings to the high end finishes this home will not disappoint. It features 4 bdrms, 4.5 bths. The large island kitchen is every entertainers & chef's dream. A huge walk-in pantry & a wonderful butler's pantry complete the kitchen. Upstairs are 4 spacious bedrooms, 3 w/ en-suite bths, a spacious flex room & the laundry room. A short stroll leads you to a community park, complete w/ sports fields, children's play area, a dog par
1/39
$1,750,000
4 beds4.5 baths3,908 sq ft4,356 sq ft (lot)
16925 40th Ave SE, Bothell, WA 98012
Listing provided by NWMLS as Distributed by MLS Grid
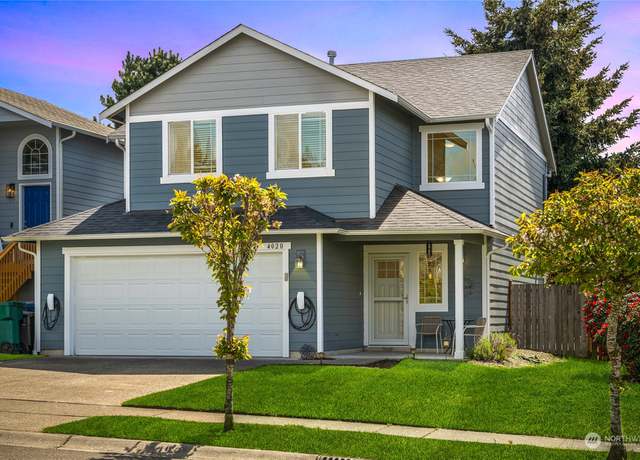
Sensationally chic & spacious w/ comfort! Vast open layout, dramatic 2-story entry, lrg wndws & 4 light-filled bdrms. Recent major remodeling w/ over $60k spent -NEW roof, paint inside & out, wide plank wd floors, washer, dryer & hot water heater, bathrms. Newly updated Chef's kitchen boasting new stainless-steel appliances, quartz counters, designer backsplash. Smart home/ Nest & 2 EV chargers. Sizeable family room w/ gas FP, flr-to-ceiling tile surround. Primary suite W/ I closet. Oversize patio, BBQ grill & built-in storage or doghouse. Roomy 2-car gar w/ blt-in storage. Min's to Mill Creek Town Ctr, Flower World, shoppings, restaurants & steps to
1/28
$815,000
4 beds2.5 baths1,659 sq ft3,360 sq ft (lot)
4020 152nd Pl SE, Bothell, WA 98012
Listing provided by NWMLS as Distributed by MLS Grid
Welcome to North Creek Meadows where you'll find a home that is flooded with natural light, high ceilings & large rooms. True hardwood floors lead to the bright kitchen with room for a 2nd dining space, extra living space & enough room at the center island too! The impressive living room adds to the grandiosity to the home with tall windows & a gas fireplace. Upstairs through French doors is the primary room with its spacious 5 piece en suite and additional 3 bedrooms. The 4th bedroom is oversized & could be the perfect 2md primary or rec room. Equipped with high tech cabling, working from home is easier & it's only minutes from 405, I5 & the new new ligh
1/36
$1,099,998
4 beds2.5 baths2,368 sq ft5,227 sq ft (lot)
17010 4th Ave SE, Bothell, WA 98012
Listing provided by NWMLS as Distributed by MLS Grid
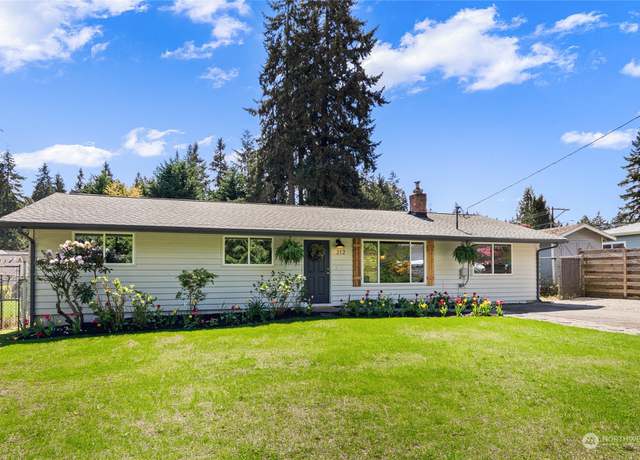
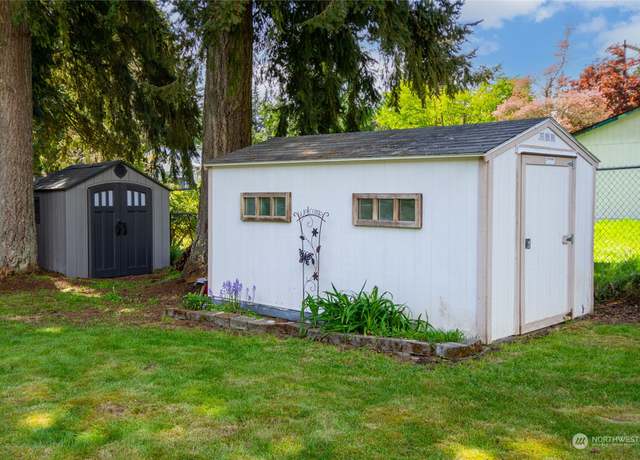
Situated in a quiet cul-de-sac, this well-maintained rambler is move-in ready. Freshly painted, with new carpet and vinyl plank flooring throughout. Enjoy your quiet backyard oasis with Trex decking. Turn the cute shed out back into a she-shed or work-from-home space. Inside are 3 beds and 2 baths with heated tile floors and oversized soaking tubs. Master bedroom with sitting area and ensuite. A cozy fireplace in the living room and huge bonus room make this a true four-seasons space. Enjoy a cup of tea by the fire in the winter. Have your friends over for the big game. In summer, host friends for a BBQ on your large deck. This home is close to everything: shopping and restaurants at Mill C
1/28
$699,000
3 beds2 baths1,838 sq ft0.24 acre (lot)
212 135th St SE, Everett, WA 98208
Listing provided by NWMLS as Distributed by MLS Grid
Luxurious townhome END UNIT with three bedrooms PLUS an office! Surrounded by Native Protected Growth areas front and back gives the feeling of privacy in the city. Quality finishes throughout, quartz slab countertops with full backsplash in kitchen with stainless steel appliances. Large kitchen island seats four. Dining area seats six. Designer Belmont cabinets with undercounter lights. Electric Fireplace with LED flame and ember color settings. Large windows offer plenty of daylight. Full size laundry area upstairs. Large tandem garage, plentiful storage. A/C. Tambark Creek Elementary just down the street. Pre inspected.
1/38
$900,000
3 beds2.5 baths1,962 sq ft2,178 sq ft (lot)
17905 35th Ave SE Unit A1, Bothell, WA 98012
Listing provided by NWMLS as Distributed by MLS Grid
This stunning 2-story home boasts an ideal cul-de-sac location and an open floor plan flooded with natural light. Highlights include hardwood laminate floors, a gourmet chef's kitchen with granite counters and stainless steel appliances, and a cozy gas fireplace in the family room. The master suite offers a walk-in closet and elegant five-piece bathroom, while three additional bedrooms and updated baths with granite countertops ensure ample space and style. With excellent schools nearby, this home is a must-see!
1/23
$1,325,000
5 beds2.5 baths2,765 sq ft9,583 sq ft (lot)
16519 37th Dr SE, Bothell, WA 98012
Listing provided by NWMLS as Distributed by MLS Grid
The curb appeal is just the start with this home which is nestled in the highly sought after Spring Haven neighborhood! Find a light filled entryway with a bed/ensuite bath & walk-in closet to the right. Murphy bed stays! The large, well appointed kitchen with dining space is open to the great room. Use the flex space right off the kitchen for an office or homework station & the large 'drop zone' right off the garage for coats and back packs! The main level living spaces are extended by the over-sized & covered back deck for fun evenings outside. Upstairs you'll find a generous loft space, expansive primary with ensuite and walk-in closet, along with 3 additional roomy be
1/39
$1,275,000
5 beds3.5 baths2,940 sq ft5,226 sq ft (lot)
3712 129th Pl SE, Everett, WA 98208
Listing provided by NWMLS as Distributed by MLS Grid
Beautifully updated home in move-in ready condition! Kick back, relax & enjoy privacy of enchanted backyard w/ peaceful creek, tenderly landscaped & partially fenced. This lovely home has upgrades galore: newer roof, quality bamboo & laminated floors, interior & exterior paint, stamped driveway, new water heater & much more. Main Level sunlit floorplan has inviting living w/ wood fireplace, Gourmet kitchen w/ cherry cabinets, SS appliances & opulent dining leading to huge deck overlooking lush backyard; Primary bed w/ walk-in closet & en-suite Bath w/ heated floors; 2 add Beds & 3/4 Bath w/ heated floors. Multifunctional Lower level w/ endless
1/33
$1,052,000
6 beds3 baths2,688 sq ft0.45 acre (lot)
13911 Meridian Dr SE, Everett, WA 98208
Listing provided by NWMLS as Distributed by MLS Grid
Indulge in beauty and tranquility in this 4-bed home nestled in a park-like setting on a cul-de-sac. With double primary bedrooms & private decks, including one on the main level with a newly remodeled walk-in shower, both convenient and flexible. The light-filled living room features a stunning fireplace. The spacious kitchen and bathrooms boast NEW quartz counters, NEW stainless appliances & backsplash. Fresh paint inside and out, 50-year roof, park-like fully fenced yard (NEW fencing), Air conditioning. Don't miss the tucked away "retreat area" {not included in sq footage!} & a one-year home warranty included, offering serenity and peace of mind. Enjoy easy ac
1/26
$1,050,000
4 beds2 baths2,476 sq ft0.36 acre (lot)
12921 49th Dr SE, Everett, WA 98208
Listing provided by NWMLS as Distributed by MLS Grid
It's all about location! This 3 bed 2.75 bath 2019 townhome is conveniently located just off of 132nd and close to shopping, I-5 access, Amazon Go and much more. Home is 1,490 sq. ft. with large kitchen w/ breakfast bar, half bath on the 2nd floor, and open concept. 3rd floor has 3 bedrooms or can be 2 beds and a home office. The primary bedroom has large walk-in closet, tile floor primary bathroom, and a large shower. Home features 2nd floor balcony and main floor patio, quartz countertops, luxury vinyl plank, fireplace and a ductless heating and cooling unit. Garage is a very large tandem easily fitting 2 vehicles, room for toys/projects and wired for electric car. Community features off
1/22
$650,000
3 beds2.5 baths1,490 sq ft1,742 sq ft (lot)
12718 35th Ave SE Unit A3, Everett, WA 98208
Listing provided by NWMLS as Distributed by MLS Grid
Welcome to Brookside Estates home 5bed +2.75 bath & 3-car garage (WOW), where luxury living meets suburban charm! Adjacent to prestigious Cedarwood Elem & Tambark Park, it offers an unparalleled lifestyle. Step into the expansive great room, where soaring ceilings in the foyer & dining room evoke a sense of opulence. Unleash your culinary prowess in the gourmet kitchen, a haven for epicureans. Upstairs, discover three spacious bedrooms, including a primary suite with a lavish bath & walk-in closet. Meticulously upgraded with fresh interior paint, new carpets, and a newly added shower bath on the main floor, this home exudes luxury. Enjoy enchanting evenings on the new
1/31
$1,425,000
5 beds3 baths2,621 sq ft4,792 sq ft (lot)
3126 171st Pl SE, Bothell, WA 98012
Listing provided by NWMLS as Distributed by MLS Grid
Experience luxury living with this east-facing marvel. High ceilings and hardwoods set the stage throughout the great room, designed for entertaining. Gather around the striking floor-to-ceiling tile fireplace with access to the deck and expansive windows bathing the room in natural light. The open kitchen is adorned with a grand quartz island, designer backsplash, and stainless-steel appliances. The home boasts 2 primary suites with 5-piece baths, one on main, other on upper. The floorplan offers flexibility with a lower floor office/bedroom, an upper-level bonus loft, and 2 additional bedrooms up. Positioned close to Mill Creek Town Center and parks, with easy access to highways, this hom
1/38
$1,500,000
5 beds3.5 baths3,450 sq ft5,227 sq ft (lot)
17604 3rd Ave SE, Bothell, WA 98012
Listing provided by NWMLS as Distributed by MLS Grid
Nestled in the heart of Bothell, this spacious split-level home offers an ideal blend of comfort and style. Boasting 5 bedrooms and 3 baths across 2,636 sqft of living space, it's designed for both relaxation and entertainment. The open-concept living areas are bathed in natural light, highlighting the elegant finishes throughout. The master suite provides a tranquil retreat, while the additional bedrooms offer ample space for guests. Outside, the property features beautifully landscaped grounds, perfect for outdoor gatherings. This home combines the peace of suburban living with convenient access to Bothell's amenities, making it a must-see for those seeking a blend of space, comfort,
1/24
$1,050,000
5 beds3 baths2,636 sq ft6,534 sq ft (lot)
15317 Sunset Rd, Bothell, WA 98012
Listing provided by NWMLS as Distributed by MLS Grid
Abbey Road townhome gem! Main level features a cozy gas fireplace in the living room, 9' ceilings, and a well-appointed kitchen with granite slab countertops and breakfast bar. Upstairs, a luxurious master suite with vaulted ceilings, ensuite bath, den nook, and convenient laundry. The lower level boasts a spacious bonus room with surround sound speakers, ideal for guests or entertainment. Plus, a one-car garage, patio, and 3 parks. Only a mile from Mill Creek Town Center, with easy access to I-5 & 405. VA/FHA/conventional. Broker Remarks
1/35
$699,990
2 beds2.5 baths1,754 sq ft2,000 sq ft (lot)
16510 2nd Dr SE, Bothell, WA 98012
Listing provided by NWMLS as Distributed by MLS Grid
Make yours this Lovely home in Martha Lake neighborhood! With Full remodeled Kitchen, Quartz Countertops. With three bedrooms and 2 baths completely remodeled, with a cozy living room and a dinning room in a open space concept with Luxury Vinyl Floors. Brand new Paint Interior and Exterior, new Garage Epoxy Floor and new Carpet for All Bedrooms, new Insulation in Attic and Crawl Space, Brand New Furnace and Water Heater!
1/37
$854,995
3 beds2 baths1,777 sq ft0.43 acre (lot)
4 143rd St SE, Lynnwood, WA 98087
Listing provided by NWMLS as Distributed by MLS Grid
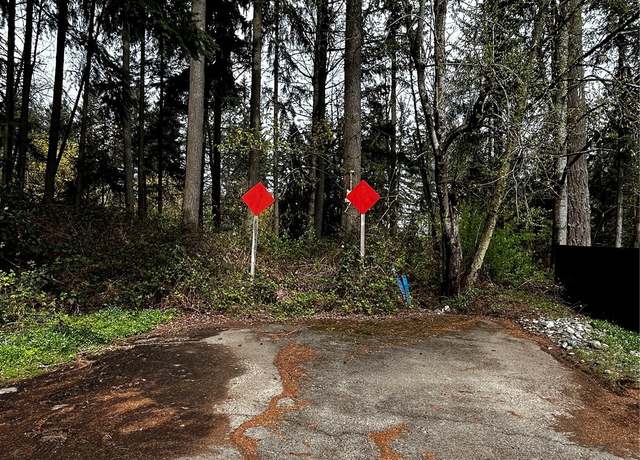
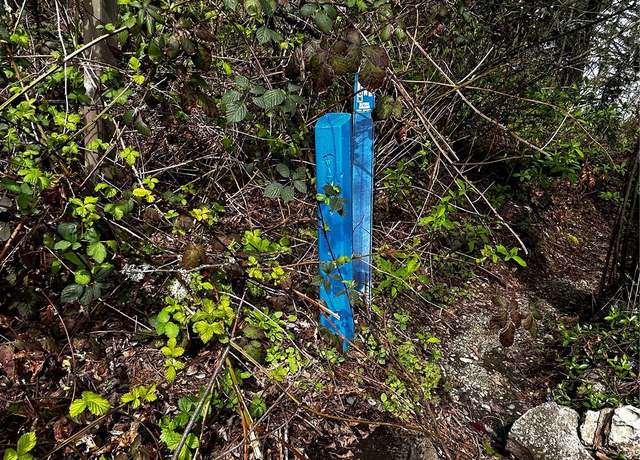
INVESTOR ALERT! Come check out this south Everett home and all of it's potential. 2 bedrooms and 1 bath with a great floor plan. This property has great bones but the house is in need of a cosmetic update. Bring your imagination and a paint brush and turn this into your future home, or an exciting rental. The large lot is backed up to McCollum park and it's walking trail giving the property a wonderful secluded feel. Minutes off of freeway and close to restaurants and shopping. Buyer to verify future lot density.
1/16
$545,000
2 beds1 bath768 sq ft0.31 acre (lot)
232 135th St SE, Everett, WA 98208
Listing provided by NWMLS as Distributed by MLS Grid
Amazing opportunity to own in Sherwood Village. This lovely home in Sherwood Village is completely updated throughout. It features a modern kitchen with stainless steel appliances, quartz countertops, and an abundance cabinets and storage. The rest of the home keeps the modern theme with luxury vinyl plank throughout and white millwork. Both 3/4 baths feature large walk-in showers with rain shower heads. Large covered porch allows you plenty of space for a grill so you can stay dry on those wet PNW days. Community is owned collectively by the individual unit owners.
1/13
$330,000
3 beds2 baths1,152 sq ft7.46 acres (lot)
3504 Seattle Hill Rd #9, Mill Creek, WA 98012
Listing provided by NWMLS as Distributed by MLS Grid
Discover an expansive and picturesque property in Bothell, spanning over 8 acres. The enchanting beauty of this land awaits your exploration. Please note that no studies have been conducted, so we encourage the buyer to independently verify all information. Strategically located between Highway 9 and I-5, this property offers a prime location with convenient access. The existing manufactured home on the premises adds potential, although its condition is currently unknown. To truly appreciate this remarkable property, appointments are necessary for access. Kindly reach out to the listing agent to schedule a visit. We look forward to assisting you in discovering the possibilities that await o
1/6
$599,000
— beds— baths8.34 acres (lot)
16511 51st Ave SE, Bothell, WA 98012
Listing provided by NWMLS as Distributed by MLS Grid
Based on information submitted to the MLS GRID as of Wed May 01 2024. All data is obtained from various sources and may not have been verified by broker or MLS GRID. Supplied Open House Information is subject to change without notice. All information should be independently reviewed and verified for accuracy. Properties may or may not be listed by the office/agent presenting the information. Some IDX listings have been excluded from this website.
School data is provided by GreatSchools, a nonprofit organization. Redfin recommends buyers and renters use GreatSchools information and ratings as a first step, and conduct their own investigation to determine their desired schools or school districts, including by contacting and visiting the schools themselves.Redfin does not endorse or guarantee this information. School service boundaries are intended to be used as a reference only; they may change and are not guaranteed to be accurate. To verify school enrollment eligibility, contact the school district directly.
Mill Creek, Washington offers a variety of transportation options for its residents. The city experiences moderate traffic levels, making driving a car a convenient choice for many. Public transportation is also available, with buses providing easy access to various parts of the city. Additionally, Mill Creek is conveniently located near major highways, ensuring easy commuting to neighboring cities and beyond. Learn more on our Mill Creek city guide.
What types of properties are available in Mill Creek?
Mill Creek, Washington offers a variety of single-family home types, including ranch-style homes, split-level homes, and contemporary homes. These homes can be found throughout the Mill Creek area, with many located in established neighborhoods and newer developments. Most properties feature three to five bedrooms and were built between the 1970s and present. To explore different property types for sale in Mill Creek, Washington, use the 'Home type' filter located above the active listings. Customize your search by selecting options like single-family homes, condos, townhomes, and more.
What is life like in Mill Creek?
Mill Creek, Washington offers a serene and picturesque environment with its lush greenery and scenic landscapes. The region experiences a temperate climate, with mild winters and warm summers. The area boasts a range of employment opportunities across various industries, ensuring a diverse job market. Residents can engage in a plethora of recreational activities, such as exploring the numerous parks, hiking trails, and outdoor spaces. The community also has a vibrant arts and culture scene, with opportunities to attend local events and exhibitions.
What are the schools and amenities like in Mill Creek?
Mill Creek, Washington provides a variety of public amenities to its residents. Dining options are plentiful with a range of restaurants available. Outdoor enthusiasts will appreciate the numerous parks for leisure and recreation. For everyday needs, several grocery stores are conveniently located within the city. Additionally, Mill Creek offers more amenities including schools, libraries, and fitness centers for its residents.
In the past month, 19 homes have been sold in Mill Creek. In addition to houses in Mill Creek, there were also 4 condos, 7 townhouses, and 0 multi-family units for sale in Mill Creek last month. Mill Creek is a minimally walkable city in Snohomish County with a Walk Score of 29. Mill Creek is home to approximately 18,377 people and 4,120 jobs. Find your dream home in Mill Creek using the tools above. Use filters to narrow your search by price, square feet, beds, and baths to find homes that fit your criteria. Our top-rated real estate agents in Mill Creek are local experts and are ready to answer your questions about properties, neighborhoods, schools, and the newest listings for sale in Mill Creek. Our Mill Creek real estate stats and trends will give you more information about home buying and selling trends in Mill Creek. If you're looking to sell your home in the Mill Creek area, our listing agents can help you get the best price. Redfin is redefining real estate and the home buying process in Mill Creek with industry-leading technology, full-service agents, and lower fees that provide a better value for Redfin buyers and sellers.


 REDFIN IS COMMITTED TO AND ABIDES BY THE FAIR HOUSING ACT AND EQUAL OPPORTUNITY ACT. READ REDFIN'S FAIR HOUSING POLICY AND THE NEW YORK STATE FAIR HOUSING NOTICE.
 United States
 Canada