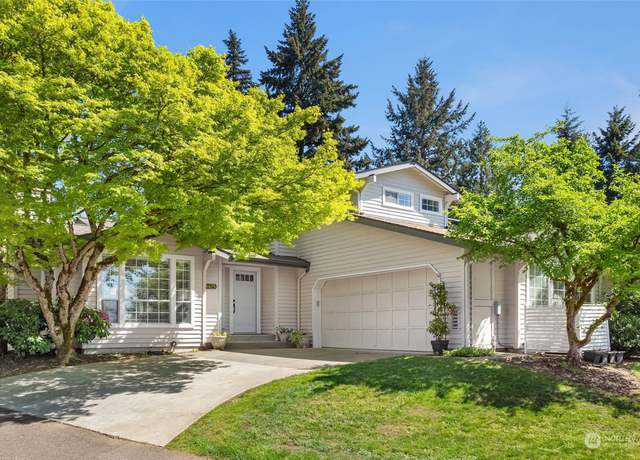
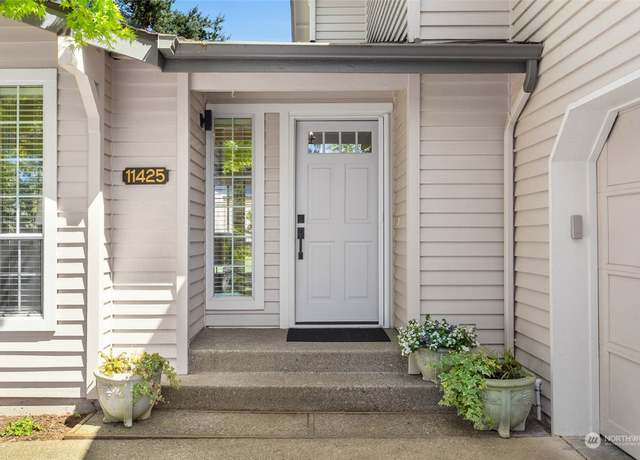
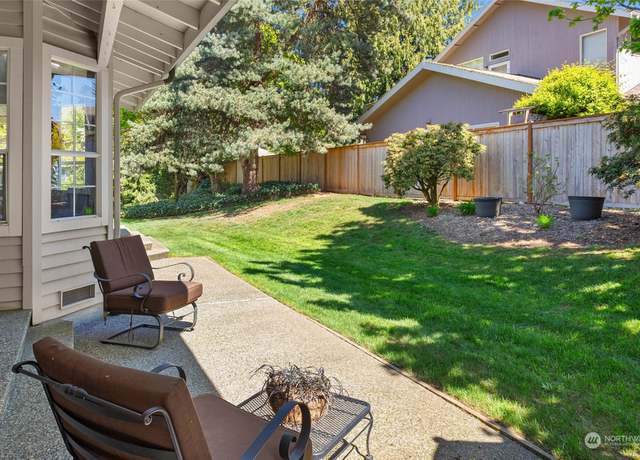
The envy of Pembrook Meadow! Ideal location at end of private cul-de-sac. Bright elegant townhome with vaulted ceilings boasts a spacious 1,870 square feet of living space. 2 beds & 2.5 baths offer a perfect blend of comfort and style. King sized primary bedroom and an impressive true spa-like oasis in the primary bathroom including stunning Acorn cabinets and a rejuvenating jetted tub with heated back for relaxation, tranquility, and indulgence AMAZING! Cozy and secluded private backyard retreat, for relaxing and enjoying quiet moment outdoors. Heat pump for summer months, large 2-car garage and neighborhood amenities including outdoor pool, tennis courts and clubhouse for fun get to
1/33
$900,000
2 beds2.5 baths1,870 sq ft2,252 sq ft (lot)
11425 SE 67th Pl, Bellevue, WA 98006
Listing provided by NWMLS as Distributed by MLS Grid
Stunning townhome in Aldea! Rare, coveted floor plan & unobstructed front & back views! 1 of 2 premier units loaded w/ luxury upgrades. Gorgeous setting backing to Coal Creek reserve & endless trails. Open concept wow factor great rm made for entertaining! Chef’s kitchen, butler’s pantry, 10 foot island & upgraded appliances. Private office w/ built ins. Flex space w/ floor to ceiling windows for a 2nd office, formal dining or salon. Sumptuous primary; spa-like bath. Family/movie/game rm w/ hidden projector creating a 100” crystal clear picture! Expansive & private patio ideal for barbecues. Dream 2 car fully finished garage wired for EV outle
1/37
$1,589,000
3 beds2.5 baths2,656 sq ft1 sq ft (lot)
6722 137th Pl SE Unit 9 F-2, Newcastle, WA 98059
Listing provided by NWMLS as Distributed by MLS Grid
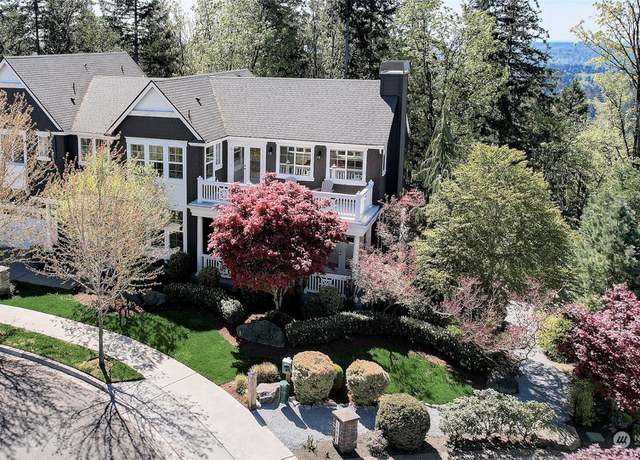
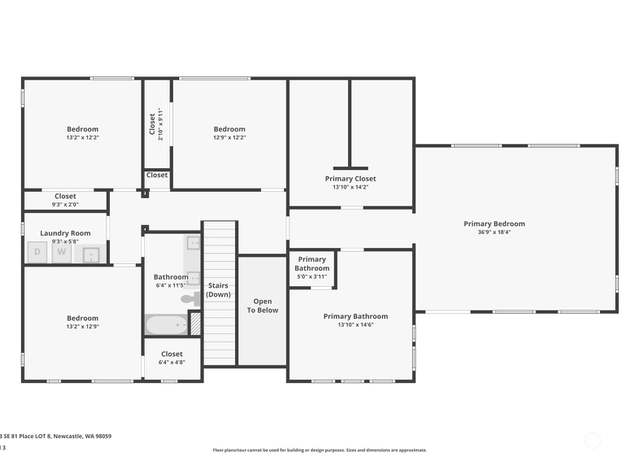
Privacy, Luxury, Nature, Issaquah Schools. Mountaintop, newish semi-custom 6+ bedroom home on cul-de-sac. Abuts forest preserve & Cougar Mtn trailhead. All 3 levels boast high ceilings, water views, rich millwork throughout: wainscoting & trim, two solid wood staircases, rustic beams above living and kitchen areas. 4 balconies/porches. Serene expansive primary suite with sitting area, private balcony, huge closet (13x14), spa-like bath & gorgeous views. Convenient top floor laundry. Professional kitchen (Wolf/Subzero) with 10.5’ island, walk-in pantry. Media room with Dolby Atmos surround (6 in-wall speakers). Library. Lowest level with kitchenette could easily conve
1/37
$2,750,000
6 beds4 baths4,980 sq ft0.25 acre (lot)
13913 SE 81st Pl, Newcastle, WA 98059
Listing provided by NWMLS as Distributed by MLS Grid
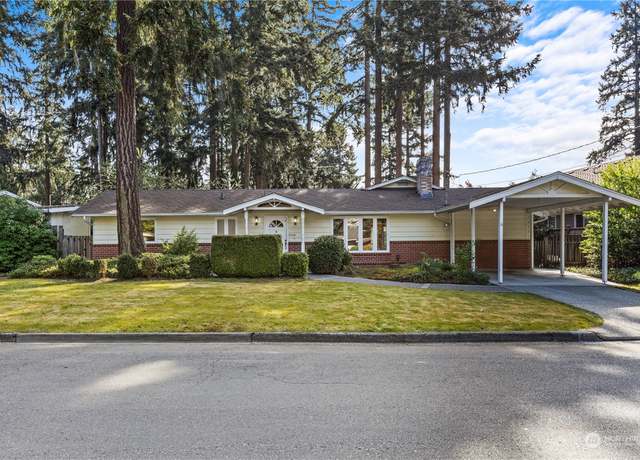
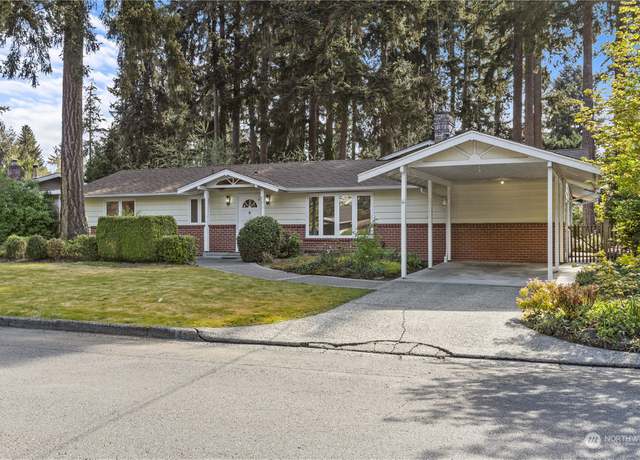
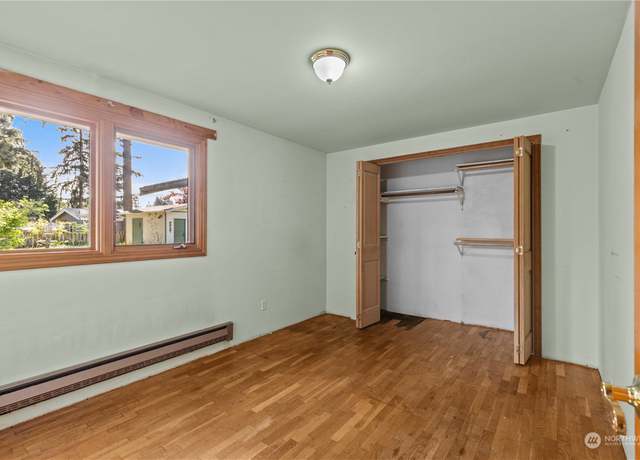
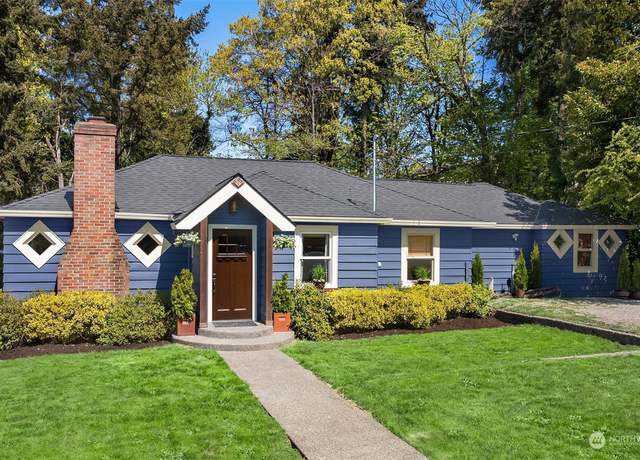
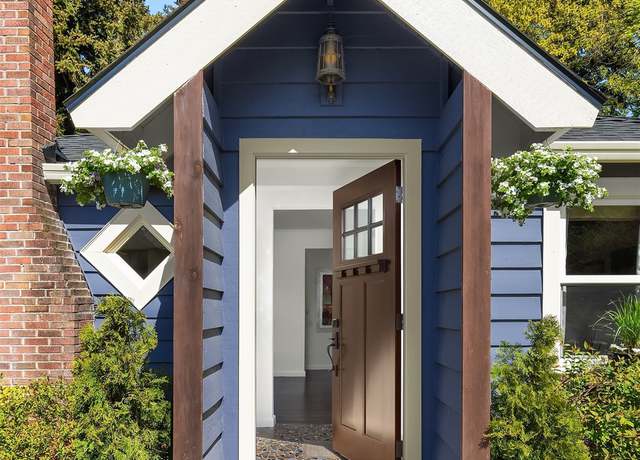
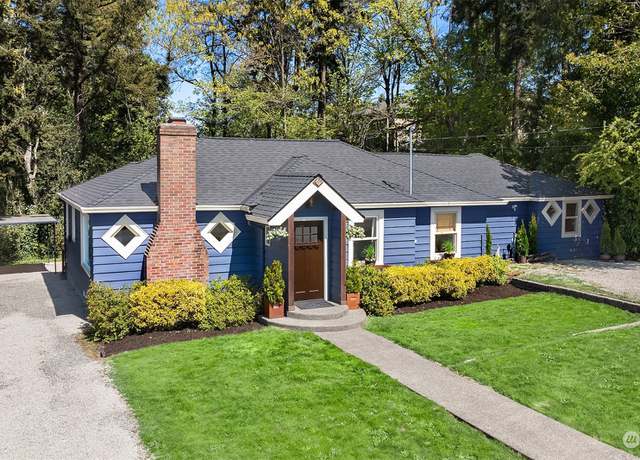
Offering a perfect blend of comfort and potential, this home is an excellent opportunity to add personal touches and build equity. This home sits on a level, park-like lot within a neighborhood renowned for its welcoming atmosphere and scenic surroundings. The expansive kitchen, with its walk-in pantry, serves as the heart of the home and is perfect for both entertaining guests and everyday living. Additional features include two large sheds, offering plenty of storage for garden tools or space for a hobby area. With level entry, this home ensures easy mobility for everyone. Make this house your home and experience all that this wonderful area has to offer!
1/26
$750,000
3 beds1 bath1,750 sq ft0.25 acre (lot)
8946 121st Ave SE, Newcastle, WA 98056
Listing provided by NWMLS as Distributed by MLS Grid
Storybook charm meets modern function in this meticulously renovated Craftsman home nestled in Newport Hills. Lake WA views greet you from the light-filled living room & gourmet kitchen – a chef’s dream! Unwind in your primary suite w/ spa-inspired ensuite bath w/ wet room + heated floors. New paint & carpet grace the main level, while newer wood flooring adds a touch of sophistication. Lower level: 2024 remodel & fully permitted secondary living space w/ separate entrance & dedicated parking - adds value as potential rental or generational living option. Private backyard oasis flanked by 2 sides of protected greenbelt, offering tranquility & privac
1/40
$1,250,000
4 beds3 baths2,090 sq ft8,000 sq ft (lot)
11020 SE 64th St, Bellevue, WA 98006
Listing provided by NWMLS as Distributed by MLS Grid
Welcome to Madisone Lane Newcastle neighborhood, to own this 2 story Burnstead home, boast an abundance of hardwood flooring, gourmet kitchen, extensive millwork throughout with build in entertainment center with lots of shelves and cabinets. Main floor featuring 9 feet ceiling. Huge primary master suite featuring vaulted-ceiling w/ huge walk-in-closet. Skylight in a master bath with double vanity. This home is nestled alongside of a greenbelt.
$1,899,000
6 beds4 baths2,876 sq ft5,099 sq ft (lot)
6921 115th Ct SE, Newcastle, WA 98059
Listing provided by NWMLS as Distributed by MLS Grid
Enhance your lifestyle in this newly updated end-unit townhome, boasting an attached two-car garage. The upper floor presents a luxurious primary suite alongside two additional rooms, which offer the spacious feel of a three-bedroom home. Soaring vaulted ceilings, an en-suite bath, utility area & another full bathroom enrich the top level. Defined entry opens to a uniquely large living space with gas fireplace & 1/2 bath. The kitchen is a chef's dream, featuring new quartz countertops, stainless steel appliances, elegant plantation shutters, and a back door that opens to a private outdoor entertainment area embraced by natural beauty. Storage galore, EV Charging outlet in place.
$708,800
2 beds2.5 baths1,493 sq ft1 sq ft (lot)
7206 134th Ct SE, Newcastle, WA 98059
Listing provided by NWMLS as Distributed by MLS Grid
New homes from Murray Franklyn in Newcastle. The sought after Reserve at Windtree neighborhood of 6 new homes. This is the private homesite number 2. The popular Steele floorplan. Modern layout featuring 4 bedrooms and 4 bathrooms including a main level 5th bedroom/den/office. Upstairs offers 4 bedrooms including primary suite with dual closets. Spacious third story recreation room with bathroom. Stunning custom design and high end finishes from luxury homebuilder including high ceilings, expansive windows and air conditioning. Large Covered Patio with fireplace. Quiet street with home backing to open space for privacy. Hard to find 3 car side by side garage. Don't miss this opportunity! On
$2,279,990
4 beds4 baths3,801 sq ft7,533 sq ft (lot)
9120 123rd Dr SE, Newcastle, WA 98056
Listing provided by NWMLS as Distributed by MLS Grid
The Perfect Home provides space to Gather, Create, Entertain, Inspire & Rest. The Perfect home is This classic NW 2-story+basement 4 bed, 3 bath 3400 sqft residence in renowned Lake Washington Crest. Tactfully remodeled w/ a true Chef’s kitchen showcasing fields of counter space & custom organization. The marble slab island is flanked by beautiful Shaker Birch cabinets & stainless appliances including dble oven. Reformed main suite w/ artisan shower & walk in closet. Formal & casual dining options, delightful sitting area w/ gas fire, french doors connect the generous sun soaked deck & mountain/lake views. Theres more, downstairs you’re treate
$1,495,000
4 beds3.5 baths3,340 sq ft9,529 sq ft (lot)
11704 SE 78th Pl, Newcastle, WA 98056
Listing provided by NWMLS as Distributed by MLS Grid
Escape to your own waterfront paradise, where luxury meets nature just steps from city amenities and a park with miles of trails. This custom-built home boasts high-end finishes, including a stunning nano wall of windows, a trex dock, and high-end finishes throughout. Enjoy vaulted ceilings, radiant heat, air conditioning, and a gas fireplace, w/ every room offering breathtaking views. The elegant spa-like master suite is its own private oasis. Two ensuite bedrooms, a two-car garage, and an office cottage complement the main residence, while a spacious ADU adds versatility. Centrally located near Bellevue, the airport, and Seattle, this home offers the perfect blend of serenity and convenie
$2,600,000
3 beds3.5 baths2,700 sq ft0.26 acre (lot)
7642 129th Ave SE, Newcastle, WA 98056
Listing provided by NWMLS as Distributed by MLS Grid
Under construction est. comp end of July 24'. Discover contemporary luxury in Newcastle! This 5-bed, 4-bath new construction home spans 3,838 sq ft, offering sleek design and modern amenities. With an open layout, gourmet kitchen, luxurious primary suite, main floor guest suite and landscaped yard, it's the epitome of upscale living. Step inside and be captivated by the clean lines, expansive windows, and abundant natural light that fills every corner of the home. The gourmet kitchen is a chef's dream, featuring top-of-the-line appliances, custom cabinetry, and a large center island. Adjacent to the kitchen, the inviting great room beckons with its cozy fireplace and stylish finishes, provi
$2,389,950
5 beds3.5 baths3,838 sq ft7,554 sq ft (lot)
11398 82nd St, Newcastle, WA 98056
Listing provided by NWMLS as Distributed by MLS Grid
This majestic home in Newcastle offers grand living spaces in a stunning setting along the 6th fairway of the Golf Club at Newcastle. Main floor complete with formal living and dining, oversized kitchen/great room, huge pantry and wine cellar. built-in home office on main. Luxurious master with fireplace. Bonus room and home theater with wet bar and guest rooms with ensuite baths. 3 car garage. Covered patio boasting an entertainment space. Enjoy the epitome of luxurious living in the Reserve.
$2,950,000
4 beds4.5 baths5,225 sq ft0.30 acre (lot)
15203 SE 80th St, Newcastle, WA 98059
Listing provided by NWMLS as Distributed by MLS Grid
The Approach Condominiums. Walking distance to several restaurants and two grocery stores. Tons of windows and natural light, high ceilings, wonderful neighbors, and a thoughtful and involved HOA board. Property recently received a full exterior renovation. . Upgraded fireplace and walk-in closet. Two parking spaces in the secure garage AND a secure storage unit in the same garage. ADA accessible unit, elevator, and ground-level entry. Can't be beat!
$599,999
2 beds2 baths1,124 sq ft
6800 132nd Pl SE Unit E102, Newcastle, WA 98059
Listing provided by NWMLS as Distributed by MLS Grid
Welcome Home to ParTerra at Newcastle Condominiums. This Lake Boren Adjacent, 3 Bed 2.25 Bath 1336 SQFT Main Floor Condo, has it all. Full Sized Kitchen, Stainless Steel Appliances, Granite Countertops, Large Primary with Stand Up Shower and Walk-In Closets, Living Room w/ Fire Place, Dining Room, View of Lake Boren and a Large Patio, 2 Good sized Bedrooms, Full bath and a Half for extra convenience, Covered Parking Spot. Amenities Include, Hot Tub, Storage Closet, Play Ground, Gated Parking, Gym and a Secured Building. Centrally Located in the heart of Newcastle and the Issaquah School District, Close to all amenities, Shopping, Entertainment, Dining and Easy Access to 405, I90, 167, 520
$639,950
3 beds2.5 baths1,336 sq ft
13301 SE 79th Pl Unit B 110, Newcastle, WA 98059
Listing provided by NWMLS as Distributed by MLS Grid
Beautiful well kept home in nice location. Vaulted ceilings. Fresh exterior paint. Living Room w/ fireplace. Kitchen & eating space, formal dining room and hardwood floors throughout main level. Slider to outdoors and patio. Spacious Master Suite with remodeled bath. Two additional generous size bedrooms and main bathroom. Lower level has large family room, 3/4 bath & laundry room. 2 Car attached garage with wood floor. A must see!!!
$1,350,000
3 beds3 baths2,230 sq ft0.30 acre (lot)
12631 SE 68th Pl, Bellevue, WA 98006
Listing provided by NWMLS as Distributed by MLS Grid
Your stunning new home is situated in above Lake Washington. Featuring rooftop view deck, open floor plan with high ceilings, large kitchen with island, stainless appliances, lovely flow between generous formal/informal spaces, 1 bedroom on the main floor & abundant windows capture natural light & create ambiance. Spacious 2 primary suite w/ huge shower, soaking tub and 2 bedrooms all with the private balcony. Just minutes to Seattle Seahawks facility and Easy access freeway 405.
$2,650,000
5 beds4.5 baths4,830 sq ft0.24 acre (lot)
11018 SE 64th St, Bellevue, WA 98006
Listing provided by NWMLS as Distributed by MLS Grid
Unlock the potential of 5.3 acres in Newcastle! Zoned R1, this development property offers endless possibilities. Subdivide into multiple lots or create a sprawling estate – the choice is yours. Conveniently located near shopping, restaurants, beaches, and parks, it promises a lifestyle of ease and luxury. Embrace the outdoors with nearby trails and parks, creating a harmonious blend of nature and urban living. Commuting is a breeze with easy access to Hwy 405. Seize this opportunity to craft a community hub or your own private haven. Your vision, your property, your legacy in Newcastle awaits!
$1,200,000
— beds— baths5.36 acres (lot)
12300 XX SE May Creek Park Dr, Newcastle, WA 98056
Listing provided by NWMLS as Distributed by MLS Grid
Looking for a large view lot to build your own custom home? Amazing 180 degree views of Lake Washington with beautiful western sunsets on a private cul-de-sac. This 38,424 square foot lot has unlimited potential, views of the Olympic Mountains and Mercer Island just a short distance to Lake Washington waterfront, downtown Bellevue and more. Sewer is site with power, water and gas in the street.
$747,000
— beds— baths0.88 acre (lot)
0 xx SE 66th St, Newcastle, WA 98056
Listing provided by NWMLS as Distributed by MLS Grid
Great 1.26 acre parcel zoned R6. Lot shape and slopes makes the land ideal for a New Estate Home, or potential Duplex or Triplex. The property is a short few blocks walk to Newcastle Elementary School.
$419,950
— beds— baths1.26 acres (lot)
0 80xx 136th Ave SE, Newcastle, WA 98059
Listing provided by NWMLS as Distributed by MLS Grid
Based on information submitted to the MLS GRID as of Sun Apr 28 2024. All data is obtained from various sources and may not have been verified by broker or MLS GRID. Supplied Open House Information is subject to change without notice. All information should be independently reviewed and verified for accuracy. Properties may or may not be listed by the office/agent presenting the information. Some IDX listings have been excluded from this website.
School data is provided by GreatSchools, a nonprofit organization. Redfin recommends buyers and renters use GreatSchools information and ratings as a first step, and conduct their own investigation to determine their desired schools or school districts, including by contacting and visiting the schools themselves.Redfin does not endorse or guarantee this information. School service boundaries are intended to be used as a reference only; they may change and are not guaranteed to be accurate. To verify school enrollment eligibility, contact the school district directly.
Newcastle, Washington boasts a well-structured transportation system that caters to the needs of its residents. The city experiences moderate traffic levels, making driving a car a convenient option for commuting. Public transportation is also available in Newcastle, providing an alternative for those who prefer not to drive. In addition, the city is conveniently located near major highways and freeways, offering easy access to surrounding areas. Learn more on our Newcastle city guide.
What types of properties are available in Newcastle?
Newcastle, Washington offers a variety of single-family home types, including ranch-style, split-level, and contemporary homes, among others. These homes can be found throughout the city, with many located in established neighborhoods and newer developments. Most properties in Newcastle, Washington feature three to five bedrooms and were built in various years. To explore different property types for sale in Newcastle, Washington, use the 'Home type' filter located above the active listings. Customize your search by selecting options like single-family homes, condos, townhomes, and more.
What is life like in Newcastle?
Living in Newcastle, Washington offers a peaceful and serene environment with a picturesque landscape surrounded by lush greenery and majestic mountains. The weather is characterized by mild summers and cool winters, providing a pleasant climate year-round. The town boasts a range of job opportunities across various industries, catering to diverse professional backgrounds. Residents can engage in a plethora of recreational activities, such as hiking, biking, and exploring the numerous parks and trails. Additionally, the town offers a vibrant local culture with a variety of dining options, shopping centers, and community events.
What are the schools and amenities like in Newcastle?
Newcastle, Washington offers a variety of public amenities to enhance the quality of life for its residents. The city boasts several well-stocked grocery stores, ensuring convenient access to daily essentials. For dining options, numerous restaurants serve diverse cuisines to satisfy different culinary preferences. Outdoor enthusiasts will appreciate the city's beautiful parks, perfect for leisure and relaxation. Additionally, Newcastle provides other essential services and facilities, making it a well-equipped city for its residents.
In the past month, 15 homes have been sold in Newcastle. In addition to houses in Newcastle, there were also 3 condos, 3 townhouses, and 1 multi-family unit for sale in Newcastle last month. Find your dream home in Newcastle using the tools above. Use filters to narrow your search by price, square feet, beds, and baths to find homes that fit your criteria. Our top-rated real estate agents in Newcastle are local experts and are ready to answer your questions about properties, neighborhoods, schools, and the newest listings for sale in Newcastle. Our Newcastle real estate stats and trends will give you more information about home buying and selling trends in Newcastle. If you're looking to sell your home in the Newcastle area, our listing agents can help you get the best price. Redfin is redefining real estate and the home buying process in Newcastle with industry-leading technology, full-service agents, and lower fees that provide a better value for Redfin buyers and sellers.


 REDFIN IS COMMITTED TO AND ABIDES BY THE FAIR HOUSING ACT AND EQUAL OPPORTUNITY ACT. READ REDFIN'S FAIR HOUSING POLICY AND THE NEW YORK STATE FAIR HOUSING NOTICE.
 United States
 Canada