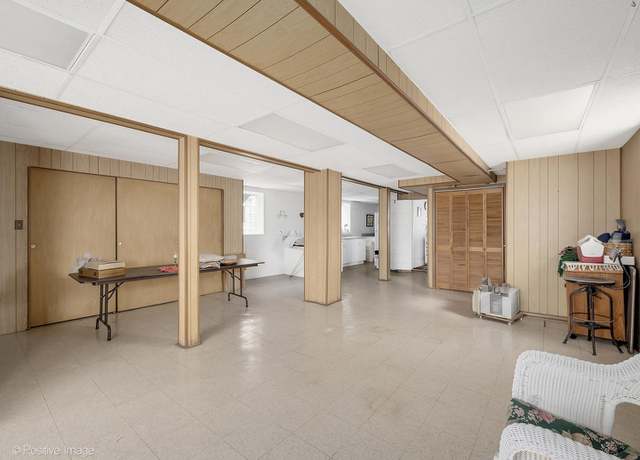
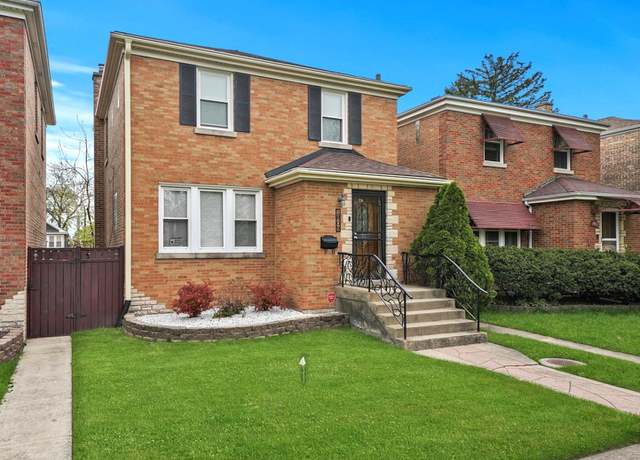
This beautifully renovated ranch-style home is now available and ready for immediate occupancy. It boasts a completely remodeled kitchen equipped with new countertops and modern appliances, and refreshed bathrooms. The living room and the two main bedrooms feature newly installed hardwood floors, enhancing the home's elegant ambiance. The basement has been fully updated to include a versatile space that can serve as a large office or an additional bedroom, complemented by a half bath and a dedicated laundry area. For relaxation, there is a steam sauna, and the recreation room features a cozy bar area with a heated floor, perfect for entertaining. Additionally, the home includes a detached t
CLASSIC BRICK BUNGALOW SITUATED ON AN OVERSIZED CORNER LOT. FIREPLACED SUNFILLED LIVING ROOM AND FORMAL DINING ROOM FEATURES BEAUTIFUL ORIGINAL HARDWOOD FLOORING AND TRIM. BIG EAT IN KITCHEN FEATURES TONS OF CABINETRY, CORIAN COUNTERS, PANTRY PLUS SEPERATED BREAKFAST ROOM WITH LARGE WINDOWS OVERLOOKING LOVELY LANDSCAPED LOT. 3 BEDROOMS ON THE FIRST FLOOR WITH FULL BATH. SECOND FLOOR FEATURES ADDITIONAL BEDROOM AND KITCHEN AREA WITH FULL BATH PLUS PLENTY OF ROOM TO EXPAND EVEN MORE WITHOUT DORMER! PERFECT FOR EXTENDED FAMILY, TEENS, IN-LAWS OR MAN CAVE. FULL FINISHED REC ROOM OFFERS EVEN MORE SPACE WITH ADDITIONAL HALF BATH. OVERSIZED CORNER LOT WITH 3 1/2 CAR BRICK GARAGE ONE 2 1/2 AND SEP
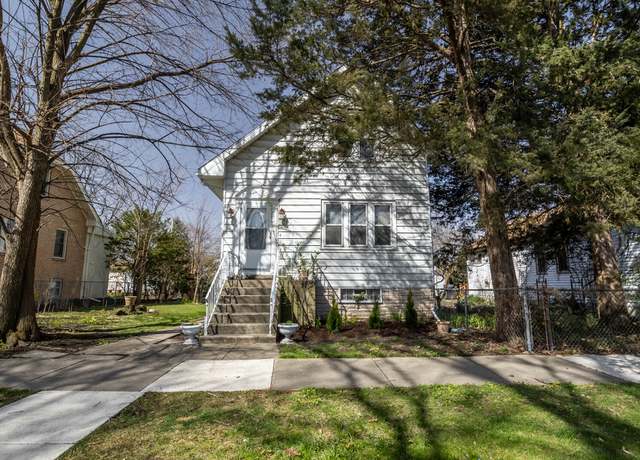
Beautiful 4 bedroom home in North Riverside. Corner lot with plenty of room for entertaining. Full finished basement and 2 car attached garage. Come and make this your spring project. Close to schools, parks, restaurants and shopping. This property is HUD owned and is offered in "As Is" condition with neither repairs nor warranties. HUD ID: 137-507209 Insurability: IE
Don't miss this North Riverside property which features two homes. This is a great opportunity for investors or homebuyers looking for supplemental rental income. Both homes have a solid rental history. The main house has four bedrooms and two baths. The second home has 2 bedrooms and one bath. Award-winning District 96 Elementary and Junior High Schools and Riverside-Brookfield High School. Two-car garage. Located at the end of 30th Street and bordered by the Des Plaines River and forest preserve, this home's tranquil location is not to be missed.
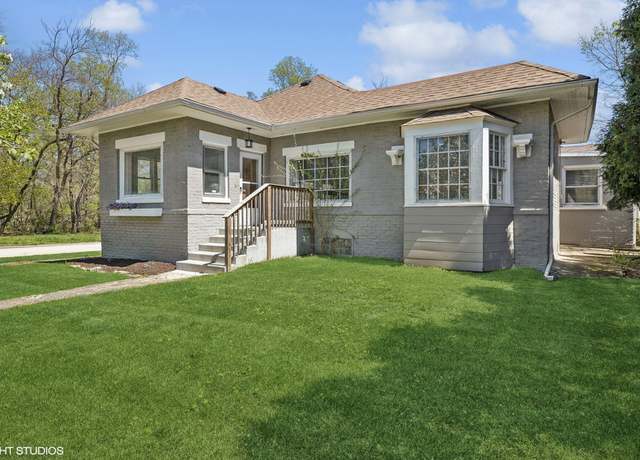
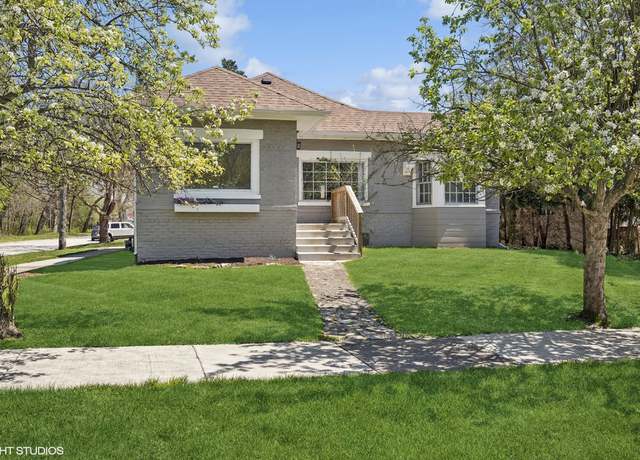
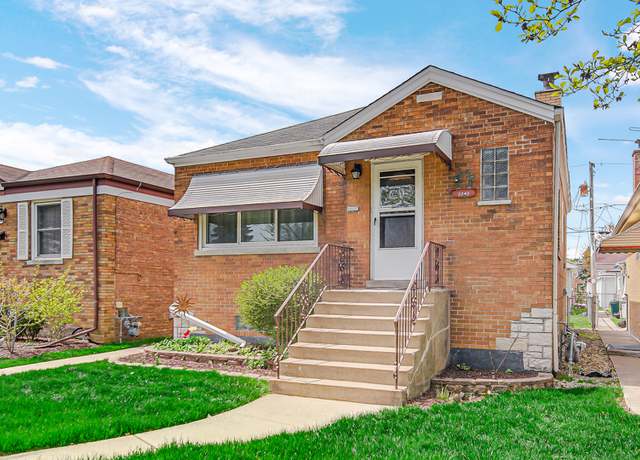
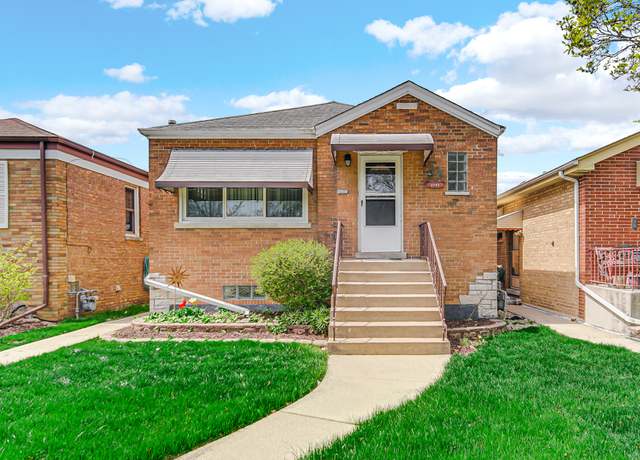
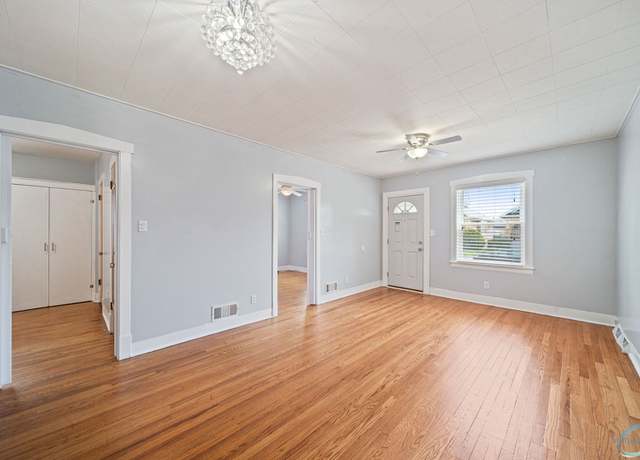
This North Riverside home is move in ready. It is a well-cared for raised ranch with refinished hardwood floors throughout. The kitchen has beautiful granite countertops, and the new bathroom has a walk-in shower. The whole house has been freshly painted. New furnace is equipped with a Smart thermostat. The basement is very spacious with great recessed lighting. The white picked fenced-in yard is perfect for gardening with new sod home also includes a 2-car garage. This neighborhood is close to shopping, restaurants, great schools, and is 15 minutes from downtown Chicago. Very low taxes are a plus! Perfect home for growing family!
Walk into this charming and meticulously cared for raised ranch in desirable North Riverside that sits on an over-sized corner lot! This lovely home hosts a living room, separate dining room, kitchen, 2 spacious bedrooms with ample closets, smart thermostat, hardwood floors throughout and a remodeled bathroom on first floor. The lower level hosts a bright & spacious family room with new carpeting and laundry area. Exterior features a driveway and a huge fenced back yard with patio for summer living. Recent improvements include: roof, tuck pointing, boiler and entire home freshly pained. Idealy located . . by Commons Park, close Riverside Mall, Cermak Rd and the 290!! This is a MUST
Welcome to this Great Home! Located in sought after North Riverside! Known for best schools around! Low taxes$! Home has been completely redone! Home features: brand new kitchen with stainless steel kitchen and granite countertops! New furnace and AC unit! Hardwood floors! 2 full brand new baths! Very nice finished basement! Huge back yard with 2.5 car heated garage with overhead door in yard ideal for parties! Brand new vinyl privacy fence! Brand new concrete patio! Yard has recently been sodded! Located min. to shopping & fine dining! 10 min. To downtown Chicago! Too much to mention! This one wont last!
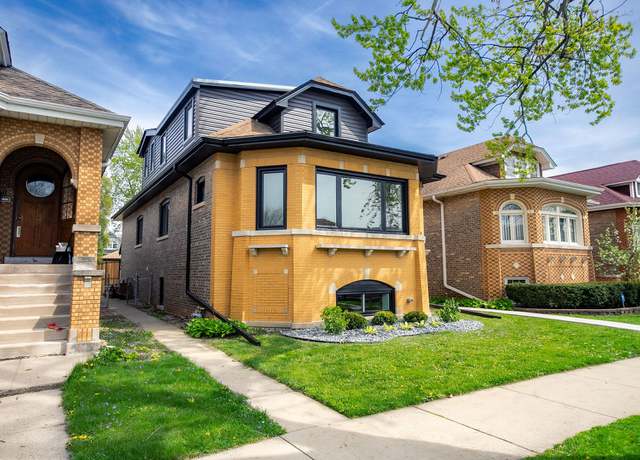
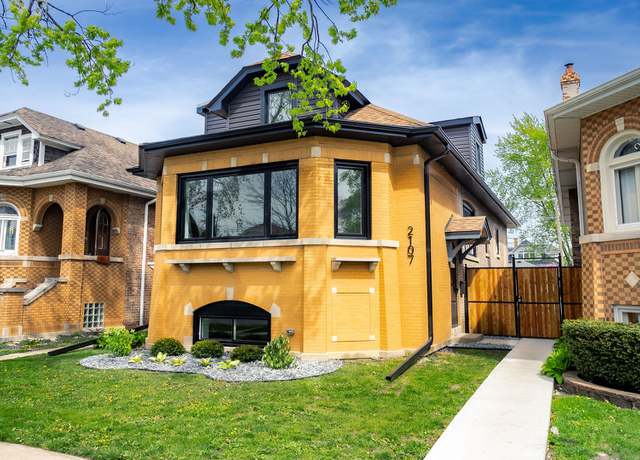
Step into the charm of this beautifully preserved 1920s bungalow! This 3Bed/2Bath home exudes character with its quaint architecture and original details. NEW(2024) Kitchen Vinyl Plank Flooring, Newer front and back exterior doors and a list of updates done in the last 10 years! Finished basement with a full bath and large storage closets! Spacious fenced yard and detached 2.5 car garage with newer siding complete the property! Don't miss the chance to own a piece of history, showings begin this weekend!
Welcome to 142 Akenside Road, this stunning five bedroom, 4.1 bathroom home highlights a host of spectacular amenities, both inside and out. The interior features an abundance of intricate and unique details and a combination of modern and colonial-style designs. Throughout the home you'll find beautiful refinished hardwood floors, wainscotting and crown molding for a touch of elegance and many large windows that provide plenty of natural light to fill the home with warmth. Upon entering you'll instantly be delighted by the extraordinary living room. Offering coffered ceilings, the first of four wood burning fireplaces, a beautiful mantle and built-in arched bookcases. The formal dining roo
Wow! A true MUST-SEE in this Updated and Well-Maintained 3 Bed 3 Bath Brick Bi-Level in an Unbelievable Location overlooking Yena Park and just steps from Brook Park Elementary, St. Louise de Marillac, and Forest Preserve with Walking Paths & Bike Trails!!! Special Features and New Additions Include: Gorgeous Kitchen with Full Whirlpool Appliance Package including Double-Oven and Cooktop ~ Tile Backsplash ~ Rich Granite Counters, New LVT Floorings ~ Storm Doors (Lifetime Warranty) ~ Light Fixtures and Ceiling Fans, Luxurious Custom Oversized Crown Moulding and Custom Drapes, Living Room w/ Built-In Entertainment Center, Proper Master w/ Full Master Bath, Family Room w/ Wet Bar &
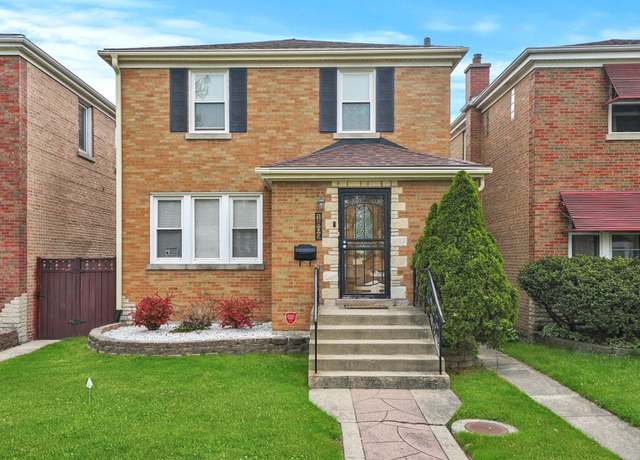
Explore this stunning Georgian residence with captivating curb appeal! The original charm is beautifully maintained with exquisite craftsmanship. The spacious living room features crown molding, leading to a separate dining room that opens onto a patio, adorned with beautiful hardwood floors throughout. The home offers comfortably sized bedrooms, 1.5 baths, and a finished basement for additional living space. Nice kitchen equipped with stainless steel appliances, a 2-car brick garage, a fenced yard with a deck, and a highly desirable location! Updates comprise Whole House Interior Painting (2017), Shoe Closet Buildout (2018), Leaf Guard Gutters (2019), Roof (2019), Air Conditioner (2020), a
Single family home with a BONUS 1 BEDROOM AND BASEMENT COACH HOUSE IN THE BACK (CURRENTLY RENTED)! This property offers an unique blend of single-family privacy with the added advantage of a supplementary income stream, making it ideal for large families, in-laws, or savvy investors. The coach house features a 1 bedroom, kitchen, bathroom, basement that is great for storage and laundry room, along with independent utilities. The main home features 3 bedrooms, living room, dining room, kitchen with vaulted ceiling and table space, an extra room perfect for an office, and a partially finished basement with family room and a half bath. New hardwood floors, and updated bathroom in main home. En
Get ready to be impressed. Fully rehabbed 4 bed, 3 full bath brick bungalow in spectacular condition & desirable location. Come check out this modernized wide open floor plan with 3 finished levels of living. From the moment you open the front door you'll know your in for something special. White shaker cabinets features ultra chic dramatic accent walls. Incredibly thoughtful kitchen design features a farmers sink with a gourmet chef's faucet. Incredibly stunning & unique quartz counters with perfectly matching backsplash & colors. Freshly refinished hardwood flooring installed with a white oak finish. The fireplace in the primary suite has a heating element to keep those
Welcome to this beautiful blend of modern amenities and classic charm in the heart of South Berwyn. Step inside this beautiful bungalow to discover a spacious layout that accommodates all your needs, with two bedrooms on the first floor, three on the second floor, and a fully finished basement. Hardwood floors throughout the living room, kitchen, dining room, and bedrooms provide a classic touch, while modern fixtures and natural light infuse the space with contemporary elegance. Elegance in one of the three bathrooms, including a jacuzzi on the second floor. Entertaining friends and family is effortless in the spacious layout, where modern convenience meets classic hospitality. Whether you
Amazing opportunity to Own your Own Home! Huge potential in this quad-level property! Additionally, it also comes with a Side-Drive, Spacious Back Yard and a 1.5 Car Garage! Property subject to 3 Days First Look Period. Upon the expiration of the First Look Period Seller will negotiate offers. Seller will not turn utilities on. Selling in As-Is Condition. Equal Housing "Everyone deserves the American Dream". A Must Buy! The seller is asking for "H & B" by 11:00 AM of Tuesday 04/30. Thank you & good luck.
This 5 bedrooms, 2 bathroom Mediterranean-style home exudes quality vintage charm throughout. While currently serving as a single residence, it is designed for multi-unit use, complete with kitchens on both levels and the option for private entries for each unit. The entryway, with its double doors leading into the living room, creates a welcoming and grand first impression. The classic woodwork throughout the home is exceptionally beautiful. Ample kitchen space includes an island, eat-in area, and expansive pantries in both kitchens. Upstairs, you'll also find a large storage area and an additional multipurpose room, adding versatility to the living spaces. Prime location situated just a f
Welcome to this remarkable single family home in Berwyn! The main level offers an open concept living room with high ceilings, a dining area, and a modern fully equipped kitchen with stainless steel appliances and ample cabinet space. Additionally, there is a first floor bedroom with a closet and a half bathroom. The second level presents a stunning master bedroom suite with a walk-in closet and a full bathroom featuring double sinks, a soaking tub, and a standing shower. Furthermore, there are two additional bedrooms, one of which includes a game/play room, a modern full bathroom, and a laundry room. The full finished basement is perfect for entertaining, boasting a spacious family room an
* SHORT SALE * Welcome to this charming brick Georgian home nestled in the heart of Berwyn, IL. Step inside to discover the timeless appeal of hardwood floors gracing the kitchen and dining room, creating an inviting ambiance throughout. The kitchen has been thoughtfully updated with sleek quartz countertops and modern stainless-steel appliances. Entertain with ease as the dining room seamlessly opens up to a super spacious backyard, boasting a new deck and fresh fencing all around, perfect for enjoying outdoor gatherings and leisurely evenings under the stars. Venture to the second level where two generously sized bedrooms await, and a full bathroom. The basement presents a blank canvas,
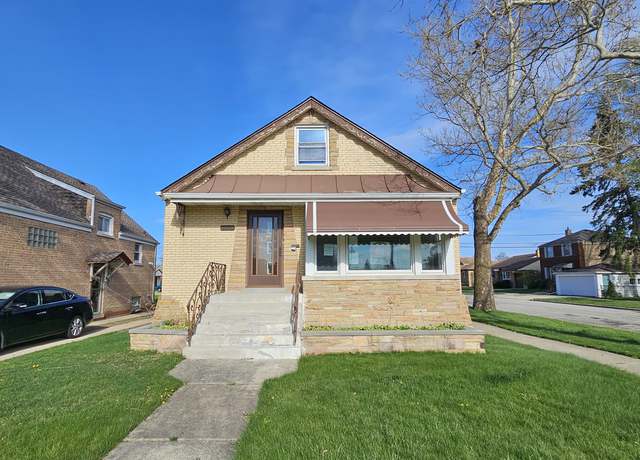
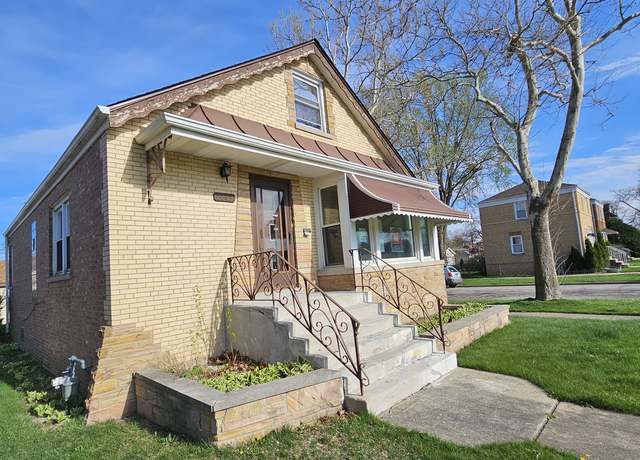
BEAUTIFUL OVERSIZED BRICK BUNGALOW WITH MANY NEW UPDATES. THIS HOME FEATURES LIVING ROOM W/ BEAUTIFUL ORIGINAL DESIGNED WINDOWS, LARGE DINING ROOM, 2BEDROOMS, FULL BATH AND HARDWOOD FLOORS THROUGHOUT, DORMER WITH FULL BATH AND BEDROOM, LARGE EAT IN KITCHEN, FULL FINISHED BASEMENT WITH SEPARATE LAUNDRY ROOM, FAMILY ROOM, 1/2 BATH AND NEW OVERSIZED BAR! SOLD AS IS
Newly renovated 4 bedroom, 2 full bath home located in desirable Broadview! Close to local shopping centers, major hospitals, Brookfield zoo, and expressways. This home boasts an updated modern kitchen, a functional finished basement, hardwood floors, and two spacious family rooms. Schedule your showing today!
Legal non-conforming 2 flat Originally built as a 6 bedroom family home that was converted to 2 legal units in 1923. The property has always been family owned. This is a Historic property on one of the largest lots in Berwyn. The Arthur J. Dunham Centennial Home is listed on The National Register of Historic Places. Recent updates include roof, copper gutters, furnace, and water heater, at the time of the conversion in 1923 the original architect Tallmadge and Watson designed an addition of a main floor primary bedroom along with enclosed 2nd floor porch into an office/den/study area. The architect said at that time that the property could be de-converted to one big single family home curre
Sitting on one of the largest lots in Berwyn 103X140, The Arthur J Dunham Centennial Home is listed on the National Register of Historic Places as well as the Berwyn Historical Society Registry. Built in 1907 the Prairie School Style, has been owned and lived in by the same family for over 117 years. Recent updates include roof, furnace, hot water heater. The exterior has been recently renovated maintaining the original appearance. Additionally the upstairs kitchen an both upstairs baths have been modernized. The floor plan of the Dunham house is a modified "L" shape centered around a large entrance hall which provides access to the ground floor rooms. The interior detailing is
Nestled in the historic Riverside area, this charming Cape Cod home stands as a rare gem with its expansive 1/3-acre lot. Meticulously renovated, this property showcases hardwood flooring, a sleek kitchen outfitted with stainless steel appliances and granite countertops, updated bathrooms, and an array of additional features. Upon entry, the newly refinished hardwood floors beckon you into the main living areas, exuding warmth and charm. A modern full bathroom on the main floor, adorned with contemporary floor tiles and a new vanity, accompanies a versatile bedroom or office space. Ascending to the second level, two additional bedrooms await, boasting ample closet space and sharing access t
Here's your chance to live in one of Riverside's most distinctive homes on one of the most sought after locations in town! Situated on a beautiful corner lot on Maplewood Road, this historic 5 bedroom/3.2 bath gem has been completely restored while meticulously preserving the home's many unique architectural details. A bright and light-filled entryway sets the stage for the gorgeous foyer and magnificent center stairwell. The first level oozes with character boasting an open floor plan with beautiful hardwood floors and original woodwork throughout. Grand living room with stone fireplace and french doors lead to a private side patio. Stunning separate formal dining room overlooks the renova
Beautiful 2 unit in the Heart of Forest Park! Everything has been done and ready for a new owner! Brand new flooring thru-out! Both units are move in ready and ready for potential rental income or family use! Each unit contains 2 bedrooms with 1 full bath! LEGAL 2 unit and all village inspections and work has been done! Property features newer kitchens, freshly painted, brand new flooring thru-out!
1/15
$369,900
5 beds2 baths— sq ft0.33 acre (lot)
1411 Harlem Ave, Forest Park, IL 60130
Based on information submitted to the MLS GRID as of Sat May 04 2024. All data is obtained from various sources and may not have been verified by broker or MLS GRID. Supplied Open House Information is subject to change without notice. All information should be independently reviewed and verified for accuracy. Properties may or may not be listed by the office/agent presenting the information.
School data is provided by GreatSchools, a nonprofit organization. Redfin recommends buyers and renters use GreatSchools information and ratings as a first step, and conduct their own investigation to determine their desired schools or school districts, including by contacting and visiting the schools themselves.Redfin does not endorse or guarantee this information. School service boundaries are intended to be used as a reference only; they may change and are not guaranteed to be accurate. To verify school enrollment eligibility, contact the school district directly.
North Riverside, Illinois is well-served by a variety of transportation options. The village experiences moderate traffic levels, making driving by car a common and convenient method of getting around. Public transportation is available, with several bus routes connecting North Riverside to surrounding areas. Additionally, the village is conveniently located near several major highways, including Interstates 290 and 55, providing easy access for both local and long-distance travel.
What types of properties are available in North Riverside?
North Riverside, Illinois offers a variety of single-family home types, including ranch-style homes, split-level homes, and contemporary homes. These homes can be found throughout the village, with ranch-style homes typically built in the 1950s and 1960s, split-level homes built in the 1970s and 1980s, and contemporary homes built in recent years. To explore different property types for sale in North Riverside, Illinois, use the 'Home type' filter located above the active listings. Customize your search by selecting options like single-family homes, condos, townhomes, and more.
What is life like in North Riverside?
North Riverside, Illinois offers a quaint and peaceful living experience. The landscape is characterized by a mix of residential areas and commercial establishments. The weather in North Riverside varies throughout the year, with hot summers and cold winters, providing a diverse climate experience. Job opportunities are available in various industries, with a range of employment options to suit different skill sets. Residents can enjoy a variety of recreational activities, such as parks, sports facilities, and community events, ensuring there is always something to do.
What are the schools and amenities like in North Riverside?
North Riverside, Illinois offers a variety of public amenities to enhance the lifestyle of its residents. The region boasts a selection of restaurants, providing a diverse array of culinary experiences. For those who enjoy outdoor leisure, there are several parks available for recreational use. Daily necessities can be conveniently purchased from the local grocery stores. Additionally, North Riverside provides more amenities, ensuring a comfortable and enjoyable living experience for all residents.
In the past month, 7 homes have been sold in North Riverside. In addition to houses in North Riverside, there was also 1 condo, 1 townhouse, and 1 multi-family unit for sale in North Riverside last month. Find your dream home in North Riverside using the tools above. Use filters to narrow your search by price, square feet, beds, and baths to find homes that fit your criteria. Our top-rated real estate agents in North Riverside are local experts and are ready to answer your questions about properties, neighborhoods, schools, and the newest listings for sale in North Riverside. Our North Riverside real estate stats and trends will give you more information about home buying and selling trends in North Riverside. If you're looking to sell your home in the North Riverside area, our listing agents can help you get the best price. Redfin is redefining real estate and the home buying process in North Riverside with industry-leading technology, full-service agents, and lower fees that provide a better value for Redfin buyers and sellers.


 REDFIN IS COMMITTED TO AND ABIDES BY THE FAIR HOUSING ACT AND EQUAL OPPORTUNITY ACT. READ REDFIN'S FAIR HOUSING POLICY AND THE NEW YORK STATE FAIR HOUSING NOTICE.
 United States
 Canada