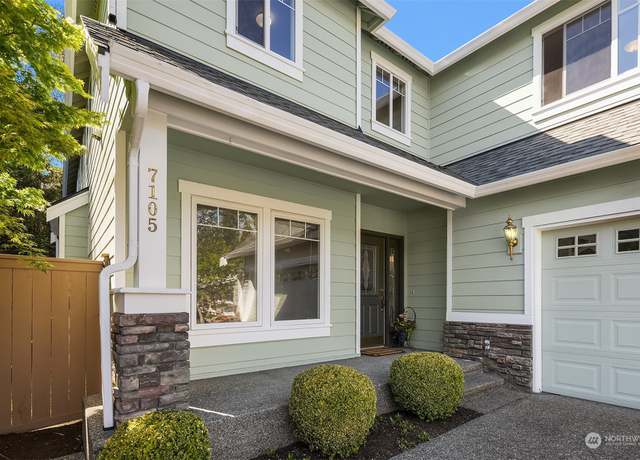
Stafford built resale in Snoqualmie Ridge, the first time on the market. Nestled in the heart of the Ridge is this 4 bedroom, 2.5 bathroom home with an open concept floor plan, dining room/great room. Gleaming hardwoods on the main floor, new carpet throughout and new bathroom flooring. Light and bright kitchen with new appliances, ample storage, and under-counter lighting is an entertainer's dream. Beautiful, private, low maintenance courtyard style, backyard with protected green space. Out of the front of the home is one of the trailheads that connect to all of the ridge outdoor activity opportunities. Close to all the local amenities including award-winning schools, shops, dining and exe
1/37
$1,250,000
4 beds2.5 baths2,624 sq ft5,432 sq ft (lot)
7105 Curtis Dr SE, Snoqualmie, WA 98065
Listing provided by NWMLS as Distributed by MLS Grid
Welcome home to one of the most coveted neighborhoods in Snoqualmie Ridge. Nestled just below the 18th fairway of the private Snoqualmie Ridge golf club sits this crowned jewel of Isley St. Pride of ownership abound in this immaculate, very large 4 bedroom home. Here you will find a rare, spacious FIRST floor primary bedroom with a large en-suite. Upstairs you will find three extra large bedrooms, a huge open loft, large full bathroom and incredible mountain views. This home has been tastefully updated with many new upgrades and is move in ready. Enjoy the well maintained extra large fully fenced back yard for all your outdoor activities and entertaining. Homes on this coveted street do not
1/32
$1,175,988
4 beds2.5 baths2,390 sq ft7,538 sq ft (lot)
36404 SE Isley St, Snoqualmie, WA 98065
Listing provided by NWMLS as Distributed by MLS Grid
Discover the perfect blend of comfort & nature in this charming home on a sprawling 1.47-acre corner lot. Warm wood floors & a cozy fireplace seamlessly connect to an entertainment-style kitchen featuring a massive quartz island & SS appliances. The stunning primary bath offers a frameless shower & jetted tub for ultimate relaxation. Embrace the tranquility of private outdoor living on extensive decking, surrounded by mature trees & 2 babbling creeks weaving through the property. .. then cool off inside w/ central A/C! Lower level versatility awaits, offering a family room, bedroom, laundry room, & a studio apartment w/ a separate entrance, kitchen &
1/39
$1,220,000
4 beds3 baths2,790 sq ft1.47 acres (lot)
37728 SE 86th St, Snoqualmie, WA 98065
Listing provided by NWMLS as Distributed by MLS Grid
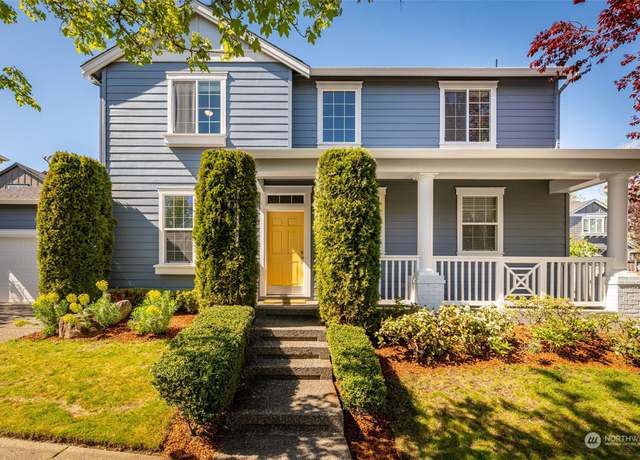
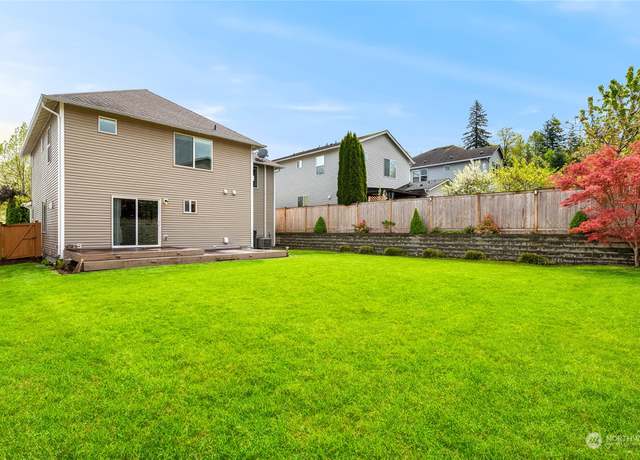
This Snoqualmie Ridge home is delightful! The covered front porch exudes warmth and sets the tone for a welcoming atmosphere. Beautiful hardwood floors create a seamless flow throughout the open-concept main floor. The updated kitchen with quartz countertops and stainless steel appliances adds a touch of modern elegance and functionality—a newer composite deck overlooking the spacious, flat, fenced backyard for outdoor gatherings and relaxation. Upstairs, the master suite offers a peaceful retreat with a walk-in closet and a 5-piece bath, Additionally, the 3 bedrooms and loft area offer versatility and ample space for various needs. Newer 90% Energy efficient furnace, A/C, built-in so
1/37
$1,098,000
4 beds2.5 baths1,954 sq ft5,689 sq ft (lot)
9415 Hebner Ave SE, Snoqualmie, WA 98065
Listing provided by NWMLS as Distributed by MLS Grid
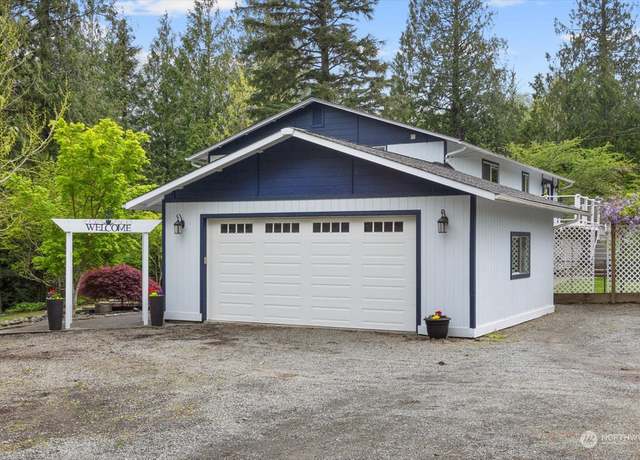
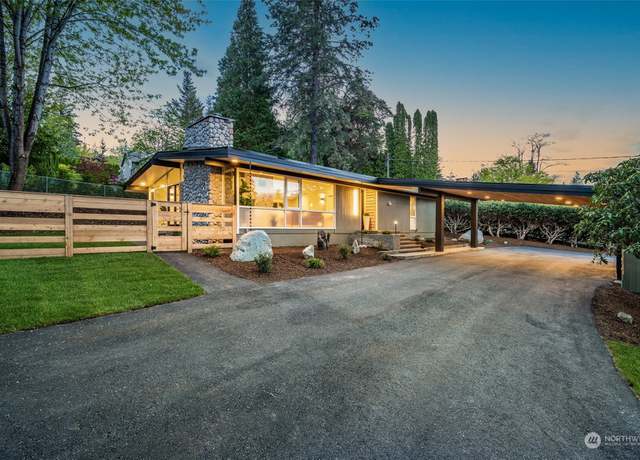
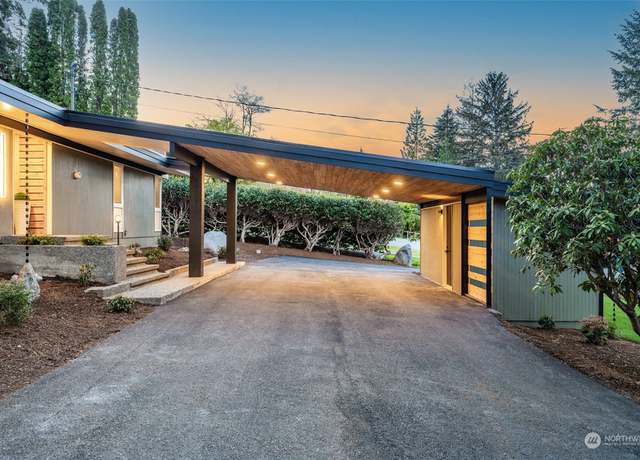
Stunning Mid Century Modern home in Desirable Snoqualmie just minutes from downtown! This 3 bedroom+ office/2 bath home boasts carefully curated finishes throughout that accentuate the style and feel of a mid century home while providing the convenience and comfort of a new home! New upgrades include but are not limited to a brand new TPO roof, new kitchen cabinets and countertops, new flooring, millwork, doors, and interior and exterior paint! All new lights and plumbing fixtures! Gorgeous tile in the bathrooms give it a spa-like feel! Situated on a large lot with beautiful terrritortial and mountain views! Detached heated space is great for office or storage! LARGE Underground concrete bu
1/40
$975,000
3 beds2 baths1,710 sq ft0.36 acre (lot)
38045 SE 88th St, Snoqualmie, WA 98065
Listing provided by NWMLS as Distributed by MLS Grid
Discover your dream home in Snoqualmie Ridge. This stunning home boasts privacy on a large lot, featuring three bedrooms, a bonus room (or optional fourth bedroom. The heart of the home is an open, spacious kitchen renovated luxuriously, & stainless appliances, complemented by a large walk-in pantry. Adjoining is a cozy family room with a built-in entertainment niche. Step outside to embrace outdoor living that ensures unchanged natural views. The home also features extensive use of gleaming hardwoods, a spacious Primary suite with a sitting area, a large covered front porch. Located conveniently near parks and trails, shops & I-90. Easy commute to everything. Award winning Snoqu
1/40
$1,189,000
3 beds2.5 baths2,470 sq ft0.25 acre (lot)
6925 Elderberry Ave SE, Snoqualmie, WA 98065
Listing provided by NWMLS as Distributed by MLS Grid
Welcome to your next home in the serene landscape of Snoqualmie Ridge! This picturesque townhome offers a perfect blend of comfort, functionality, and views of beautiful Mt Si. Open concept living expands to a true dining area and eat in kitchen featuring updated stainless steel appliances and an oversized back deck perfect for summer BBQs. Two spacious bedrooms upstairs, each accompanied by its own ensuite bathroom provides both privacy and convenience for you and your guests. Downstairs features a versatile and well appointed office space with great access to the oversized garage. Enjoy ample storage space, AC in the summer, and incredible access to community amenities! HOA covers utiliti
1/26
$660,000
2 beds2.5 baths1,327 sq ft3.63 acres (lot)
35311 SE Kinsey St #403, Snoqualmie, WA 98065
Listing provided by NWMLS as Distributed by MLS Grid
Discover the essence of luxurious living in this captivating home that sits on a beautiful 2+ acre lot in the highly coveted area of Snoqualmie. This residence exudes elegance and sophistication. Step inside to find brand new carpeting and fresh paint throughout, with Geothermal heating adding a modern touch to the interior. Outside, paradise awaits, freshly painted exterior with over 15 fragrant fruit trees, a relaxing hot tub, and a sauna built into the home for ultimate indulgence. Embrace the beauty and make unforgettable memories in your new home.
1/40
$1,325,000
4 beds2 baths4,220 sq ft2.10 acres (lot)
7676 Cedar Pl SE, Snoqualmie, WA 98065
Listing provided by NWMLS as Distributed by MLS Grid
This is the one! Beautiful Camwest resale home in the heart of Snoqualmie Ridge! YMCA, health clubs, youth/community sports, restaurants, biking/hiking trails, and public tennis & basketball courts are all close by! The kitchen & dining area are well-planned for casual or formal entertaining. Large family room & main floor home office! Upstairs primary suite with a 5-piece bath, 2 walk-in closets, and stunning views of the foothills, plus 3 additional bedrooms, there is plenty of room. New carpet/paint. Huge private backyard with great potential! Quiet neighborhood. Your new home is a daily retreat from the hustle & bustle—close/easy access to Bellevue, Redmond
1/38
$1,430,000
4 beds3 baths2,949 sq ft8,564 sq ft (lot)
6210 Douglas Ave SE, Snoqualmie, WA 98065
Listing provided by NWMLS as Distributed by MLS Grid
Spectacular views of Mount Si and the Snoqualmie Valley, this custom one-story rambler is located in the gated community of Eagle Nest. A golf course home on a private 1/2 acre lot above the 14th fairway, Club at Snoqualmie. Great room with full kitchen nook and separate formal dining area. The kitchen with large center island, butler and walk-in pantries, and large outdoor deck are perfect for entertaining. Three plus bedrooms include primary suite with gas fireplace and 5 piece bathroom. Office, kitchen work areas, 1 1/2 baths, and laundry finish off the floor plan. Oversized 2 car garage. Separate shop with 1/2 bath and storage area on the lower level. Radiant heating, tankless water hea
1/32
$2,680,000
3 beds3 baths3,280 sq ft0.50 acre (lot)
36310 SE Saint Andrews Ln, Snoqualmie, WA 98065
Listing provided by NWMLS as Distributed by MLS Grid
Discover this custom-built 4-bed, 2.75-bath rambler nestled on over 10 acres of private land. Every room boasts expansive windows 9-foot ceilings & breathtaking views of the surrounding landscape. The heart of the home is the chef's kitchen, with an expansive 8-foot island, elegant quartz countertops, double ovens & dishwashers, plus a convenient wet bar. A luxurious primary suite complete with a cozy fireplace, spa-like bath w/ heated floors & tranquil soaker tub surrounded by picture windows. Step outside to the heated & fan-cooled covered patio, pre-plumbed for your future outdoor kitchen. Additionally, the property includes a detached office, fenced areas perfect
1/40
$1,575,000
4 beds3 baths2,320 sq ft10.24 acres (lot)
6137 404th Ln SE, Snoqualmie, WA 98065
Listing provided by NWMLS as Distributed by MLS Grid
This awe-inspiring estate spans an impressive 36 acres offering the perfect blend of luxury and natural beauty. Every detail has been carefully crafted to create a sanctuary of sophistication and comfort. This majestic location provides breathtaking panoramas allowing you to witness the beauty of the Northwest right from your backyard along with 800 ft of riverfront. This custom built Canadian Red Cedar log home boasts many amenities throughout. Host gatherings with ease perfect for unforgettable parties and events. Permitted use includes weddings, corporate/yoga retreats. This estate offers a gated entrance and privacy ensuring peace of mind. The rarity of this combination of acreage and s
1/40
$14,000,000
7 beds9 baths13,550 sq ft36.00 acres (lot)
8100 428th Ave SE, Snoqualmie, WA 98065
Listing provided by NWMLS as Distributed by MLS Grid
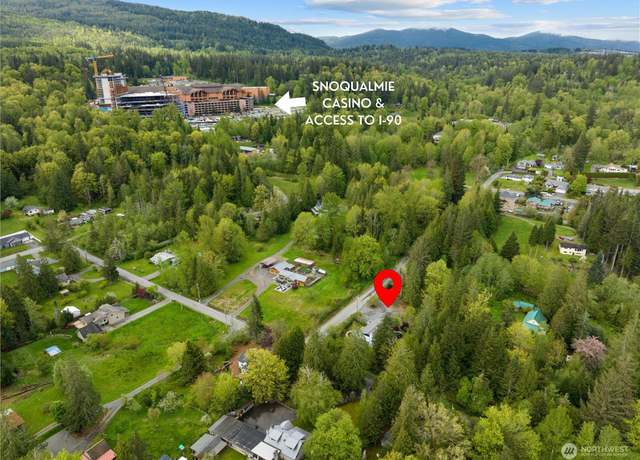
Unique opportunity to craft your dream home on 1.5 pristine acres near historic downtown Snoqualmie! Embrace the tranquil ambiance of this sun-drenched, level lot nestled in the scenic Snoqualmie Valley. Enjoy the serenity of country living while being mere moments from downtown's charming restaurants, boutiques, parks, community events, and top-rated schools. Conveniently located with easy I-90 access. Utilities including electricity, gas, and water are available on 80th St to the south. A 30-foot undeveloped public road borders the west lot line. Buyer to verify feasibility for intended use. Additional 1.5-acre parcel to the south also available for purchase. See MLS 2228674.
1/17
$235,000
— beds— baths1.50 acres (lot)
2 79XX 380th Ave SE, Snoqualmie, WA 98065
Listing provided by NWMLS as Distributed by MLS Grid
Rare chance to build your dream home on 1.5 pristine acres near the historic heart of Snoqualmie! Envision your future on this serene, sunlit lot in the scenic Snoqualmie Valley. Experience the tranquility of country living while being close to downtown's delightful eateries, shops, parks, and top-tier schools. Convenient I-90 access for easy commuting. Utilities including electricity, gas, and water are accessible on 80th St to the south. A 30-foot undeveloped public road runs alongside the west lot line, while the gentle sounds of Kimball Creek flow through the eastern end of the parcel. Buyer to verify feasibility for intended use. Add'l 1.5-acre lot to the north is also available for sa
1/17
$235,000
— beds— baths1.50 acres (lot)
1 79XX 380th Ave SE, Snoqualmie, WA 98065
Listing provided by NWMLS as Distributed by MLS Grid
Lot 4. One of two remaining acreage lots just off I-90 and a couple miles from ever-growing Snoqualmie Ridge. Super convenient to shopping and freeway access to either I-90 or SR-18 for commuting. Great opportunity to build on a large 2.52 acre lot and not be in a neighborhood with HOA or restrictive CC & R's. Power & Water available.
1/4
$474,000
— beds— baths2.52 acres (lot)
98 XX 351st Ave SE, Snoqualmie, WA 98065
Listing provided by NWMLS as Distributed by MLS Grid
Lake Creek drains placid Echo Lake and escapes to the Raging River downstream. Along the South bank of this creek are a series of smaller lots accessible with a well-established gravel road adjacent to luxury homes and fenced pasture properties. The unique location provides sun-bathed Southern exposure with a beautiful mature forest. Deemed too small for development, it is the perfect property to take advantage of all the allowed recreational uses King County allows. Recreating on this property will make you feel a thousand miles away, yet it is close to the I-90 and SR-18 interchange. Come and bring your recreational vehicle, tents, and make a campsite or build a portable mini house or ca
1/8
$79,900
— beds— baths8,181 sq ft (lot)
0 350th Ave SE, Snoqualmie, WA 98065
Listing provided by NWMLS as Distributed by MLS Grid
Serenity, Privacy & Peaceful – three words that perfectly describe this gorgeous custom home. Situated on 5 acres in the beautiful Lake Alice community, this home boasts 4 spacious bedrooms, a great-room concept & custom touches throughout. Step inside the two-story entry & you are greeted w/ hardwood floors, wood framed windows & stunning architecture. Kitchen features large island & huge walk-in pantry w/ 2nd fridge. Main floor features private guest suite w/ Murphy bed, wood burning fireplaces, covered patio & wrap-around porch. Upstairs you will love the spacious primary w/ updated spa-like bath, dual walk-ins & pvt deck. 3-car garage is w
1/40
$1,699,950
4 beds3 baths3,090 sq ft5.02 acres (lot)
32706 SE 76th St, Fall City, WA 98024
Listing provided by NWMLS as Distributed by MLS Grid
There are two tax lots included in this listing: 222407-9013, 813070-0220. Property can be assessed through Preston-Fall City Rd or Lake Alice Road SE. Sellers did not do any studies on the property; buyer to verify everything. There are some logging roads. Timber has not been harvested for more than 34 years.
1/1
$6,600,000
— beds— baths138.75 acres (lot)
5700 Lake Alice Rd SE, Fall City, WA 98024
Listing provided by NWMLS as Distributed by MLS Grid
Based on information submitted to the MLS GRID as of Sat May 04 2024. All data is obtained from various sources and may not have been verified by broker or MLS GRID. Supplied Open House Information is subject to change without notice. All information should be independently reviewed and verified for accuracy. Properties may or may not be listed by the office/agent presenting the information. Some IDX listings have been excluded from this website.
This area's enrollment policy is not based solely on geography. Please check the school district website for more information.
Elementary schools
Middle schools
High schools
GreatSchools Summary Rating
10/10
Cascade View Elementary School
Public, K-5
10/10
Timber Ridge Elementary School
Public, K-5
9/10
Snoqualmie Elementary School
Public, PreK-5
9/10
Snoqualmie Parent Partnership Program
Public, K-10
-/10
Snoqualmie Access
Public, PreK-12
School data is provided by GreatSchools, a nonprofit organization. Redfin recommends buyers and renters use GreatSchools information and ratings as a first step, and conduct their own investigation to determine their desired schools or school districts, including by contacting and visiting the schools themselves.Redfin does not endorse or guarantee this information. School service boundaries are intended to be used as a reference only; they may change and are not guaranteed to be accurate. To verify school enrollment eligibility, contact the school district directly.
Snoqualmie, Washington offers a variety of transportation options, including public transportation. The King County Metro Transit provides bus services, making commuting around the city convenient. For those who prefer driving, traffic levels can vary, but generally, the city experiences moderate traffic. Additionally, Snoqualmie is well-connected with nearby highways, such as Interstate 90, making it easy for car owners to navigate to and from the city. Learn more on our Snoqualmie city guide.
What types of properties are available in Snoqualmie?
Snoqualmie, Washington offers a variety of single-family home types, including ranch-style, split-level, and contemporary homes, among others. These homes can be found throughout the city, with many located in established neighborhoods and newer developments. Most properties feature three to five bedrooms and were built within the past 20 years. To explore different property types for sale in Snoqualmie, Washington, use the 'Home type' filter located above the active listings. Customize your search by selecting options like single-family homes, condos, townhomes, and more.
What is life like in Snoqualmie?
Snoqualmie, Washington offers a serene and picturesque living environment, surrounded by breathtaking natural beauty. The landscape is characterized by lush greenery, towering mountains, and enchanting forests, providing ample opportunities for outdoor exploration and recreation. The weather in Snoqualmie is diverse, with mild summers and cool winters, allowing for a range of seasonal activities. The region boasts a variety of job opportunities, with a focus on industries such as technology, healthcare, and education. Residents can enjoy a vibrant community with a plethora of recreational options, including hiking, biking, fishing, and exploring local parks and trails.
What are the schools and amenities like in Snoqualmie?
Snoqualmie, Washington offers a variety of public amenities for its residents. The town is home to a number of restaurants, providing a range of cuisines to suit all tastes. For those who enjoy outdoor activities, there are several parks available for leisure and recreation. Grocery shopping is convenient with multiple stores located within the town. Additionally, Snoqualmie offers other amenities like a library, fitness centers, and a post office, ensuring all resident needs are met.
In the past month, 12 homes have been sold in Snoqualmie. In addition to houses in Snoqualmie, there was also 1 condo, 2 townhouses, and 0 multi-family units for sale in Snoqualmie last month. Find your dream home in Snoqualmie using the tools above. Use filters to narrow your search by price, square feet, beds, and baths to find homes that fit your criteria. Our top-rated real estate agents in Snoqualmie are local experts and are ready to answer your questions about properties, neighborhoods, schools, and the newest listings for sale in Snoqualmie. Our Snoqualmie real estate stats and trends will give you more information about home buying and selling trends in Snoqualmie. If you're looking to sell your home in the Snoqualmie area, our listing agents can help you get the best price. Redfin is redefining real estate and the home buying process in Snoqualmie with industry-leading technology, full-service agents, and lower fees that provide a better value for Redfin buyers and sellers.


 REDFIN IS COMMITTED TO AND ABIDES BY THE FAIR HOUSING ACT AND EQUAL OPPORTUNITY ACT. READ REDFIN'S FAIR HOUSING POLICY AND THE NEW YORK STATE FAIR HOUSING NOTICE.
 United States
 Canada