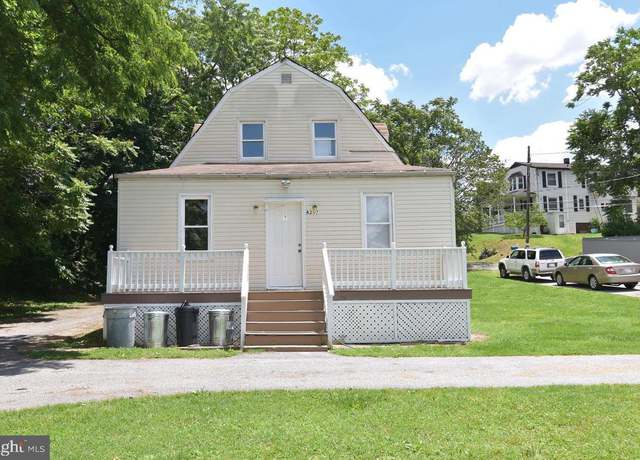
This is a must see! Main level features a large eat in kitchen with plenty of cabinets, separate dining room, family room, living room, 1 bedroom and a full bathroom. 2nd level has 2 bedrooms, a bonus room that can be a 4th bedroom or office and this bonus room also has a loft for extra space or storage, and another full bathroom. Laundry is located in the basement. An addition was built on to the home so it is larger than what tax records might say. The garage was also added on to. Plenty of storage space in the attic too. Fully fenced in yard. Garage door was just replaced. This home has been loved and cared for by the same family for many years and it is ready for the next family!
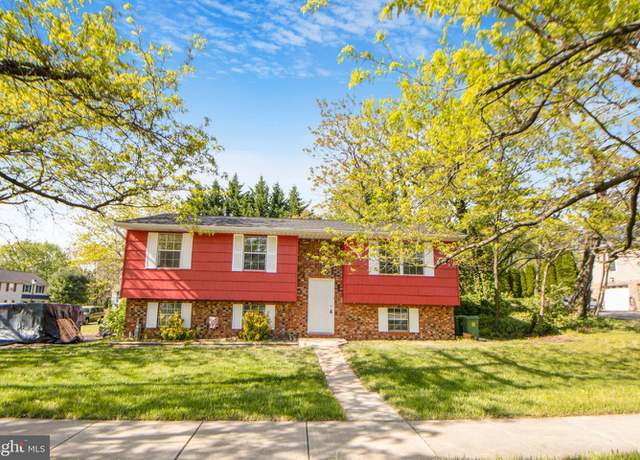
Welcome to your new sanctuary, where every detail has been meticulously crafted for modern living. This stunning 4-bedroom split-level house has undergone a complete transformation, boasting a brand-new roof that provides peace of mind for years to come. Step inside and prepare to be amazed by the gleaming new hardwood flooring that stretches throughout the home, setting the stage for a seamless blend of style and functionality. The spacious living area welcomes you with warm natural light, courtesy of the newly installed recessed lighting, creating an inviting atmosphere for both relaxation and entertainment. Indulge your inner chef in the fully renovated kitchen, featuring state-of-the-ar
Multifamily opportunity, rarely available 3-plex, separately metered and zoning approved. Modernized systems throughout, newer roof, newer siding, in-unit laundry, lead-free cert, and great yard space. Anne Arundel County. Lead free certified, Units rent for 13-1600 per unit, pictures from pre-move in, one vacant can show. Newer updates throughout the property. All units lead free, zoned and licensed; Excellent & Rare Multifamily Opportunity.
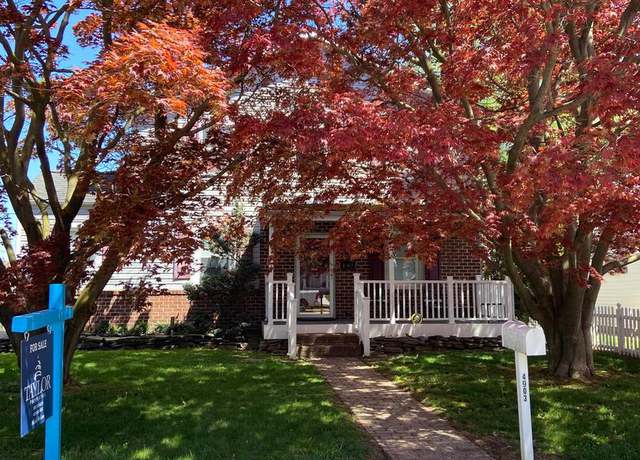
List price is Opening Bid At The Online Only Auction Sale. Bidding begins Wednesday, May 8th & ends Monday, May 13, 2024 @ 12:00 PM. Estate Sale of a Bungalow Style Home with a Large 2 Story Detached Garage, Located in the "Roland Terrace" Neighborhood in Brooklyn, Anne Arundel County. The home includes 1,824± total square feet, 3 bedrooms, 2 full/1 half baths, and a finished lower level and is situated on a private 0.14± acre lot. The main level of the home includes a living room, an eat-in kitchen, and a dining room. The main includes 3 bedrooms and 1 full bath. The lower level of the home is unfinished and includes a storage/utility room with laundry room, a
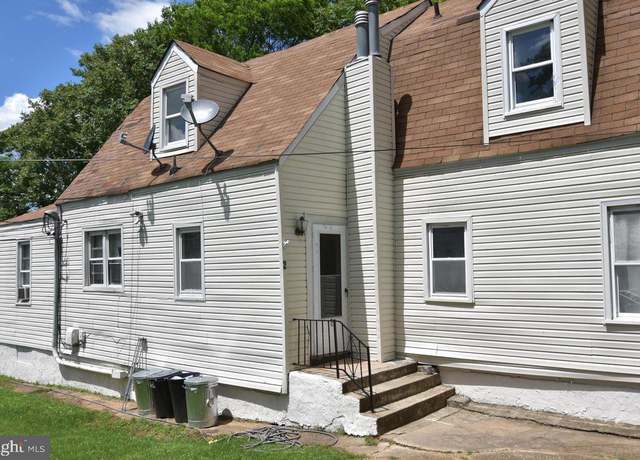
With the rising housing prices more families need to stay together to save money but want their own space? Divorcing but co-parenting and can't afford to buy 2 homes but want to live in 2 separate units on the same property? Do you own a halfway house or have roomates that don't want to share kitchens? The possibilities are endless but this estate is for you! This property is a whole vibe set up to used as a one, 2 OR 3 unit since there are 3 kitchens, full baths and separate entrances for each & all are open concept! So the square footage, bedroom & bathroom counts includes all together. Each unit has it's own flare with color changing lights with built in fans & blueto
Now is your opportunity to own a like-new Clarendon model townhome on a PREMIUM lot in the beautiful neighborhood of Cedar Hill that features its own pool, a newly opened dog park, playgrounds, a walking/bike trail, and a community center, as well as being conveniently located just minutes to BWI Airport, downtown Baltimore, MARC train transportation, downtown Annapolis, and much more! With this home, you have the best of both worlds: the comfort of living in a move-in ready, well maintained new home but with all of those new construction kinks already worked out by the current owners! As you make your way inside this highly desired main floor entry model, you will notice the beautiful luxu
WOW!! Don't miss this incredible home perched on a hill over looking Glen Burnie and the Beltway. With easy access to shopping, the airport, and the train. You will feel like you are in the country, but only be 15 minutes from down town. This stately home sits on almost an acre of land, with a huge parking pad, an over sized 2 car garage, colorful land scaping, a hot tub, and a deck. Inside features wood floors through out the home, three or five bedrooms on the main level if you want to make the offices bedrooms, a new kitchen, 3 full baths, a spacious dining room, and dual stair ways to the finished lower level with additional bedroom space a family room and a media or movie room. Things
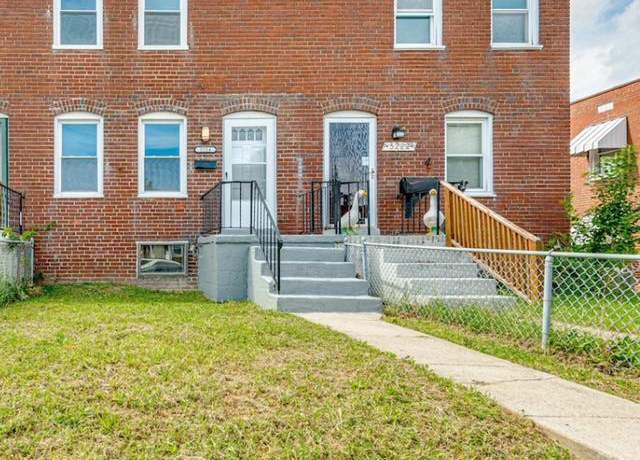
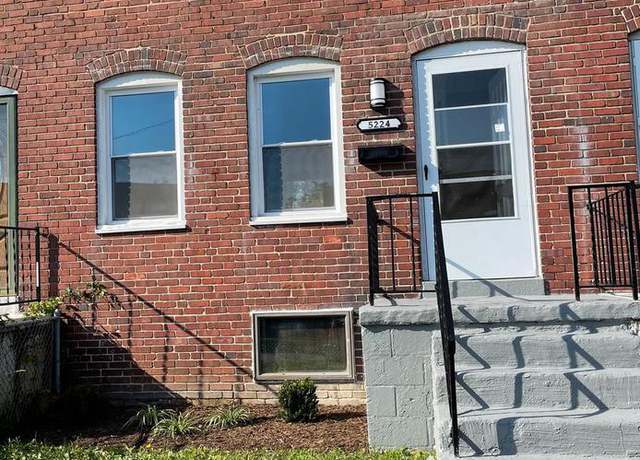
Welcome to 248 W Edgevale Road, a brick porchfront townhome in the water-oriented neighborhood of Brooklyn Park. Upon entry, you will discover an open floor plan with carpet floors from the living room to the dining area, a powder room and a nice sized eat-in kitchen with hardwood floors. The upper level features two spacious bedrooms with built-in closet and ceiling fans, and a full bath with soaking tub while the full basement has a recreation room and a utility room. Relax and have out door fun in the rear deck or the fenced front yard. This is a convenient location - situated just across the Riverside Park and a few minutes travel to local restaurants, market, schools, and hospital. D
This is an exceptional opportunity to purchase a mixed-use building located in the Brooklyn Park area of Anne Arundel County, in front of the Brooklyn Park Plaza is zoned C3 (General Commercial District), and is served by public water and sewer. Currently, the 1st unit is a (Vacant) was utilized as a salon previously, featuring a bedroom, one and a half baths, along a kitchen. The second residential unit offers three bedrooms and one full bath upstairs. rents for $1100. Additionally, the basement, equipped with both a front entrance and half/full baths, presents ample potential for further development. strictly sold as is
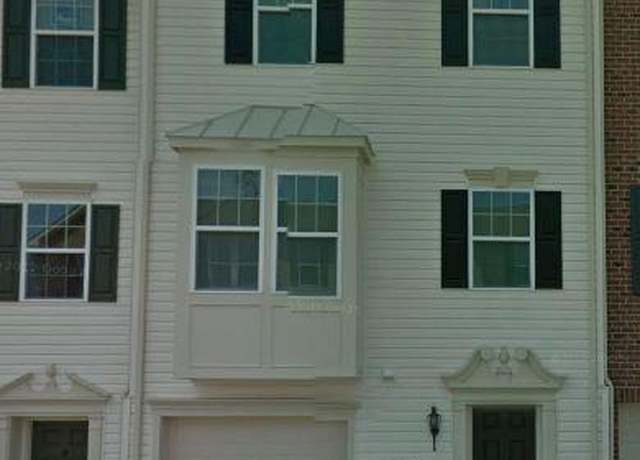
* * * Save thousands on like New Construction (Never lived in) without the large deposits and without paying all of the transfer taxes at closing. Receive a seller credit towards 2/1 rate buy down, if loan program allows, for a ratified contract on or before April 30, 2024 with preferred lender Neo Home Loans & Scott Rosenthal. Seller willing to accept offers utilizing down payment assistance programs through preferred lender. This home has never been lived in and is the former model home for Ryan Homes in this community. * * * 3 bedroom, 3.5 bathroom end unit townhome boasts a generous 1,920 square feet of beautifully finished living space. Partial stone plus an abundance of w
Attention Investors! Are you searching for your next project? Look no further! Seize this chance before it slips away. This property already boasts completed interior demolition and framing, along with rough-in plumbing installations, eagerly awaiting your final touches. Situated on a spacious corner lot, it features a generous amount of space and a small garage/shed at the rear. The main level encompasses a living room, kitchen, a sizable walk-in pantry, and rough-in plumbing for a half bathroom. Upstairs, you'll find beautifully finished raised ceilings that enhance the openness and spaciousness of the living area. With four bedrooms and 2 1/2 bathrooms, this home provides ample living sp
$5000 SELLER CONCESSION!! NO HOA!! This house is located on the Anne Arundel County side of Brooklyn Park on a quiet street. Brand new carpet install bedrooms (2/5/2024). Welcome to this 3 Bedroom, 2 Full Bathroom home, with a basement, in which a 4th bedroom could be added. The basement has a private full bathroom with its own separate entrance. This home has been well maintained throughout the years and both bathrooms have been recently updated. Brand new carpet in the living room, dining room, and upstairs hallway (2023). Full length attached outdoor deck in the backyard with enclosed storage. With a few modifications, there can be private parking in the rear. This home has Central A/C
VACANT LAND INVESTMENT OPPORTUNITY!! Two parcels consisting of 0.63 acres in Anne Arundel County, Maryland Bring your builder or ask for more information in regards. These two parcels 258 and 314 are zoned R5 and being sold in as-is condition. Call listing agent to schedule a showing.
Fourteen Acres of W3 land, there is water to the site and fire hydrants. The access is gated with paved road and partially gravel Rd. This land is perfect for storage yards or any industrial use.
Parcel located in Baltimore City with a small part in Anne Arundel County. Enter property through Brooklyn- Anne Arundel County, off Meadow Road to alley behind townhouses. No access through Potee Street. Ideal for investor, R2 zoned for townhouses.
My client is too busy with other projects, so he decided to let this one go. Mostly Cleared with Public Water and Public Sewer. Large Lot Located in a very convenient area of Baltimore City right on the Baltimore County Line, near Metro Subway and Bus Line. It is Right on Liberty Heights Ave. It is a great location. Build your Dream Home or a great opportunity for an Investor or a Developer. Some additional info in the docs.
This area's enrollment policy is not based solely on geography. Please check the school district website for more information.
Elementary schools
Middle schools
High schools
GreatSchools Summary Rating
6/10
Park Elementary School
Public, PreK-5
4/10
Brooklyn Park Elementary School
Public, PreK-5
2/10
Maree Garnett Farring Elementary School
Public, PreK-8 • Choice school
2/10
Baltimore Highlands Elementary School
Public, PreK-5
2/10
Belle Grove Elementary School
Public, PreK-5
Only showing 5 of
7 elementary schools.
School data is provided by GreatSchools, a nonprofit organization. Redfin recommends buyers and renters use GreatSchools information and ratings as a first step, and conduct their own investigation to determine their desired schools or school districts, including by contacting and visiting the schools themselves.Redfin does not endorse or guarantee this information. School service boundaries are intended to be used as a reference only; they may change and are not guaranteed to be accurate. To verify school enrollment eligibility, contact the school district directly.
Homes for sale in Brooklyn Park have a median listing price of $350K. Some of these homes are Hot Homes, meaning they're likely to sell quickly.
What are some of the most popular neighborhoods in Brooklyn Park?
Popular neighborhoods include Patapsco Park, Curtis Bay, Binks Forest of the Landings at Wellington, Brooklyn, North Linthicum, Pleasantville, Arundel Hills, Cromwell Fountain, Southern Baltimore, and Glenmore.
Brooklyn Park, Maryland boasts a well-structured transportation system that supports both car travel and public transportation. Traffic levels for driving can be moderate to heavy, especially during peak hours, requiring some planning for timely commutes. Public transportation is available, with services including buses and trains, providing an alternative to car travel. Additionally, Brooklyn Park is conveniently located near major highways and freeways, offering easy access to surrounding areas.
What types of properties are available in Brooklyn Park?
Brooklyn Park, Maryland offers a variety of single-family home types, including ranch-style homes, split-level homes, and colonial-style homes. These homes can be found throughout the neighborhood, with many located on quiet residential streets. Most properties in Brooklyn Park, Maryland feature 2-4 bedrooms and were built in the 1950s to 1970s. To explore different property types for sale in Brooklyn Park, Maryland, use the 'Home type' filter located above the active listings. Customize your search by selecting options like single-family homes, condos, townhomes, and more.
What is life like in Brooklyn Park?
Brooklyn Park, Maryland offers a unique blend of urban and suburban living. The landscape is characterized by a mix of residential neighborhoods and commercial areas. The weather in this region experiences all four seasons, with hot summers and cold winters. Job opportunities in Brooklyn Park are diverse, with a range of industries including manufacturing, healthcare, and retail. Residents can enjoy a variety of recreational activities such as exploring local parks, engaging in community events, and taking advantage of the nearby Chesapeake Bay for boating and fishing.
What are the schools and amenities like in Brooklyn Park?
Brooklyn Park, Maryland, offers a range of public amenities for its residents. The area boasts a variety of restaurants, providing a range of culinary experiences. For outdoor enjoyment, there are several parks available for leisure and recreation. Daily necessities can be conveniently purchased at local grocery stores. Furthermore, additional amenities such as libraries, gyms, and community centers are also available to enhance the lifestyle of Brooklyn Park residents.
In the past month, 29 homes have been sold in Brooklyn Park. In addition to houses in Brooklyn Park, there were also 0 condos, 36 townhouses, and 1 multi-family unit for sale in Brooklyn Park last month. Find your dream home in Brooklyn Park using the tools above. Use filters to narrow your search by price, square feet, beds, and baths to find homes that fit your criteria. Our top-rated real estate agents in Brooklyn Park are local experts and are ready to answer your questions about properties, neighborhoods, schools, and the newest listings for sale in Brooklyn Park. Our Brooklyn Park real estate stats and trends will give you more information about home buying and selling trends in Brooklyn Park. If you're looking to sell your home in the Brooklyn Park area, our listing agents can help you get the best price. Redfin is redefining real estate and the home buying process in Brooklyn Park with industry-leading technology, full-service agents, and lower fees that provide a better value for Redfin buyers and sellers.


 REDFIN IS COMMITTED TO AND ABIDES BY THE FAIR HOUSING ACT AND EQUAL OPPORTUNITY ACT. READ REDFIN'S FAIR HOUSING POLICY AND THE NEW YORK STATE FAIR HOUSING NOTICE.
 United States
 Canada