EXPERIENCE PEACE OF MIND, BODY AND SOUL AT THIS LIFETIME HOME. WITH THE INSTALLATION OF A 50-YEAR ARCHITECTURAL SHINGLED ROOF AND STUNNING HARDI PLANK SIDING, A 50 YEAR+ FIBER CEMENT PRODUCT, AND A $10,000 RECENT RE-LINING OF THE SEWER DRAIN TO THE STREET, YOU ARE MAINTENANCE FREE FOR AS LONG AS YOU'LL BE HERE. BAHAMA SHUTTERS ADD THE PERFECT FINISHING TOUCH. PLENTY OF "ROCK THE BLOCK" VALUE-ADDED IMPROVEMENTS, BUT, WITH VINTAGE TOUCHES THROUGHOUT: CORNER DINING ROOM BUILT-IN CUPBOARDS, CLAWFOOT BATHTUB AND HARDWOOD FLOORS THROUGHOUT. ENTERTAIN AND RELAX IN YOUR OWN PRIVATE NATURE PRESERVE AT THIS NO-TRAFFIC LINTHICUM LOT LOCATION. STAMPED CONCRETE REAR PATIO WITH RETRACTABLE AWNI
Super buy for this 4 bedroom, 3 full bath home with in-ground pool in sought after Linthicum Heights! Recent updates include; professionally painted inside and out, brand new LVP flooring thru-out main level, brand new upper level carpeting and more! Kitchen features white cabinets, granite counter tops and stainless appliances. Fully finished lower level perfect for family/rec room/office or potential 5th bedroom. Summer is coming – enjoy the huge covered patio overlooking the in-ground pool. Great entertaining area! Fully fenced rear lot has spacious 2-bay storage shed/workshop. Plenty of off-street parking too! Gas heat & central a/c! No HOA or front foot assessments.
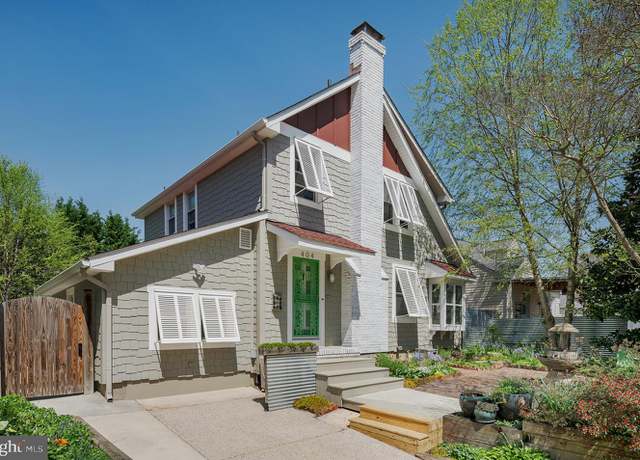
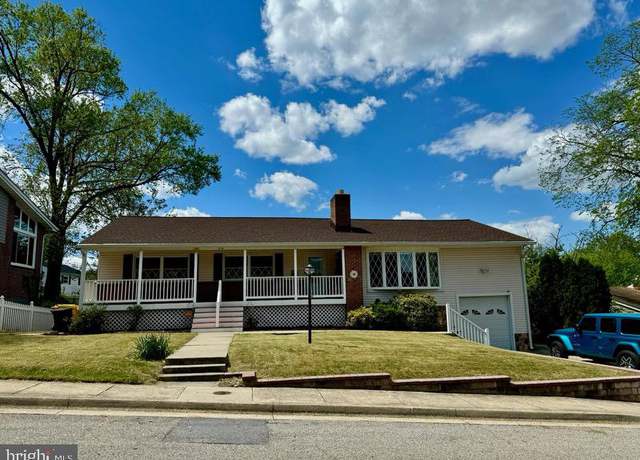
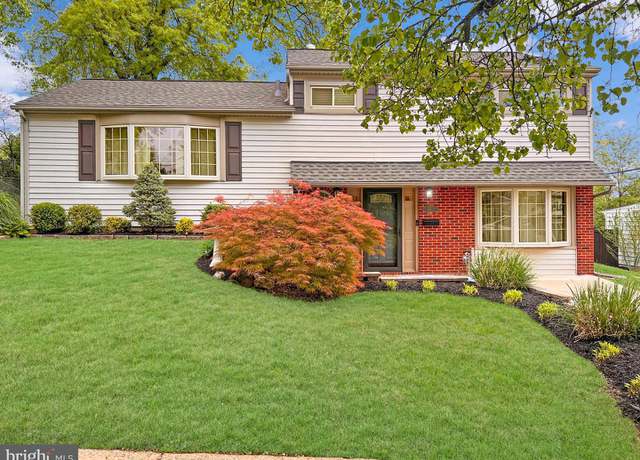
Welcome to this charming rancher nestled in an established neighborhood in Linthicum Heights! This spacious porch-front residence offers everything you've been searching for. Step inside to a grand foyer featuring a convenient coat closet, setting the tone for all the convenience that is to come. Boasting 4 bedrooms on the main level, including a luxurious ensuite bath, this home ensures comfort and convenience for the whole family. A formal living room with a cozy fireplace and dining/family room combo is perfect for entertaining, complete with sliders leading to the inviting Trex decks. Bask in natural light pouring through bay windows, illuminating the gleaming hardwood floors throughout
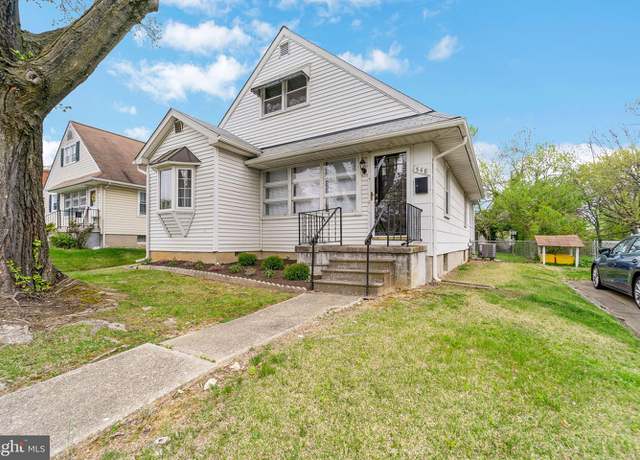
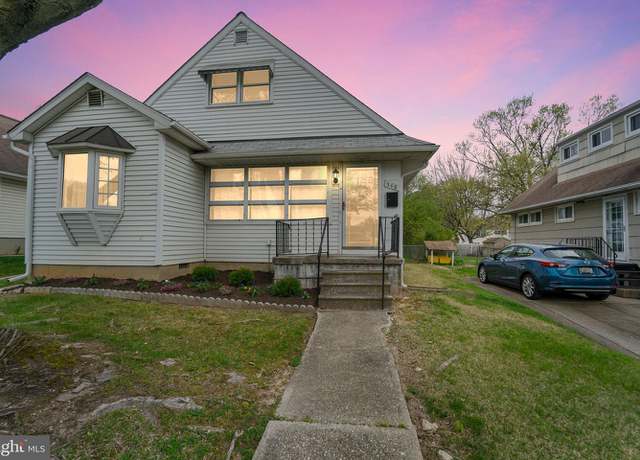
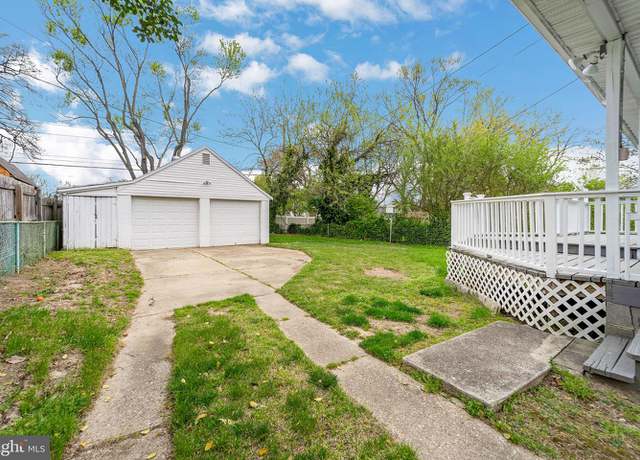
Welcome to 548 Shipley Rd in Linthicum Heights, MD! This charming property offers a perfect blend of comfort and functionality, featuring four spacious bedrooms and a bonus room in the basement, ideal for a home office, gym, or guest quarters. Property features over 2,000 finished living square footage. Step into the bright and modern kitchen, equipped with sleek stainless steel appliances, perfect for culinary adventures and entertaining guests. Stay comfortable year-round with the brand-new HVAC system providing central air throughout the home, ensuring a cozy atmosphere regardless of the season. Step outside to find a generous deck that overlooks the expansive backyard, providing the per
Updated 3 level home in Linthicum. Bright and airy open eat-in kitchen with granite counter tops. plenty of counter space and cabinets. Cathedral ceilings in living room. Enclosed porch off the kitchen, great for a work room or gym. Spacious bedrooms and updated open basement. Enjoy the large fenced back yard, great for entertaining. Newer roof. Convenient to Rt. 695.
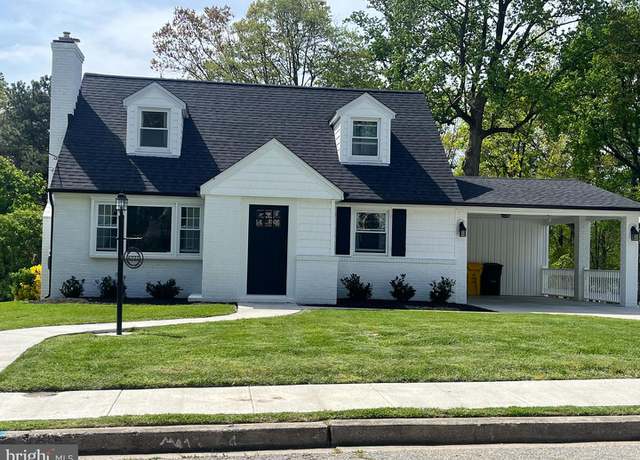
* * $10,000 Price Reduction. .. Seller is Offering 3% Closing Cost Assistance for Full Price Offer, Combine That With a Down Payment Assistance Program Means You Can Purchase this Home With Little Money Out of Pocket * * This three-level Cape Cod, embodies modern comfort and convenience. Stepping through the front door, you're immediately struck by refinished hardwood floors that flow seamlessly throughout the main level. Recessed lights overhead illuminate the space and create an inviting ambiance. .. Modern open-concept kitchen, equipped with stainless steel appliances and ample counter space for meal preparation. Crisp white cabinetry offers plenty of storage, while a stylish backspl
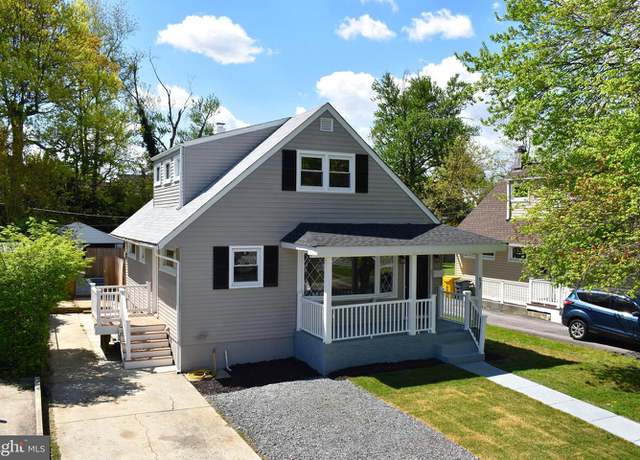
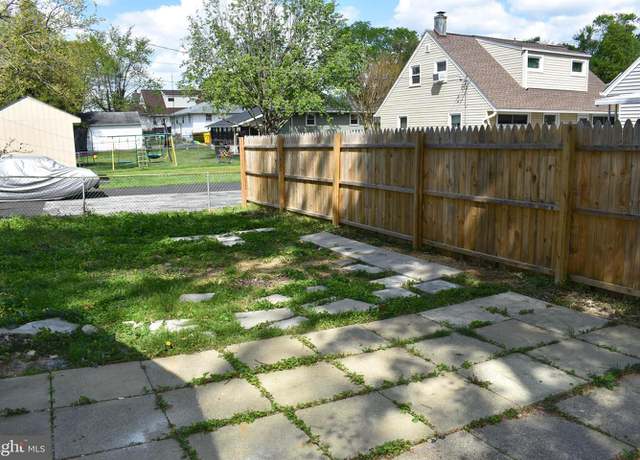
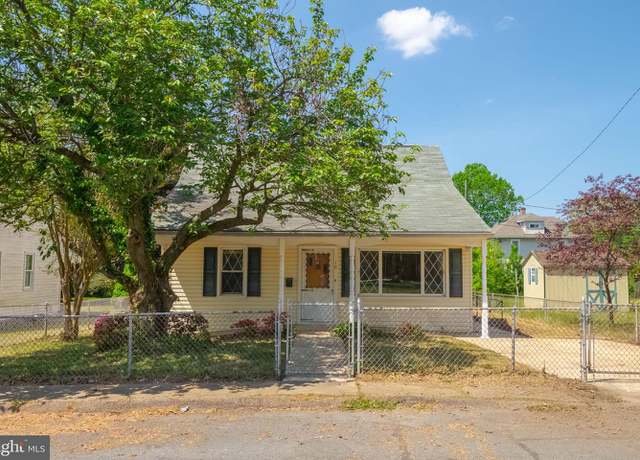
OFFER DEADLINE Thursday 5/2 at noon. .. .INVESTOR ALERT! Great Investment Opportunity in Ferndale/Glen Burnie. 4 Beds/1 Full Bath Cape Cod. Home needs work but will make a great renovation and/or rental opportunity. After Repair Value (ARV) between $350K-$380K. Priced to Sell! Home includes hardwood floors, screened back porch, covered front porch, fenced yard with a 1-car driveway for off-street parking. All cleaned out and ready for renovations! Home is being sold AS-IS. Add this one to your investment portfolio today!
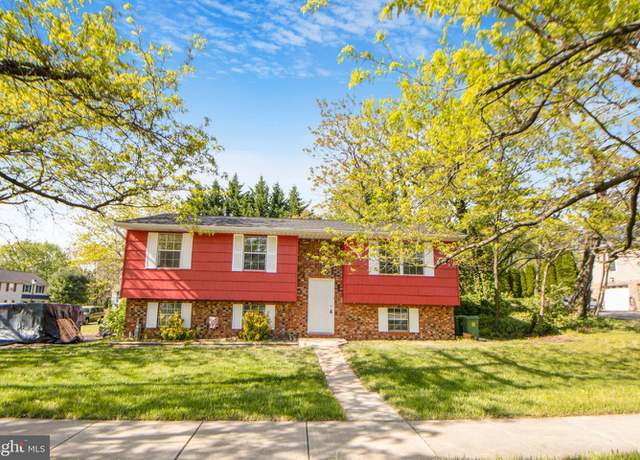
Welcome to your new sanctuary, where every detail has been meticulously crafted for modern living. This stunning 4-bedroom split-level house has undergone a complete transformation, boasting a brand-new roof that provides peace of mind for years to come. Step inside and prepare to be amazed by the gleaming new hardwood flooring that stretches throughout the home, setting the stage for a seamless blend of style and functionality. The spacious living area welcomes you with warm natural light, courtesy of the newly installed recessed lighting, creating an inviting atmosphere for both relaxation and entertainment. Indulge your inner chef in the fully renovated kitchen, featuring state-of-the-ar
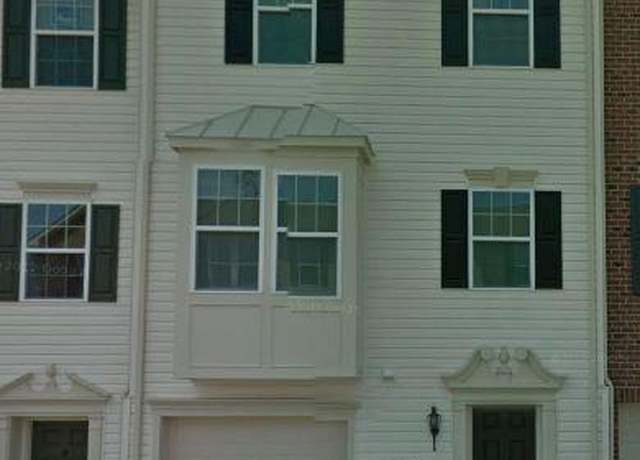
Welcome to your new home in this charming small townhouse community, offering the perfect blend of comfort and convenience. This spacious townhouse features three bedrooms and 1.5 baths, providing ample space for your family to grow and thrive. As you enter, you're greeted by an open-concept living room and dining area, creating a welcoming space for gatherings and relaxation. The kitchen is a chef's delight, with modern appliances and a island perfect for meal prep or casual dining. Adjacent to the kitchen, overlooks the fenced backyard, offering a serene retreat for outdoor enjoyment and privacy. Upstairs, you'll find three cozy bedrooms, each offering plenty of natural light and closet
.Great space in this 3 BD 2 Ba Townhouse. located on a dead end street. Large Living room/dining room with vinyl plank flooring. Large Eat in Kitcchen with Maple Kitchen cabinets , granite countertops, SS Microwave, Stove, Dishwasher and Top Mount Referigerator with Ice maker . Slider to new deck off kitchen. Good size bedroom upstairs with ample closet space. . Hall Bathroom totally remodeled with vinyl plank flooring, new shower/tub, ceramic tile walls, Vanity and tiolet. Professionally painted thru out, New carpeting installed on 2nd floor and stairs. New Flooring and Vanity in Primary Bathroom. Enjoy the finished room in the lower level. Laundry in unfinished section of back of basemen
Fully remodeled home in Halethorpe with several distinguishing inside features including 9-foot ceilings, an oversized primary bedroom, newer Alside Ultramaxx large double pane tilt-out windows, and all-wood blinds!! Rest assured, you will not find another house like it in the area!! Thick and high-quality carpet in the bedrooms, family room, and basement!! The moment you walk in the back door you'll notice a modern kitchen with a vaulted ceiling, laminate flooring, accent lighting, 36-inch Chestnut soft-closed cabinets, a wine rack, a tambour cabinet, and stainless steel appliances. Cozy home office just off the kitchen with laminate flooring, 9-foot ceilings, a walk down to the basement,
Looking to build your dream home or invest in valuable real estate? Don't miss out on this incredible opportunity to own land in Anne Arundel County, Maryland! We are offering two spacious lots, total 4,950 square feet, perfect for building your custom residence or for investment purposes. Close proximity to major highways, transportation hubs, and essential services for easy commuting and everyday convenience. Lot currently without road access.
Welcome to 1137 Kelfield Drive - Spacious Garage Townhome with 3 Bedrooms and 2.5 Bathrooms. The lower level has a Foyer, Family Room (can easily be used for a 4th Bedroom), Half Bath, and Garage entrance. Walk up one level to the Kitchen that has space for a table, Pantry, slider to the Deck, Dining Area, and large Living Room. The Primary Bedroom is on the upper level and has a full Bath, two additional Bedrooms, Full Bathroom, and linen closet. New Carpet on steps and Hardwood Flooring throughout. Roof is 2 years old, washer/dryer 2020, and windows have a lifetime warranty (seller will transfer to the new buyer). PERFECT LOCATION!!! Convenient To 95, 295, 695, Patapsco State Park, BW
Multiple offers received, seller has called for Higher and Best, a decision will be made on Monday. Welcome to this beautiful Split level located on quite cut de sac. Conveniently located in the heart of Glen Burnie close to shops, restaurants and major commuter routes. The home has spacious bedrooms, hardwood floors through out, the open living room and dining room gets a lot of natural sun light, Oversized deck with a screened in porch that backs to a wooded area.
* * PRICE REDUCED FOR QUICK SALE. ALMOST NEW HOME IN HANOVER NEAR ARUNDEL MILLS. THIS 3 BEDROOM HOME WITH OPTIONAL 4TH ROOM ON THE MAIN LEVEL IS MOVE-IN READY. THE HOME FEATURES TWO FULL BATHS, TWO HALF BATHS, A SPACIOUS 2-CAR GARAGE, LARGE AND LUXURIOUS MASTER BATHROOM, ENERGY STAR APPLIANCES AND PLENTY OF CLOSET SPACE. THE 10-YEAR BUILDER WARRANTY IS TRANSFERABLE . THIS HOME IS PRIMELY LOCATED MINUTES FROM MAJOR TRANSPORTATION ROUTES (B/W PARKWAY, 95, 100, 97) AS WELL AS THE MARC AND AMTRAK STATION. BRING YOUR OFFER TODAY AS THIS HOME WON'T BE AVAILABLE FOR LONG. IF UNWELL, PLEASE DO NOT SCHEDULE SHOWINGS. PLEASE REMOVE YOUR SHOES UPON ENTRY. HOME HAS VIDEO SURVEILLANCE AND ALL SHOWINGS
Welcome Home to 4400 Norfen Rd. Beautiful End Of group Town Home with 3 bed 2 Remodeled Full baths, Granite kitchen counter Tops New Cabinets, Hardwood floor updated Washer Dryer. Fenced backyard with shed, off street parking. Very close to school and shopping. Show it any Time with one hour notice.
Approximately 6,000 Square Feet of level, cleared land. Lots 21, 22, and 23, Block H, Halethorpe Terrace Subdivision. According to the plat each lot is 20 feet wide by 100 feet deep. DR2 Zoning. Buyer is responsible for determining if a permit can be obtained from Baltimore County to build a single family house. Close to Routes 695, 95 and 295. Buyer to pay all docs and transfer taxes.
School data is provided by GreatSchools, a nonprofit organization. Redfin recommends buyers and renters use GreatSchools information and ratings as a first step, and conduct their own investigation to determine their desired schools or school districts, including by contacting and visiting the schools themselves.Redfin does not endorse or guarantee this information. School service boundaries are intended to be used as a reference only; they may change and are not guaranteed to be accurate. To verify school enrollment eligibility, contact the school district directly.
Homes for sale in Linthicum have a median listing price of $397K. Some of these homes are Hot Homes, meaning they're likely to sell quickly.
What are some of the most popular neighborhoods in Linthicum?
Popular neighborhoods include Patapsco Park, Garland, Binks Forest of the Landings at Wellington, Kingston Heights, North Linthicum, Pleasantville, Relay, Wynnewood, Arundel Hills, and Southern Baltimore.
Linthicum, Maryland boasts a robust transportation system with several options for residents. The area is well-served by public transportation, including buses and light rail services, providing convenient alternatives to car travel. For those who prefer driving, traffic levels can be high during peak hours, but generally manageable. Additionally, Linthicum's strategic location near major highways and freeways like I-695 and I-195 facilitates easy commutes and travel.
What types of properties are available in Linthicum?
Linthicum, Maryland offers a variety of single-family home types, including ranch-style homes, split-level homes, and colonial-style homes, among others. These homes can be found throughout the Linthicum area, providing a range of options for potential buyers. Most properties feature three to four bedrooms and were built in various years. To explore different property types for sale in Linthicum, Maryland, use the 'Home type' filter located above the active listings. Customize your search by selecting options like single-family homes, condos, townhomes, and more.
What is life like in Linthicum?
Linthicum, Maryland offers a peaceful and serene living experience with its charming landscape. The region boasts a variety of natural elements, including lush green spaces and picturesque views. The weather in Linthicum is characterized by mild winters and warm summers, providing a pleasant climate throughout the year. The area presents a range of job opportunities across different industries, ensuring a diverse and thriving economy. Residents can engage in numerous recreational activities, such as exploring local parks, participating in community events, and enjoying the vibrant dining scene.
What are the schools and amenities like in Linthicum?
Linthicum, Maryland, offers a variety of public amenities to enhance the lifestyle of its residents. The town boasts a selection of restaurants, providing a range of culinary experiences. For those who enjoy outdoor leisure, there are several parks available for relaxation and recreation. Daily necessities can be conveniently obtained from a number of grocery stores located within the town. Additionally, Linthicum offers more amenities such as libraries, fitness centers, and schools, all contributing to a comfortable and convenient living environment.
In the past month, 8 homes have been sold in Linthicum. In addition to houses in Linthicum, there were also 0 condos, 1 townhouse, and 0 multi-family units for sale in Linthicum last month. Find your dream home in Linthicum using the tools above. Use filters to narrow your search by price, square feet, beds, and baths to find homes that fit your criteria. Our top-rated real estate agents in Linthicum are local experts and are ready to answer your questions about properties, neighborhoods, schools, and the newest listings for sale in Linthicum. Our Linthicum real estate stats and trends will give you more information about home buying and selling trends in Linthicum. If you're looking to sell your home in the Linthicum area, our listing agents can help you get the best price. Redfin is redefining real estate and the home buying process in Linthicum with industry-leading technology, full-service agents, and lower fees that provide a better value for Redfin buyers and sellers.


 REDFIN IS COMMITTED TO AND ABIDES BY THE FAIR HOUSING ACT AND EQUAL OPPORTUNITY ACT. READ REDFIN'S FAIR HOUSING POLICY AND THE NEW YORK STATE FAIR HOUSING NOTICE.
 United States
 Canada