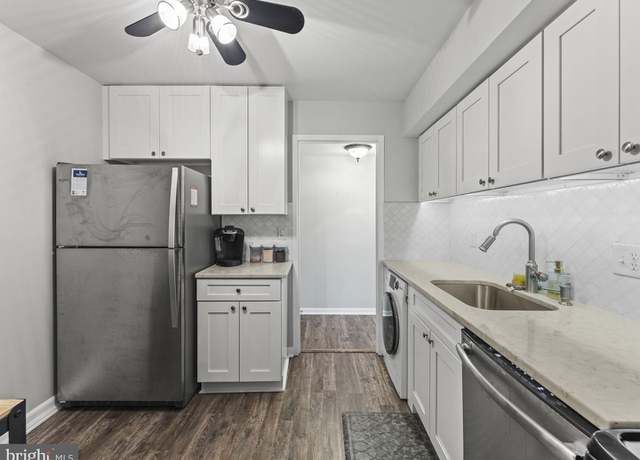
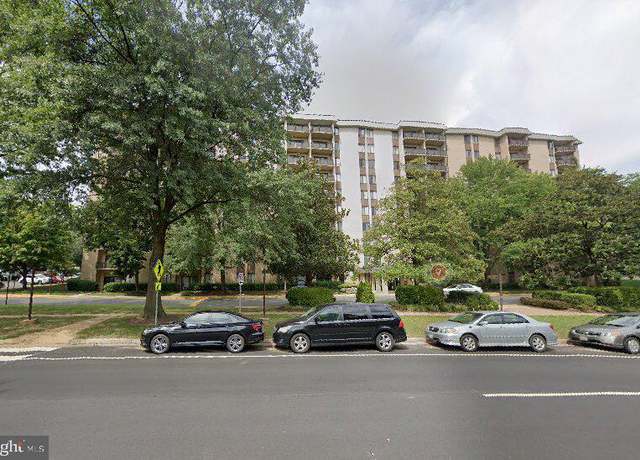
Welcome to the Woodlake Towers high rise! This immaculate 2-bedroom, 1-bathroom corner unit condo offers modern-day conveniences and turnkey living, boasting nearly 1,000 sq feet of space. Step into the eat-in kitchen, where you'll find quartz counters, custom white cabinetry, stainless steel appliances, a marble backsplash, and shutter doors for added versatility. The home features designated main living areas, including a separate living room and dining space, as well as your own private balcony. The first bedroom showcases a charming sliding barn door, adding a modern touch to the space. Towards the end of the unit, you have the second bedroom with double-sized closets, perfect for all y
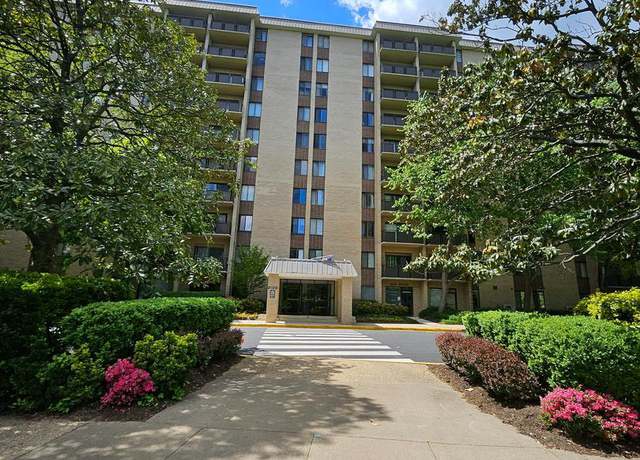
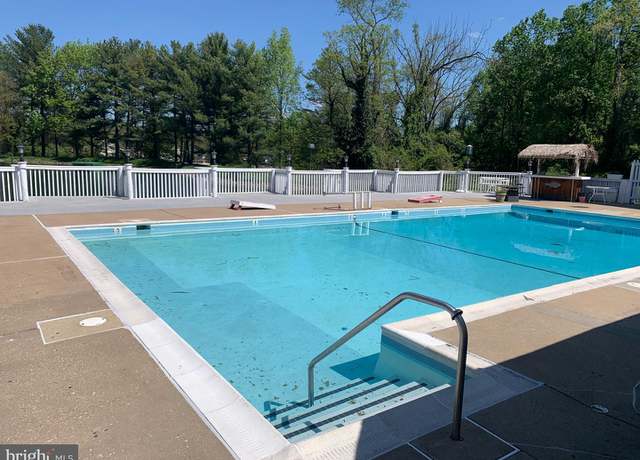
Conveniently located between Arlington Blvd(Rt. 50) and Leesburg Pike(Rt. 7) only about 6 miles to the DC entrance and only a mile to 7-Corners and Bailey's Cross Rd. Shopping centers, grocery, and restaurants are all within half a mile. These Woodlake Towers Condominiums are well managed and the management office is onsite. Woodlake Towers Condominium is surrounded by mature tall trees, sidewalks, tons of parking, an outdoor swimming pool, and a tot lot. Amenities include a fitness center, a library with wi-fi, an outdoor swimming pool, a tot lot, a parking garage, and an on-site management office. The front and all other entrances are locked and only accessible with electronic fobs.
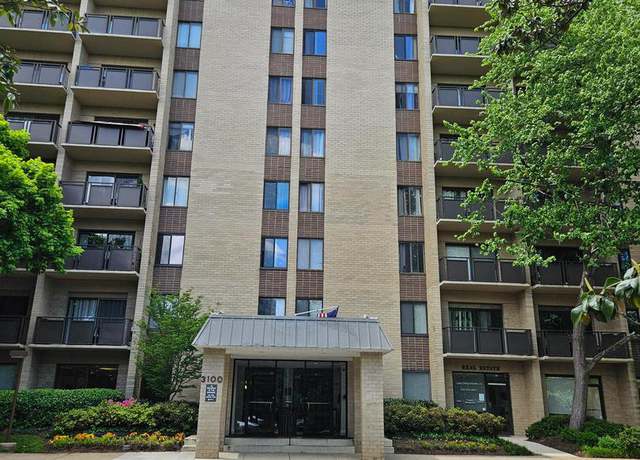
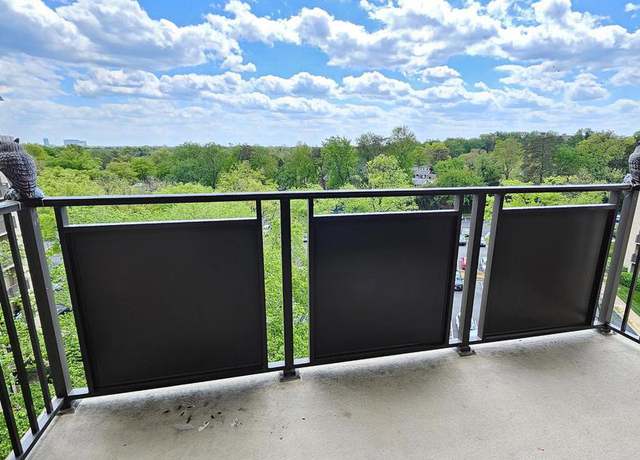
Online Auction Ends May 7th at 7:30PM - This charming residence at 3100 South Manchester Street, Apt. #620, in Falls Church, VA, represents an exciting investment opportunity. Nestled in a peaceful community, this property boasts a serene environment with well-kept landscaping and lush green spaces. Its ideal location offers residents the benefits of both tranquility and convenience, with quick access to nearby shopping centers, a variety of dining options, and entertainment venues. It is an excellent choice for those seeking an investment with great potential in an attractive and well-connected location. The list price is the opening bid for the online-only auction. An auction deposit of $
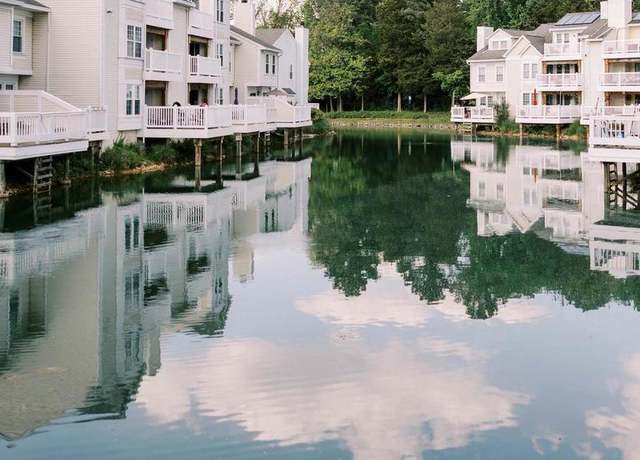
Beautifully updated, 1 level condo living on the first floor, with an unbelievable view overlooking the lake! 2BR/1BA condo with large deck, recently updated and ready for you to move in! Plenty of parking with one assigned parking place. Like new kitchen, stainless steel appliances, butcher block counter tops. Beautiful laminate wood grain flooring throughout the unit and a wood burning fireplace in the living room. The deck can be accessed byway of the master bedroom or the living room. Updated bathroom. Community pool, tennis court, & dog run. Excellent location. Hurry, this one will not last long!
1/3
$499,000
2 beds1 bath1,049 sq ft
3337 Lakeside View Dr Unit 7-3, Falls Church, VA 22041
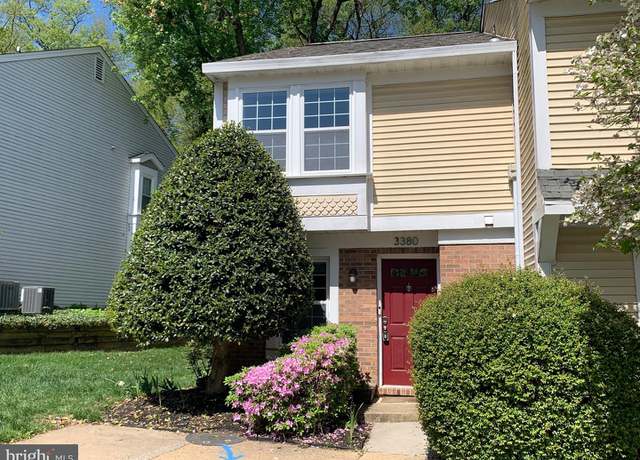
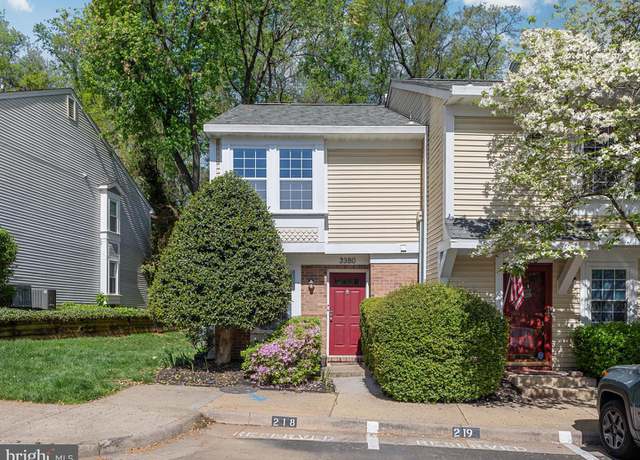
Rarely available END UNIT townhouse-style condo in the beautiful lake community of Water’s Edge! Enjoy the modern smart home technology found throughout, such as IKEA remote-controlled window blinds, Ecobee thermostat, USB ports/outlets in multiple rooms, and Ecobee smart switches with Alexa Virtual Assistant, Night Light, and Motion Detector. Additional home features, updates, and renovations include whole-house painting (2019), most windows fully replaced just this month (April 2024), Trane HVAC (2017), State water heater (2014), renovated kitchen with freshly stained cabinets, track lighting, stainless steel appliances (2019), luxury quartz countertop with tile backsplash (2024), a
1/27
$529,000
2 beds2.5 baths1,108 sq ft
3380 Lakeside View Dr Unit 14-1, Falls Church, VA 22041
Immerse yourself in the comfort and elegance of this recently renovated 1-bedroom, 1-bathroom condo, a testament to modern urban living. The transformation includes sleek, no-carpet flooring and a contemporary kitchen adorned with new cabinets and quartz countertops. Flooded with natural light through north-west facing windows, this home offers a warm and inviting ambiance. Located just a few miles from Washington DC, it provides easy access to notable landmarks such as Amazon HQ2, the Pentagon, and Tyson's Corner, facilitating a smooth commute. The property is also conveniently situated 2.5 miles from downtown Arlington and the Ballston Metro Station, with the East Falls Church Metro Stati
STUNNING 4BR + 3BA rambler in one of Falls Church's most sought after neighborhoods, Ravenwood Park! This meticulously renovated home boasts aesthetically and functionally optimized upgrades throughout to provide a bright and open layout with top-end finishes. Gleaming hardwood floors on the main level and luxury tile flooring in the basement. Elegantly upgraded gourmet kitchen with granite countertops, stainless appliances and custom backsplash opening to a beautiful screened-in porch with steps to the backyard. Relax by the fire in the cozy living room with a wood burning stone fireplace. You will find the primary and secondary bedrooms on the main level to be quite gracious in size. The
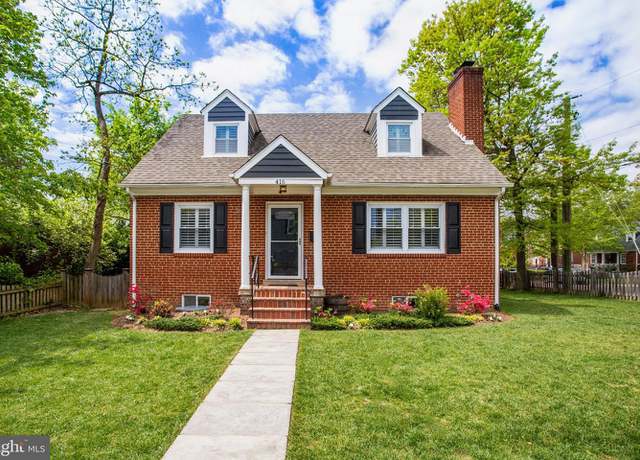
OPEN HOUSE SATURDAY 5/4 from 2-4pm and SUNDAY 5/5 from 12-2pm. Fabulous home in lovely neighborhood! Large, flat, fenced yard. This expanded Cape Cod is as cute as a button and larger than it looks from the front. Approximately 2800 square feet! 4 bedrooms and 4 full bathrooms with a home office, a recreation room and laundry room on the lower level, plus a family room, dining room, living room, kitchen on the main level. There is a large screened-in porch that can be enjoyed almost all year round. This home has a considerable amount of storage space. On the lower lever there are two bonus rooms for storage, plus there are many closets throughout the home. The primary suite has a large
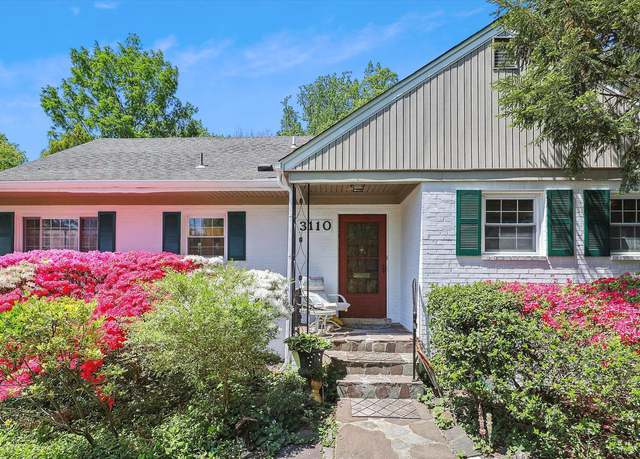
Home sweet home! Here's your chance to make this wonderful 3 level brick rambler your own. This is a fabulous house in need of some simple updating. Charming curb appeal and in Sleepy Hollow Manor neighborhood - wonderful community plus easy commute! Main level of house perfect for one level living with 3 bedrooms, kitchen, dining, living room, full bath. But that is not all! Upper level has two large bedrooms/offices and half bath. Lower level is huge rec room with wood burning fireplace, plus huge storage space - with full bath - walk out level - large picture windows! This yard is slightly larger than many in neighborhood- extended in the back - private, peaceful setting - feels like a
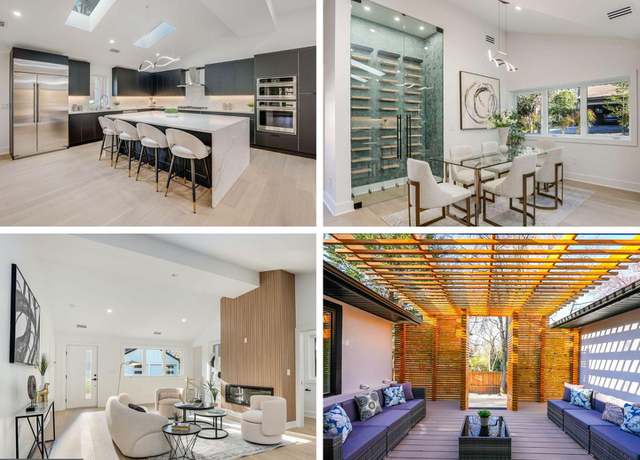
Open House Sunday 2:00 to 4:00pm! Introducing a breathtaking embodiment of modern living in Falls Church, VA, this Cozy Modern Home is a testament to architectural brilliance and meticulous craftsmanship. Built upon an existing foundation, every inch of this contemporary sanctuary has been touched and refined to perfection, offering a living experience that resonates with passion and elegance. Spread across just under 3000 sqft, this home unfolds into an open, modern space accentuated by high ceilings, 5 strategically placed skylights, and a bespoke wine display that captures the essence of sophistication. The heart of the home, a chef's modern kitchen, is adorned with European style custom
Step into the realm of your wildest dreams as you cross the threshold of this enchanting sanctuary nestled in the heart of North Arlington. Behold, a captivating symphony of modern elegance and timeless charm awaits you in this exquisitely crafted 5 bedroom, 3.5 bath haven. Your journey begins as you grace the all-hardwood main level, where a majestic two-story foyer extends a warm embrace, beckoning you deeper into its embrace. Ascend the staircase, newly carpeted, leading you to a realm of ethereal beauty and unparalleled comfort. Within the embrace of this luminous abode, discover an opulent living room adorned with three grand windows, allowing the golden rays of sunlight to dance freel
Welcome to this freshly renovated home, boasting four bedrooms, three bathrooms and nestled in an idyllic neighborhood. Step inside to discover the modern charm of your new home. The spacious living area welcomes you with abundant natural light, filtering through large windows and creating an inviting ambiance. Adorned with gleaming hardwood floors and freshly painted walls, the open-concept layout seamlessly connects the living room, dining area, and kitchen. Perfect for both entertaining and everyday living. The gourmet kitchen is a chef's dream, featuring brand-new stainless steel appliances, quartz countertops, tile backsplash, and ample cabinet space. Whether you're preparing a casual
Discover the Pinnacle of Refinement at 3331 Mansfield Road, Falls Church, VA – A 2024 Renovated Retreat Introducing an unparalleled residence where sophistication meets state-of-the-art renovation in the idyllic surroundings of Falls Church. Fresh off a comprehensive 2024 rejuvenation, this 4-bedroom, 2.5-bathroom abode extends over 2500 sq ft of thoughtfully designed living space across three levels. From the first glimpse, the home asserts its distinction with a new architectural shingle roof, energy-efficient windows, and a welcoming entrance set amidst newly landscaped grounds. A new, expansive deck offers a tranquil escape or the perfect backdrop for your social events in the ser
NONE BETTER! * * Sought-after Falls Church City location, 1/2 mile walk to Metro, impressive $65,000 unit renovation just completed! * * Light & bright living spaces great guests with a cool grey color palette and LVP flooring throughout. Seriously spacious, this unit has room to seat 5 comfortably at both the dining table and in the living room; a great spot for your next dinner party! Recessed lighting helps brighten the unit any time of the day. The kitchen has ample storage with beautiful soft-close cabinetry, plus a separate pantry! Stainless appliances, quartz counter tops, and a textured subway tile back splash help make this a great place to cook. The primary suite feature
This single family home is equipped with an elevator making traveling between all three levels a breeze. The Grove at Dominion Hills is Toll Brothers newest single-family home community located in Arlington. The main level boasts a 5” cool toned engineered hardwood which flows into the Primary Bedroom. The kitchen features a white Quartz waterfall island complimented by Painted Gray shaker style cabinets, honey bronze hardware and our Jenn Air appliance package. The study is enhanced by glass doors to bring in ample natural light. Enjoy entertaining with the butler pantry which mimics the kitchen selections and the large dining room with a striking gold chandelier. The Primary Bedroom
STUNNING NEW CONSTRUCTION to be built in sought after Bonair neighborhood or on your lot. A timeless masterpiece beautifully constructed to inspire and entertain. This thoughtfully designed and TRULY custom-built home is for those looking for a functional residence boasting brilliant contemporary architecture, high-tech features and unbeatable location! Spanning over 6,500 sq ft of living space, this home features premium building materials combined with lavish finishes. This exceptional home will captivate you with its open floor plans, clean lines, high ceilings, floor to ceiling windows, screen porch and multiple balconies. Natural light fills the home through its expansive glass walls.
* * WELCOME TO THE BEST SELLING ADDISON PLAN BUILT BY EVERGREENE HOMES!! * * * * This Addison at base comes with over 3700 SF, 4 BR and 3.5 BA total. . The main floor boasts 10ft ceilings and will feature our Deluxe Kitchen with Dacor Appliances, dual wall oven, with slide in range and six burners. Complete with a morning room offering additional natural lighting as well as an informal dining area. Early enough in the process, you can still make selections on hardwood, countertops, cabinets and optional rooms! Create your dream home in this Addison capable of reaching 5300 SF! Additional rooms in the basement can include a media room, a large rec room, exercise room, and additional be
Motivated Seller!!! Nestled in a prime locale is this rare opportunity for a one bedroom unit at The Madison Condominium in Falls Church City. It is a commuters dream! Huge living/dining space, updated kitchen with granite countertops. Updated bathroom and a very spacious bedroom. New carpet throughout. Large windows to allow tons of natural light. * * ALL utilities included for easy budgeting. Storage bin in basement is well lit and clean so you can free up space in your unit. Located just blocks to East Falls Church Metro. A short distance, driving or walking, to a diverse selection of restaurants and shopping. Minutes to major commuter routes to include Rt66, Rt 50, Rt 7 and Rt29. C
SAMPLE LISTING- Love everything about this home. The Rouse home design offers well-appointed kitchens boasting stainless-steel appliances, granite countertops, and ample storage space. A luxurious primary bathroom also offers granite countertops, dual sinks, and a private water closet. Create your ideal living space with a generous office located on the first floor. Perfectly situated in Dominion Hills which was ranked the #2 neighborhood in Virginia to raise a family by Niche.com. Just minutes away from everyday conveniences, this community will enhance your families daily routine. Build your Rouse home design today and give us a call to learn more about our personalization options, home s
Bailey's Upper Elementary School For the Arts And Sciences
Public, 3-5
School data is provided by GreatSchools, a nonprofit organization. Redfin recommends buyers and renters use GreatSchools information and ratings as a first step, and conduct their own investigation to determine their desired schools or school districts, including by contacting and visiting the schools themselves.Redfin does not endorse or guarantee this information. School service boundaries are intended to be used as a reference only; they may change and are not guaranteed to be accurate. To verify school enrollment eligibility, contact the school district directly.
Homes for sale in Seven Corners have a median listing price of $255K. Some of these homes are Hot Homes, meaning they're likely to sell quickly.
What are some of the most popular neighborhoods in Seven Corners?
Popular neighborhoods include Dominion Hills, Bon Air, Lee Boulevard Heights, North Arlington, Brockwood, Bluemont, Boulevard Manor, Buffalo Hills, Baileys, and Culmore.
Transportation in Seven Corners, Virginia is primarily car-centric, with many residents relying on their cars for commuting and daily activities. The area experiences moderate to high levels of traffic, particularly during peak commuting hours. Public transportation is available in Seven Corners, with options including buses and metro services. Additionally, the region is conveniently located near major highways, providing easy access to surrounding areas.
What types of properties are available in Seven Corners?
Seven Corners, Virginia offers a variety of single-family home types, including ranch-style homes, split-level homes, and colonial-style homes. These homes can be found throughout the Seven Corners area, providing options for buyers looking for different architectural styles. Most properties in Seven Corners, Virginia feature 3-4 bedrooms and were built in various years. To explore different property types for sale in Seven Corners, Virginia, use the 'Home type' filter located above the active listings. Customize your search by selecting options like single-family homes, condos, townhomes, and more.
What is life like in Seven Corners?
Living in Seven Corners, Virginia offers a unique blend of urban and suburban living with a variety of housing options. The landscape is characterized by a mix of commercial areas and residential neighborhoods, providing convenient access to amenities. The weather in Seven Corners is characterized by distinct seasons, with hot summers and cool winters. Job opportunities are abundant, with a diverse range of industries present in the area. Residents can enjoy a vibrant local scene with numerous dining, shopping, and entertainment options to explore.
What are the schools and amenities like in Seven Corners?
Seven Corners, Virginia boasts a variety of public amenities for its residents. Dining options are plentiful with a diverse array of restaurants available. Outdoor enthusiasts will appreciate the well-maintained parks that offer a breath of fresh air. For your daily needs, several grocery stores are conveniently located within the region. Additionally, more amenities such as fitness centers, libraries, and shopping centers are also present in Seven Corners, Virginia.
In the past month, 5 homes have been sold in Seven Corners. In addition to houses in Seven Corners, there were also 15 condos, 4 townhouses, and 0 multi-family units for sale in Seven Corners last month. Find your dream home in Seven Corners using the tools above. Use filters to narrow your search by price, square feet, beds, and baths to find homes that fit your criteria. Our top-rated real estate agents in Seven Corners are local experts and are ready to answer your questions about properties, neighborhoods, schools, and the newest listings for sale in Seven Corners. Our Seven Corners real estate stats and trends will give you more information about home buying and selling trends in Seven Corners. If you're looking to sell your home in the Seven Corners area, our listing agents can help you get the best price. Redfin is redefining real estate and the home buying process in Seven Corners with industry-leading technology, full-service agents, and lower fees that provide a better value for Redfin buyers and sellers.


 REDFIN IS COMMITTED TO AND ABIDES BY THE FAIR HOUSING ACT AND EQUAL OPPORTUNITY ACT. READ REDFIN'S FAIR HOUSING POLICY AND THE NEW YORK STATE FAIR HOUSING NOTICE.
 United States
 Canada