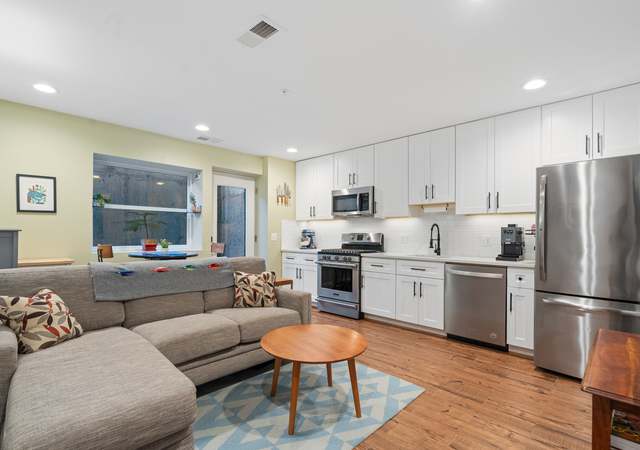
Welcome to this modern 1 bedroom, 1 bathroom with a Private Patio and Community Rooftop in the heart of Petworth. This beautifully appointed condo features an open floor plan that is great for entertaining. Upon entry, you are greeted by beautiful wood-like porcelain tile floors, high ceilings, and recessed lighting. The large picture window and patio door provide natural light. Come home to your chef’s kitchen which features plenty of cabinetry, quartz countertops, stainless steel appliances, gas cooking, and tiled backsplash. Garden, sip your morning coffee, or have dinners al fresco on your private patio. In-unit washer and dryer make everyday living a breeze. The Montage South is
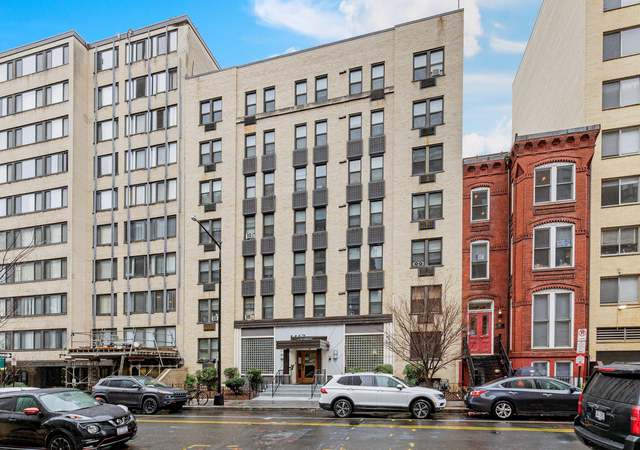
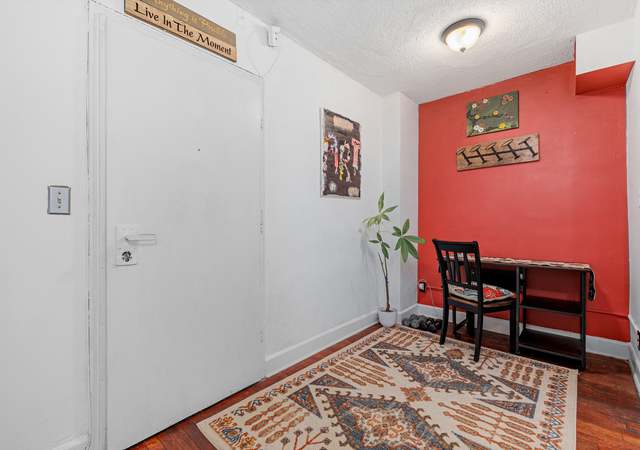
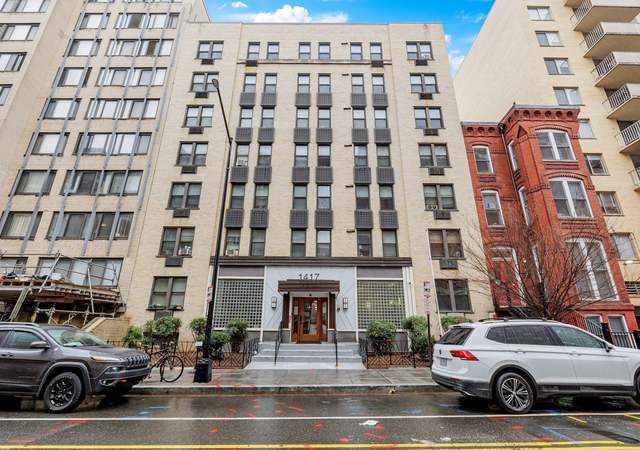
Sellers want immediate sale! Price drastically reduced to $99,000. Where else can you find a co-op unit in the bustling Logan Circle district for under $100k! Great opportunity in the prime location. This well located co-op studio unit has much to offer like central A/C and heat, replacement windows, hardwood floors and walk-in closet. The monthly co-op fee includes property taxes, water and gas. The greatest advantage to this property is the proximity to all the attractions that Logan has to offer. You're just steps to abundant dining venues and shopping along 14th St. There is amble street parking. Be a homeowner in this prime DC location at a most affordable price.
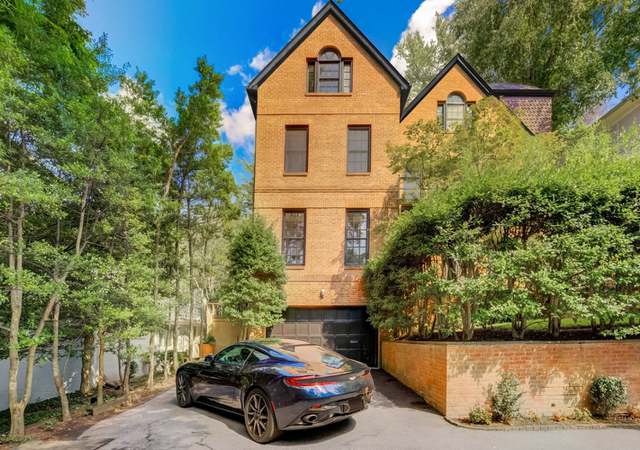
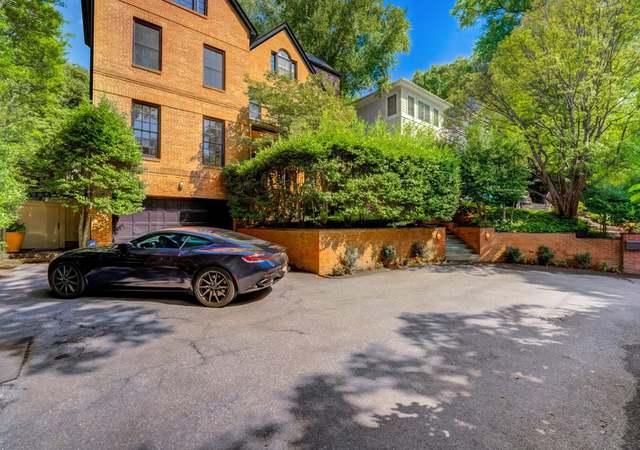
Welcome to this exquisite Colonial residence nestled in the coveted neighborhood of Kent, offering an unparalleled blend of urban sophistication and suburban tranquility. This stately all-brick home spans over 6800 square feet, exuding warmth and comfort throughout its well-appointed spaces. As you enter, you are greeted by a gracious foyer that sets the stage for the inviting interiors within. The heart of the home is the designer chef's kitchen, meticulously appointed with top-of-the-line Viking appliances, custom-crafted maple cabinetry, and a convenient dumb-waiter, elevating every culinary experience to new heights. The expansive island provides ample space for meal preparation and cas
INVESTOR OPPORTUNITY! Take this nearly-complete condo all the way to the bank! Think of it like a home kit, the parts are here, you just need to put it together. With an ARV of approximately $375k, this is a golden opportunity to make a quick return on this 1 bed/1 bath in a lovely residential neighborhood. Many finishes (including the kitchen cabinets/counters) already purchased, you do the install; flooring is done; needs bathroom fixtures; add drywall and paint and you have a finished product! Cash or hard money, quick close. Don't miss this chance for the quickest flip and ROI possible!
Welcome to Bishop's Gate, a condominium ideally located in one of DC's most sought-after neighborhoods with private outdoor area! This private and versatile 1-bedroom with a Den/2nd bedroom/office/nursery and 1 bath, created from an old church Abbey, boasts a wealth of unique architectural features. Enjoy the luxury of a private entrance, an open floor plan, inviting hardwood floors, and abundant natural light that infuses the space with warmth and charm. Step into the gourmet kitchen, adorned with brand new Granite countertops, stainless steel appliances, a convenient walk-in pantry, and custom cabinets, offering a seamless blend of style and practicality. The spacious owner's bedroom is c
Low Condo Fees, $185 per month, Do not miss out! Exquisite and impeccably maintained, this contemporary condo exudes a sense of luxury with its stunning high-end features. Boasting 2 bedrooms, 2 marble baths (complete with a lavish shower stall in the primary bathroom), and a generous 950 square feet of living space with high ceilings. The oversized gourmet kitchen is a nice touch offering both style and functionality. The custom closet organizers and murphy bed do convey. Situated in a boutique building, thoughtfully constructed in 2019 by ERB, this pet-friendly home stands out and has remarkably low condo fees—only $185 per month. Its strategic location places it in proximity to the
Welcome to your retreat in the heart of the coveted Hill Crest neighborhood, where timeless elegance meets modern convenience. This distinguished Colonial residence invites you to experience the epitome of luxury living, boasting a perfect fusion of character and contemporary style. As you approach the front porch, you'll feel the welcoming embrace of a space where you can unwind, and savor your favorite coffee. When you step through the door, you're greeted by the inviting warmth of hardwood floors and the flickering glow of a wood-burning fireplace, setting the stage for cozy gatherings and cherished moments. The gourmet kitchen, a culinary masterpiece, beckons with its top-of-the-line fe
A Rare-to-Find spacious 1,100 sqft one bedroom in the historic Northumberland Cooperative, located at the midpoint of U Street, Dupont Circle, and Adams Morgan. Oversized windows throughout illuminate high ceilings and period details, such as deep moldings and oak parquet floors with walnut inlay. Recent updates in 2023 include a new gas cooktop, gas oven, portable washer, and window AC unit. Each room is generously sized for gracious living and entertaining. An enormous bathroom and several walk-in closets provide ample storage. This is one of the few units with a washer and dryer, making everyday living a breeze. The new owner has the ability to upgrade to zoned HVAC. This friendly, metic
$425,000
1 bed1 bath1,100 sq ft
2039 New Hampshire Ave NW #303, Washington, DC 20009
Beautiful Top to Bottom 3 level High-end Renovation in Capitol Hill featuring 4 Bedrooms + Den, 2.5 Bathrooms, Outdoor Deck, and Off Street Parking that is pre-wired for an EV charger! Iron security gate in fabrication and to be installed before Settlement. Upon entering, you are greeted by the warm ambiance of the interior, featuring beautiful hardwood floors, tall ceilings, and an exposed brick wall that creates an inviting atmosphere. The main level has a spacious transitional floor plan designed for both entertaining and easy living. The living and dining areas effortlessly transition into a Chef worthy kitchen boasting name dropping Bertazzoni Premium kitchen appliances including an i
Welcome to your fully renovated oasis! From top to bottom, this home is a masterpiece of modern living. Step onto gleaming Luxury Vinyl floors that flow seamlessly throughout, setting the stage for elegance. The heart of the home, a fully renovated kitchen, is a chef's dream, featuring stainless steel appliances, enhanced cabinetry, and quartz countertops and an island. The upper level has three bedrooms and a full bath, a retreat bathed in comfort. Venture downstairs to the finished basement, a versatile space boasting space for a potential bedroom, a full bathroom, laundry room, and a cozy living area with walkout stairs in the back and walkout access from the front of the home - perfect
This spacious Fort Lincoln property offers the perfect blend of modern comfort and timeless appeal, making it an ideal home for anyone seeking a sanctuary in the city. It offers over 2000sf of interior living space and a spacious backyard perfect for entertaining, as it is one of the largest floorplans in its subdivision. The home has an updated, modern, and functional kitchen with space to place eat-in dining furniture. It features two fireplaces and a floorplan with classic design and contemporary finishes that is perfect for gatherings and hosting guests. The primary bedroom provides generous closet space and an en-suite bathroom. In addition to the two full bathrooms on the second floor
Located in the great and vibrant Columbia Heights, this beautiful 2 bedrooms 2 bathrooms condo with its high ceilings with recessed lighting, granite counter, stainless appliances, spacious bedrooms and walk-in closets; offers you a spectacular view from its rooftop accessible from the elevator of Washington DC. The unit has its own washer and dryer. Transportation is not an issue, the bus line is right by the property, the access to 2 metro stations (Georgia Ave & Columbia Heights) subway is within walking distance. Restaurants, coffee shops shopping are all within reach. The building is equipped with a lock security system. The property is sold As-is and the seller pays for 1 full y
Step into a symphony of light and space within this meticulously crafted residence, reborn in 2016 to emanate enduring allure. Enveloped in the warmth of exposed brick, the living room stands as the heart of the home, while a separate dining area offers an intimate space for gatherings. The gourmet kitchen, adorned with marble countertops, wood cabinetry, and stainless steel appliances, promises culinary delights. Also on the main floor, discover a versatile space suitable for a bedroom, home office, or exercise room. Enhanced by an ensuite bath featuring a rejuvenating whirlpool tub and a secluded private deck, it offers moments of respite amidst the urban landscape. Venture to the second
Charming and beautifully updated Burleith Colonial Townhome with 4BR/3.5BA and gorgeous just finished in-law suite on lower level with separate entrance from the back. As you are entering the front door you are greeted by a bright, open and spacious living room that leads to the dining area adjoining the very large and open Chef's Kitchen with kitchen island, breakfast bar and ample cabinet and prep space. The front of the home has a beautiful, deep, fully landscaped yard with terraced flower beds. The back door on the main floor leads to a stunning entertaining patio/garden right off the kitchen, with a dining as well as lounging area overlooking the beautifully landscaped backyard with a
Welcome to 1827 Tobias Drive! Come make this charming DC haven your own! This beauty features a recently remodeled 2 bedrooms and 2 full baths with new flooring and newly installed carpets. The main level offers hardwood flooring in the living room which leads to an open kitchen. Upstairs you’ll find 2 spacious bedrooms with new carpets and a full bathroom featuring double sinks. The basement is fully finished with ample storage space, and a full bath, and can be used as a bonus guest room and/or recreational space. Exit the lower level and head into the backyard with your vehicle parked in your driveway and enough space to host a summer barbeque. Your new home is conveniently located
Amazingly large 2 bedroom, 2.5 bath one level condo in The Flour Mill Condominium overlooking the historic C & O Canal in Georgetown, Washington, DC. You enter the condo into a pleasing foyer with coat closet, powder room and a side entry directly to the kitchen for your groceries and supplies. From the foyer move into the dining room and living room with a wonderful view of the historic C & O Canal and the first of two balconies. The dining room has a spacious table, buffet and side table and wall space for your art. The formal living room has sufficient space to include a desk, the glass display shelves for your treasures and directional lighting to showcase your art. Then mo
FOR SALE is a East and West-facing, Two-bedroom, 2.5 Bathroom condominium on the 2md and 3rd floor with a patio that opens up onto the interior landscaped courtyard. This home boasts an array of desirable features, such as a granite countertop, Hardwood Flooring, elegant crown molding, ample closet spaces, an extra-wide garden bathtub, and the convenience of an in-unit washer/dryer, making everyday living a breeze. The building's amenities are second to none, offering a rooftop pool with breathtaking views of the Washington Monument, Capitol, and July 4th fireworks. There is also a rooftop garden, BBQ grills, and seating areas for dining and relaxation. Tenants can stay fit in one of two fu
Enjoy a life of luxury in a prime Kalorama setting. The "modern" version of this handsome residence evolved from a total "walls-in" renovation undertaken in 2012 (think White House, 1948-50). With its flowing layout, the house can easily accommodate gatherings of 250+. Yet the house also offers many "chill out" spots to relax and recompose at leisure, including the secluded west patio, the bath suite on the second level, and the light-filled home office on the third level. This is an urban property with a peaceful feel. Dimensions are generous; rooms are big, ceilings high, windows tall and numerous, corridors wide. Kalorama has been one of Washington, DC's mos
Don’t miss this rare Detached home with a lovely renovation in 2021. A hard to find three bedrooms on the top level with a new full bath. 1,054 sf. on two levels. Spacious Wrap around lot and a deck in the rear yard. Nice black wrought iron fence around the whole yard. Nice quiet one-way street with open space to the right. Stunning Stainless Kitchen with all new cabinets and granite. All new luxury plank flooring on both levels. Larger Living room than most and a nice dining area. Powder room and Laundry on the main level. Great location not on any busy roads and close to many Metro stations including Deanwood. You are not far from the Deanwood Aquatic Center for indoor swimming. Dea
COMING SOON!! Step into luxury and sophistication with this exquisitely renovated 3 bedroom, 3 full bath, 1584 square foot residence, nestled in the heart of Brentwood. Boasting off-street parking for added convenience, this home seamlessly blends appointed original details with contemporary flair, offering a harmonious fusion of old-world charm and modern luxury. The heart of this home lies in its gourmet kitchen, where culinary dreams come to life amidst sleek countertops, top-of-the-line chef's series appliances, and a custom created breakfast nook/built in seating. Entertain guests effortlessly in the spacious living areas, where abundant natural light dances upon the rich hardwood flo
Modern Condo with Deck and 2-Car Parking in the Heart of Dupont. This Victorian row home, circa 1900, was converted to a two-unit boutique building and is perfectly situated one block from Dupont Circle. With over 1,880 square feet, the home features a two-level open floor plan with 12-foot, soaring ceilings and handsome hardwoods throughout. On the main level, the living room with fireplace, dining room and outside deck are ideal for entertaining. The spacious gourmet kitchen features granite countertops with an island and top-of-the-line stainless appliances, including a wine frig. There's even a dedicated home office space right off the kitchen. Plus, a convenient powder room. The lower
Nice and spacious, however, dated and needs some TLC. 3 bedrooms, 1.5 baths, living-room, dining-room, sunroom, hardwood floors, large back yard, front porch, minutes from downtown DC, and close to metro. Investor's Delight.
Embrace chic city living in this delightful corner studio condo in the General Scott Condominium, located in Scott Circle perfectly nestled between Dupont and Logan Circles. One of the most walkable areas of the city with a 99 walk score, only steps away from the area's finest restaurants, shopping, and nightlife! Offering a unique blend of vintage charm and modern simplicity, an upscale lobby with 24-hour concierge, spectacular rooftop patio, panoramic views, hardwood flooring, high ceilings, soft neutral paint, chic lighting, a walk-in closet, and an updated kitchen and bath create instant appeal. * * * * * * Utilities-AC, heat, electric, water, sewer, internet, and cable are inclu
Fantastic Brentwood Location! NE DC row house, 3 bedroom 2.5 baths. Property being sold AS IS, Lots of room to renovate and flip. Calling all Investors!
* * * Price reduction * * * Welcome to 714 Hamlin St NE #2! This gorgeous 3 bed, 3 bath unit in the heart of Brookland has just been beautifully renovated and is ready to welcome you home. With modern upgrades, an open and inviting layout, outdoor common space, and convenient free parking, this place has it all. Step inside and be greeted by a bright and spacious living area – perfect for both entertaining and unwinding after a long day. The living space with an electric fireplace seamlessly flows into a well-appointed kitchen, featuring sleek white cabinets, , and stainless steel appliances. The main level also offers a cozy bedroom and a full bathroom that opens up to a private
* * New Price * * Welcome to 714 Hamlin Condo Unit #1! This gorgeous 3 bed, 3 bath unit in the heart of Brookland has just been beautifully renovated and is ready to welcome you home. With modern upgrades, an open and inviting layout, ample storage, multiple outdoor spaces, and an assigned parking space wired for EV Charging! The living space seamlessly flows into a well-appointed kitchen, featuring sleek white cabinets, Quartz countertops, and stainless steel appliances. The Living room has an electric fireplace that provide both ambiance and heat perfect for relaxation after a long day or Sunday morning coffee. This unit is very close to Brookland’s best dining, entertainment, sh
Welcome Home! Beautiful detached home located in the highly desired Brookland community. This amazing home features four levels of great natural light, gracious storage, and unmatched architectural details. Upon arrival, you are met by top-notch stone pavers from the exterior stairs to the walkway that leads to the expansive rear yard and large deck, these grounds are perfect for garden enthusiasts! Besides its curb appeal, this fully remodeled home has a front porch perfect for lounging. Upon entering the home, you are greeted by gorgeous wood flooring throughout, a light-filled living room and separate dining area, updated kitchen with SS appliances, gas-cooking with modern hood exhaust,
Welcome to your new home in the heart of the coveted Petworth neighborhood steps away from Sherman Circle! This stunning colonial townhouse boasts a 3 bedrooms and 3.5 baths, open floor plan perfect for both entertaining guests and everyday living. High ceilings accentuate the sense of space and airiness, and hardwood wood floors throughout. The gourmet kitchen features granite countertops, a stylish granite backsplash, stainless steel appliances, gas range, and ample cabinetry for storage. Upstairs, the owner's suite is a serene retreat, offering a spacious layout and a cozy sit-in area and includes one of the largest walk-in closests you have ever seen! The ensuite bathroom boasts luxury
Welcome to your dream home. This stunning completely renovated 5-bed, 3.5-bath home is flooded with natural light and boasting an inviting open floor plan. Ideal for entertaining, this gem features wide oak wood floors, a built-in Bluetooth audio system, and recessed lighting throughout. The kitchen is a chef's delight with premium quartz stone countertops, enhanced double floor to ceiling cabinets, upgraded stainless steel appliances including 36” six burner gas stove, chimney hood, pot filler, double oven with convection microwave, and a spacious island with a waterfall edge. Luxurious marble baths with designer finishes. The primary bedroom is a retreat with walk-in closets and a c
Welcome to 1635 Hobart St NW, a property brimming with potential for those with a keen eye for transformation. This expansive home features a recently added 4th floor, complete with new windows, a full bath, and two generously lit bedrooms alongside a versatile sitting area—perfect for a lounge or home office space. Venture one floor down to discover two bedrooms, a den, and a second kitchen adjacent to a spacious dining/family room. While the seller began renovations on this level, the opportunity remains for the new owner to complete this space to their exact preferences. Original floors can be refinished or replaced, and the home's classic doors add a touch of timeless charm. The m
BRAND NEW Two Bedroom/Two Bathroom Model just released at North Old Town’s most luxurious and exclusive luxury condominium building, MUSE. Condo 208, is an open concept floor plan and designed to utilize every inch with purpose. This home offers 9’ ceilings, an expansive private balcony with a view of the Potomac River, and an abundance of natural light with walls of floor-to-ceiling windows. There is more than enough storage in the kitchen with a generous amount of kitchen cabinets, two pantries and an expansive island. Two walk-in closets in the Owner's room, one in the 2nd bedroom, and a spacious laundry room ensures plenty of closets and storage throughout the condo. Built
Home features expanded upper levels that enlarged the Kitchen and added a full rear porch with full Washer & Dryer hookup. Additional W/ D hook up in the basement. Partially updated Kitchen and Full Baths. Wood floors on both upper levels and two LARGE Bedrooms. Great Location only one block west of Georgia Avenue and two block East of Sheridan Circle. * * * * Walking distance to numerous Gourmet Restaurants. “All offers must be submitted by the buyer’s agent using the online offer management system. Access the system via the link below. A technology fee will apply to the buyer’s broker upon consummation of a sale. ” Offer link to property: VIA AGENT ONLY
A rare opportunity awaits with this magnificent 7-bedroom, 7 full bath, 2 half bath residence featuring an elevator, 2-car heated garage, au pair suite and outdoor oasis on a sprawling corner lot in Woodley Park. Spanning nearly 8000 square feet across 4 levels, this residence was built by the acclaimed Zuckerman Builders and embodies the epitome of luxury living. As you approach, lush landscaped grounds and inviting stairs lead up to a spacious front porch with a charming swing, setting the tone for the grandeur within. Upon entering, sunlight floods the formal living room, adorned with a wood-burning fireplace, while the adjacent formal dining room echoes elegance with its own fireplace a
Welcome to Third Street Flats in Eckington! This exquisite 2-bedroom, 2-bathroom condo boasts over 1,000 sq feet of luxurious living space. THE BEST floor plan in the building this home offers rare floor to ceiling glass windows in the entire back of the home. WANT PARKING! Your parking space is just behind the building! Upgrades!! New custom blinds, custom class doors on showers and closet organization! There is more! This home a massive balcony and an abundance of storage! There is not another condo on the market this large with parking and balcony on the market for the price!
The entire home has undergone a top-to-bottom renovation, ensuring a modern and updated living space. The layout and features of the home make it well-suited for hosting gatherings and events. Hardwood flooring adds a touch of elegance and is easy to maintain. Inviting front porch, huge living room. The kitchen is a focal point, featuring shaker cabinets, quartz countertops, and an Italian backsplash. . A deck off the kitchen offers a space for outdoor grilling and relaxation. Primary bedroom is spacious, and it includes an en suite primary bath for added convenience and luxury. The finished recreation room has high ceilings, providing a great space for entertainment. Full bath and an addi
Exceptional 3 bedrooms, 2 baths end unit with Southern sunlight exposure, tree top views, private balcony and 2 separately deeded garage parking in a fabulous location-Wesely Heights. Grand entrance hall. Sun-drenched and generously sized living room with wide windows and dining room with a sliding door to private balcony with fabulous views – it’s great for entertaining or the perfect space to relax, read a book, or simply soak in the fresh air while taking in the scenic beauty. Updated eat-in kitchen with stainless steel appliances, granite countertops and excellent storage cabinets. High ceilings, multiple closets and hardwood floors throughout. Building amenities include: 24
$775,000
3 beds2 baths1,860 sq ft
4201 Cathedral Ave NW Unit 1215W, Washington, DC 20016
Here is an opportunity to be located right off Lincoln Park. A brief walk and you are at Eastern Market, coffee shops and local dining. Maury Elementary is less than two blocks. There are two metro stops from location.
#111 in The Historic Row at 1745N is a generously generously sized 2-bedroom, 2.5-bathroom residence boasting generous amount of living area. The star of this unit is the private entrance, which provides single family home-like living with the convenience and minimal maintenance needs of a condo. The unit features an abundance of closet space, an additional powder room for visitors, and a tucked away entryway to hide your shoes, umbrellas and coats from the living area - a rarity in DC living. The gourmet kitchen is a culinary haven, with custom cabinetry, featuring Bosch stainless steel appliances. Premium wide-plank flooring adds an extra layer of elegance for a seamless blend of style an
This area's enrollment policy is not based solely on geography. Please check the school district website for more information.
Elementary schools
Middle schools
High schools
GreatSchools Summary Rating
10/10
Lafayette Elementary School
Public, PreK-5
10/10
Janney Elementary School
Public, PreK-5
10/10
Key Elementary School
Public, PreK-5
9/10
Mann Elementary School
Public, PreK-5
9/10
Hyde-Addison Elementary School
Public, PreK-5
Only showing 5 of
100+ elementary schools.
School data is provided by GreatSchools, a nonprofit organization. Redfin recommends buyers and renters use GreatSchools information and ratings as a first step, and conduct their own investigation to determine their desired schools or school districts, including by contacting and visiting the schools themselves.Redfin does not endorse or guarantee this information. School service boundaries are intended to be used as a reference only; they may change and are not guaranteed to be accurate. To verify school enrollment eligibility, contact the school district directly.
Homes for sale in Washington, DC have a median listing price of $625K. Some of these homes are Hot Homes, meaning they're likely to sell quickly.
What are some of the most popular neighborhoods in Washington, DC?
Popular neighborhoods include Capitol Hill, Del Ray, Logan Circle, Georgetown, Old Town, Northwest Washington, Brookland, Dupont Circle, Cleveland Park, and Chevy Chase-DC.
Transportation in Washington, DC, District of Columbia is diverse, with a mix of driving, biking, and walking options. The city is known for its high traffic levels, making driving a car during peak hours a challenge. Public transportation is readily available, with the Metro system providing comprehensive coverage across the city and suburbs. In addition, Washington, DC, District of Columbia is well-connected to other regions through several nearby highways and freeways. Learn more on our Washington, DC city guide.
What types of properties are available in Washington, DC?
Washington, DC, District of Columbia offers a variety of single-family home types, including detached homes, row houses, and duplexes. These homes can be found throughout the city, with different neighborhoods showcasing different architectural styles and sizes. Most properties in Washington, DC, District of Columbia offer a range of bedrooms and were built in various years. To explore different property types for sale in Washington, DC, District of Columbia, use the 'Home type' filter located above the active listings. Customize your search by selecting options like single-family homes, condos, townhomes, and more.
What is life like in Washington, DC?
Living in Washington, DC, District of Columbia offers a vibrant urban experience with a mix of historic and modern architecture. The cityscape is a blend of iconic landmarks and bustling neighborhoods. The weather in DC is characterized by hot and humid summers and mild winters, allowing for a variety of outdoor activities throughout the year. Job opportunities are abundant in various sectors, including government, technology, and finance. Residents can enjoy a wide range of cultural events, dining options, and recreational activities, making it an exciting place to explore and engage with the local community.
What are the schools and amenities like in Washington, DC?
Washington, DC, District of Columbia offers a wealth of public amenities to its residents. The city is home to numerous restaurants, offering a wide variety of cuisines to cater to diverse tastes. Parks are abundant throughout the district, providing ample space for relaxation and recreation. Grocery stores are conveniently located across the city, ensuring easy access to daily necessities. Additionally, the city boasts a range of other amenities such as libraries, museums, and fitness centers.
In the past month, 524 homes have been sold in Washington, DC. In addition to houses in Washington, DC, there were also 1445 condos, 1138 townhouses, and 135 multi-family units for sale in Washington, DC last month. Washington, DC is a fairly walkable city in Columbia with a Walk Score of 77. Washington, DC is home to approximately 601,568 people and 634,265 jobs. Find your dream home in Washington, DC using the tools above. Use filters to narrow your search by price, square feet, beds, and baths to find homes that fit your criteria. Our top-rated real estate agents in Washington, DC are local experts and are ready to answer your questions about properties, neighborhoods, schools, and the newest listings for sale in Washington, DC. Our Washington, DC real estate stats and trends will give you more information about home buying and selling trends in Washington, DC. If you're looking to sell your home in the Washington, DC area, our listing agents can help you get the best price. Redfin is redefining real estate and the home buying process in Washington, DC with industry-leading technology, full-service agents, and lower fees that provide a better value for Redfin buyers and sellers.


 REDFIN IS COMMITTED TO AND ABIDES BY THE FAIR HOUSING ACT AND EQUAL OPPORTUNITY ACT. READ REDFIN'S FAIR HOUSING POLICY AND THE NEW YORK STATE FAIR HOUSING NOTICE.
 United States
 Canada