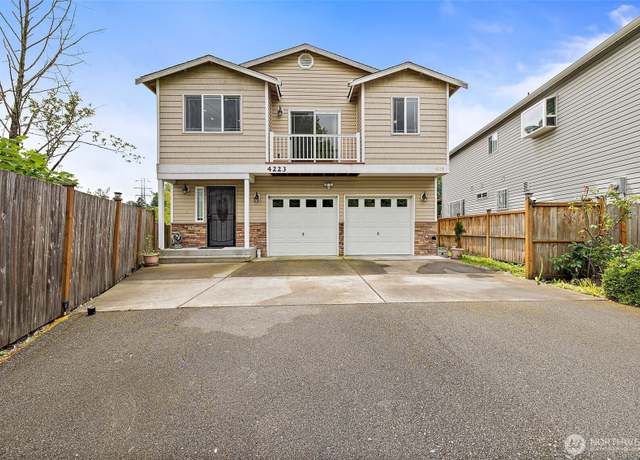
 4223 S Cloverdale St, Seattle, WA 98118
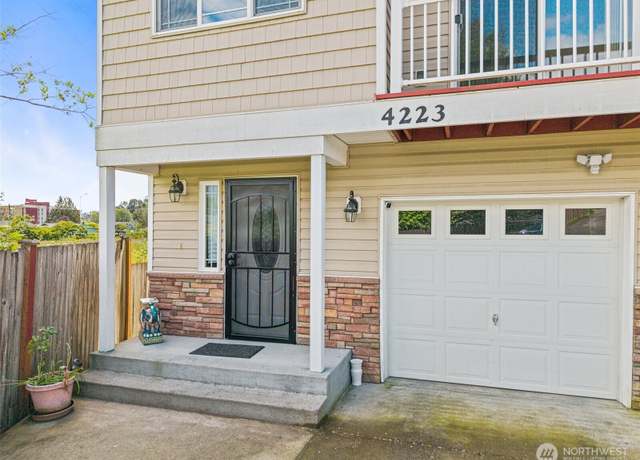 4223 S Cloverdale St, Seattle, WA 98118
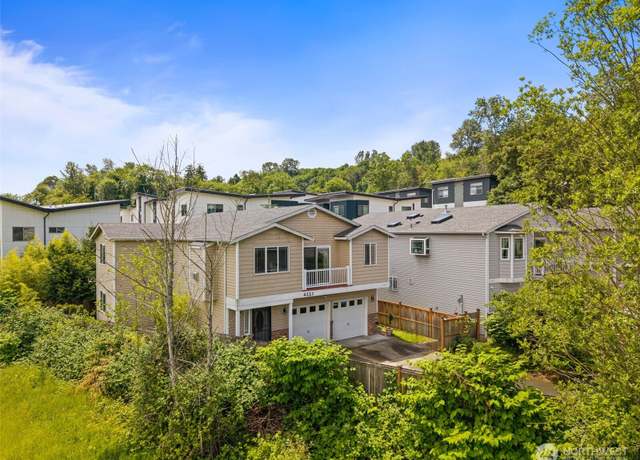 4223 S Cloverdale St, Seattle, WA 98118
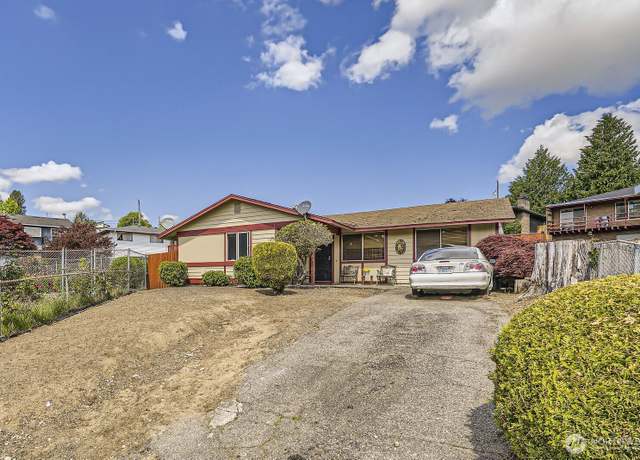 8421 38th Ave S, Seattle, WA 98118
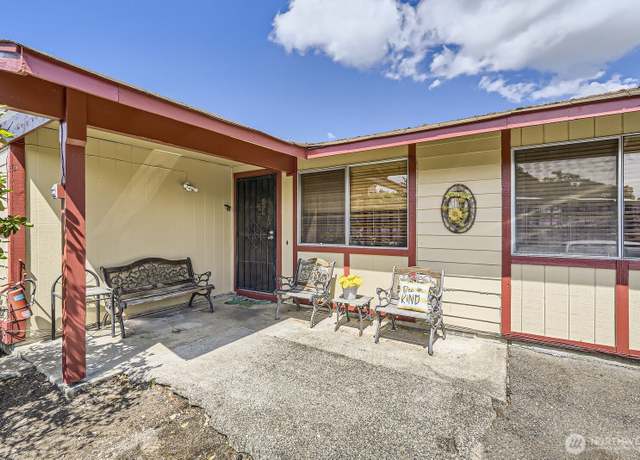 8421 38th Ave S, Seattle, WA 98118
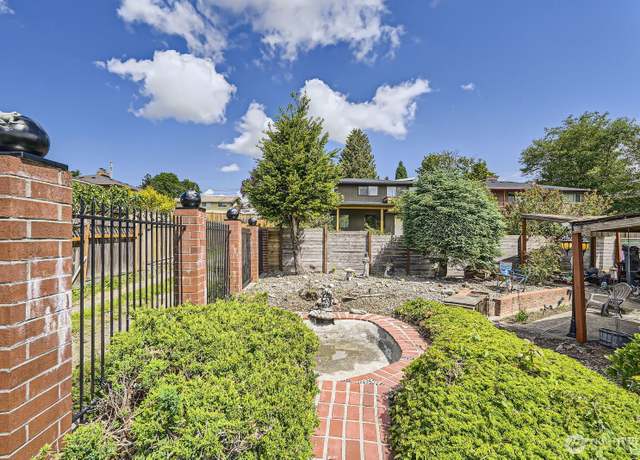 8421 38th Ave S, Seattle, WA 98118
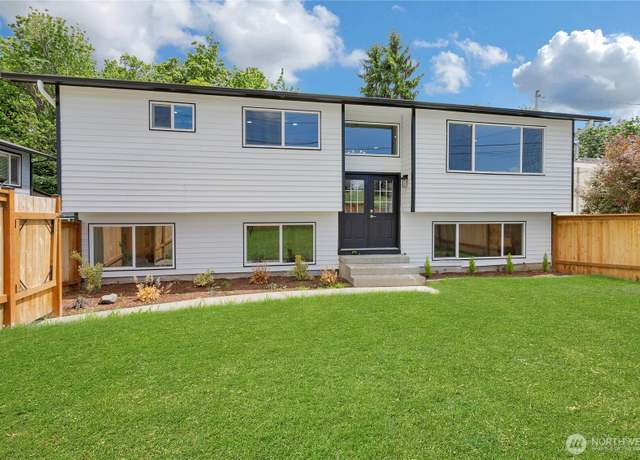 5310 26th Ave S, Seattle, WA 98108
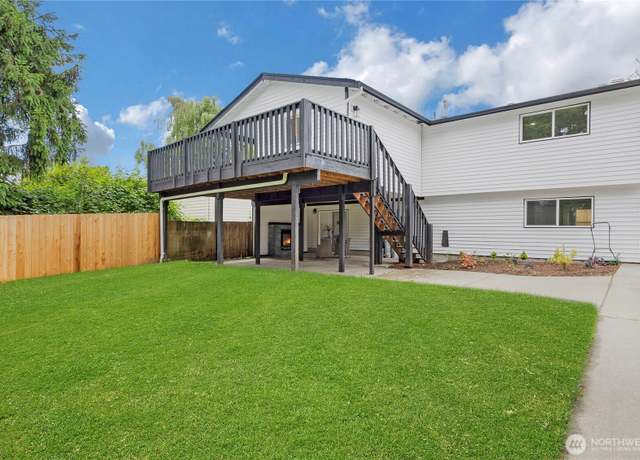 5310 26th Ave S, Seattle, WA 98108
 5310 26th Ave S, Seattle, WA 98108
 5930 18th Ave S, Seattle, WA 98108
 5930 18th Ave S, Seattle, WA 98108
 5930 18th Ave S, Seattle, WA 98108
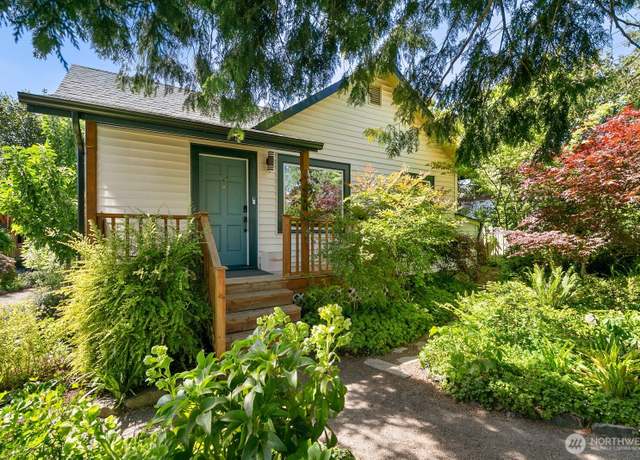 5401 21st Ave S, Seattle, WA 98108
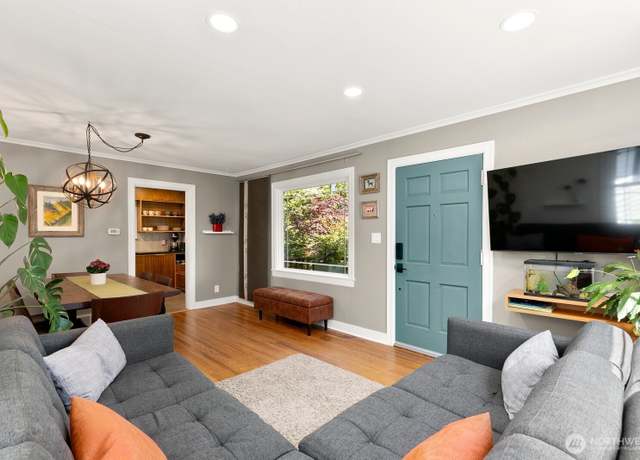 5401 21st Ave S, Seattle, WA 98108
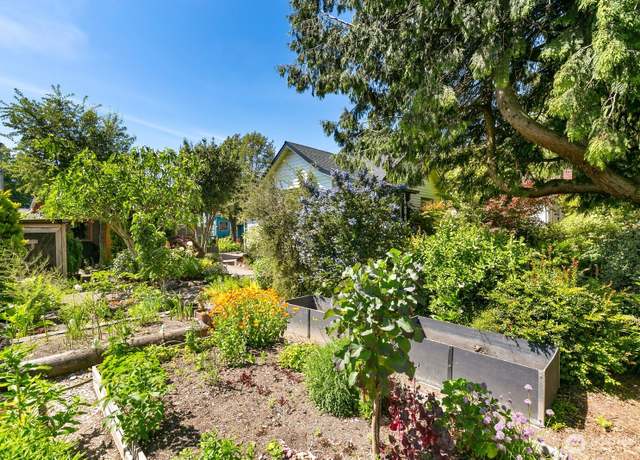 5401 21st Ave S, Seattle, WA 98108
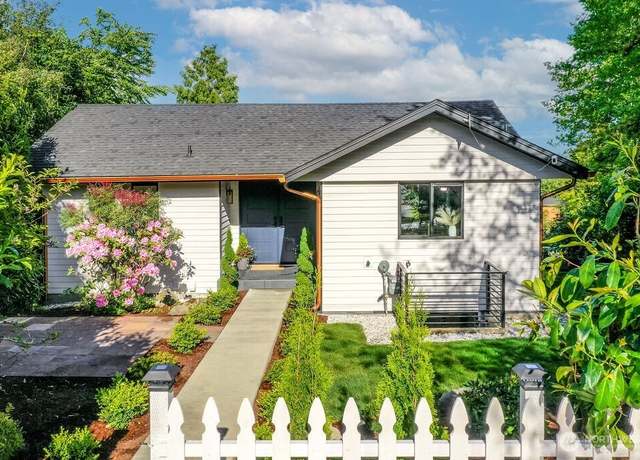 2216 18th Ave S, Seattle, WA 98144
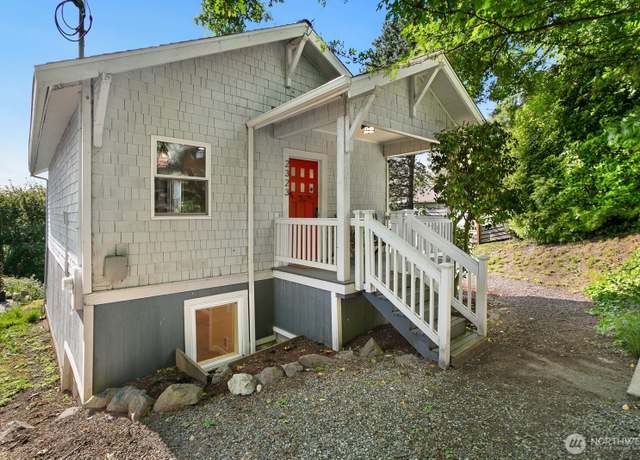 2323 12th Ave S, Seattle, WA 98144
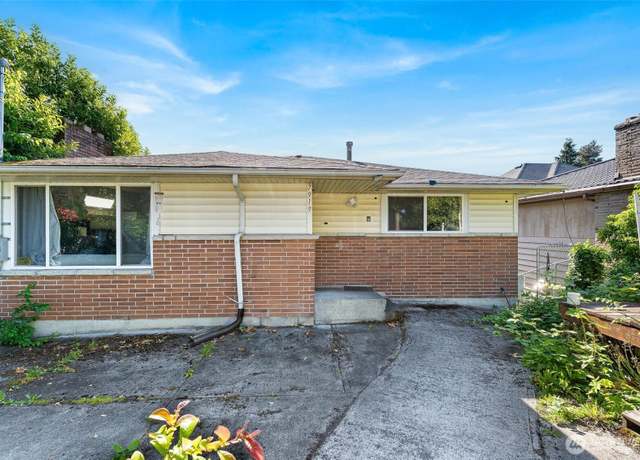 7919 37th Ave S, Seattle, WA 98118
 9419 39th Ave S, Seattle, WA 98118
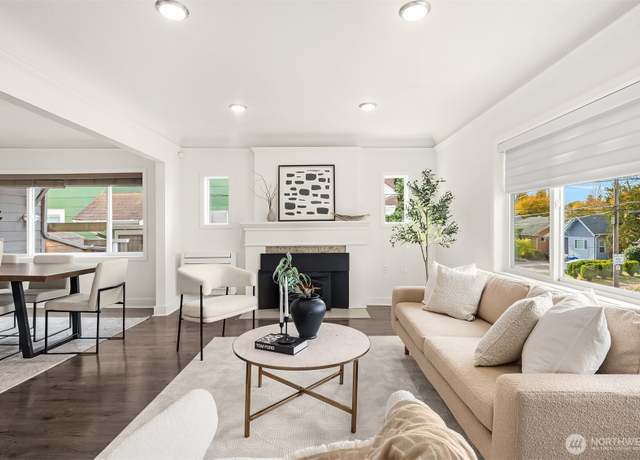 3414 15th Ave S, Seattle, WA 98144
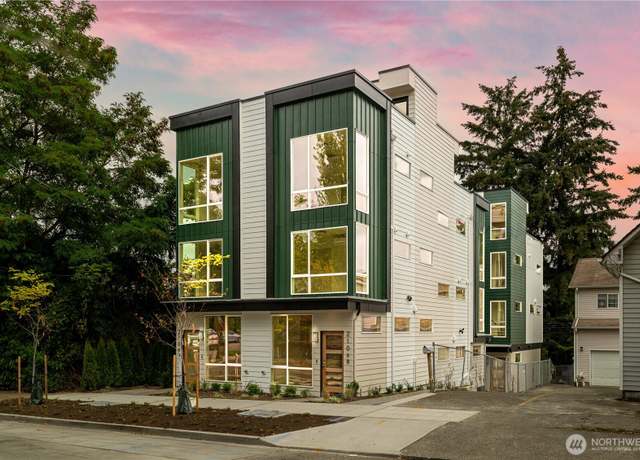 2108 15th Ave S Unit C, Seattle, WA 98144
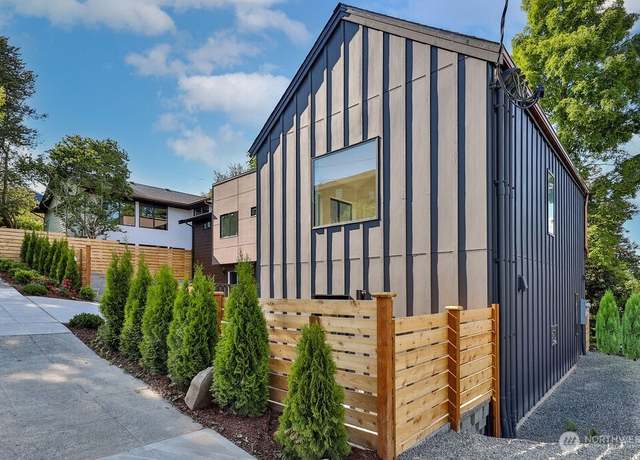 1810 S college St, Seattle, WA 98144
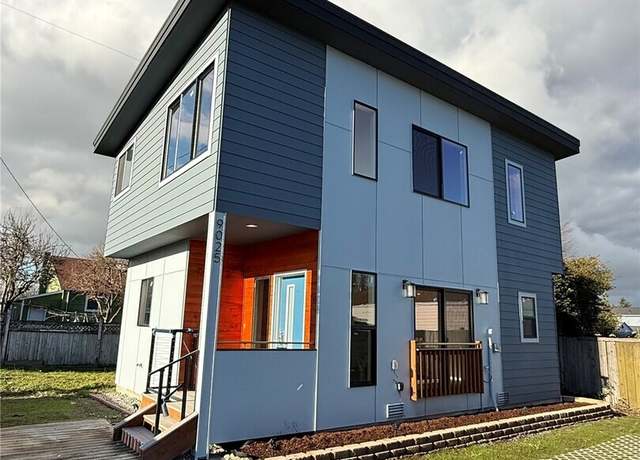 9025 38th Ave S, Seattle, WA 98118
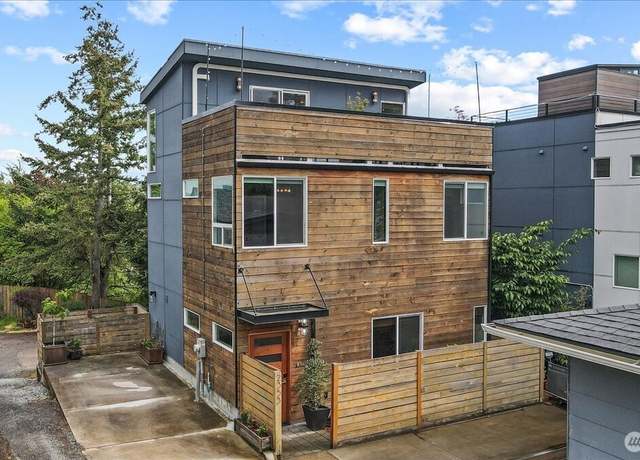 2353 23rd Ave S, Seattle, WA 98144
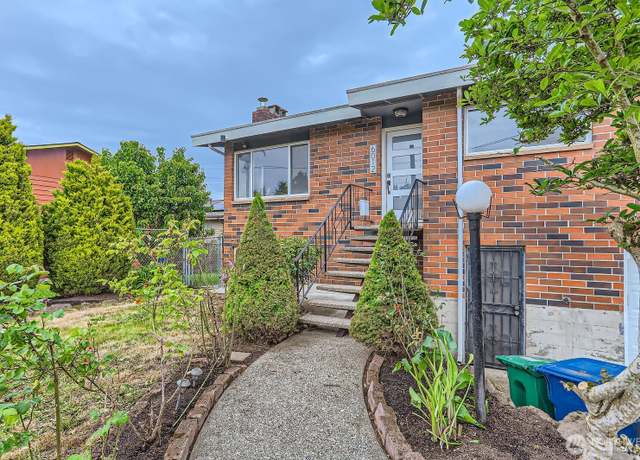 6012 28th Ave S, Seattle, WA 98108
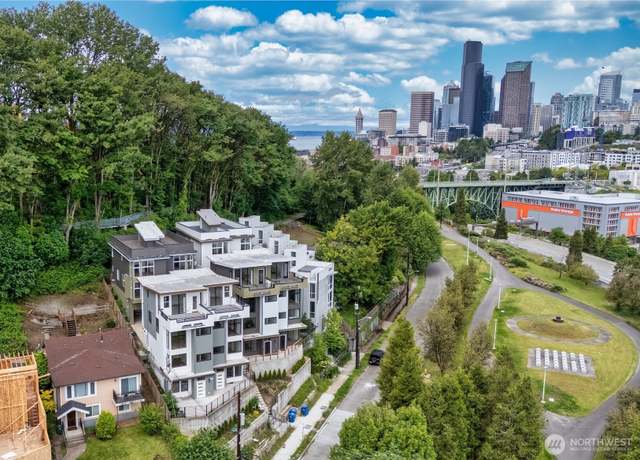 1019 Sturgus Ave S Unit A, Seattle, WA 98144
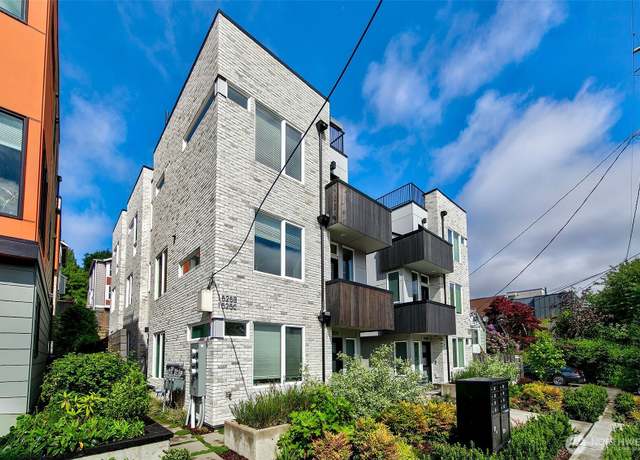 1525 C 17th Ave S, Seattle, WA 98144
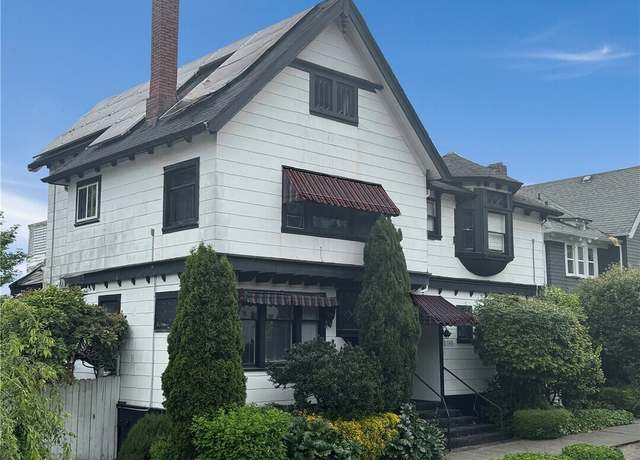 1745 12th Ave S Unit 1 - 4, Seattle, WA 98144
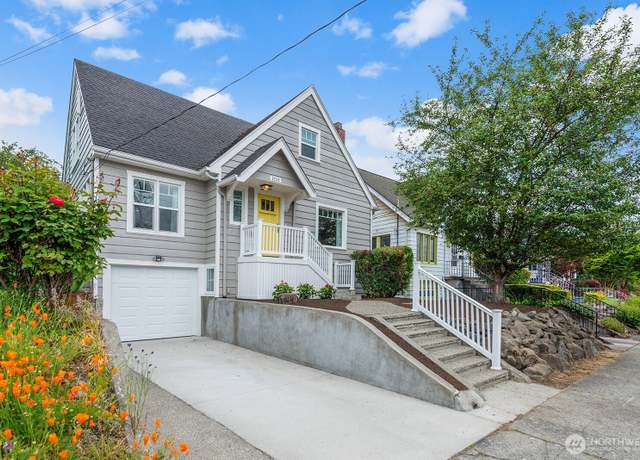 3236 15th Ave S, Seattle, WA 98144
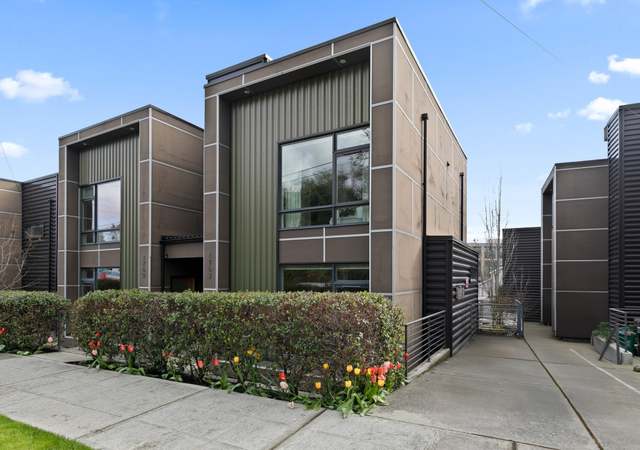 1762 Valentine Pl S, Seattle, WA 98144
 1604 11th Ave S #402, Seattle, WA 98134
 1319 14th Ave S Unit B, Seattle, WA 98144
 1313 14th Ave S Unit A, Seattle, WA 98144
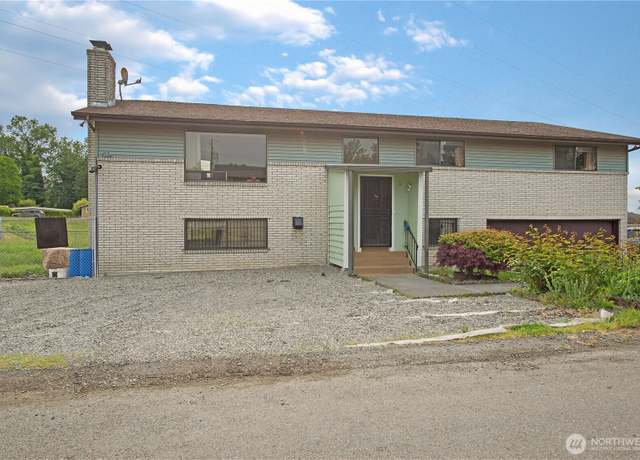 5320 25th Ave S, Seattle, WA 98108
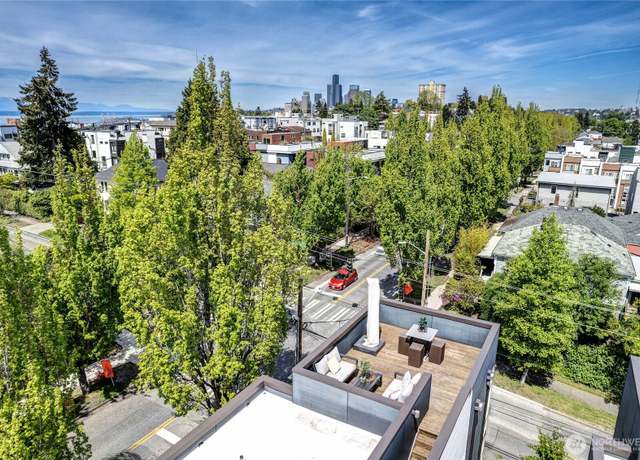 2300 15th Ave S, Seattle, WA 98144
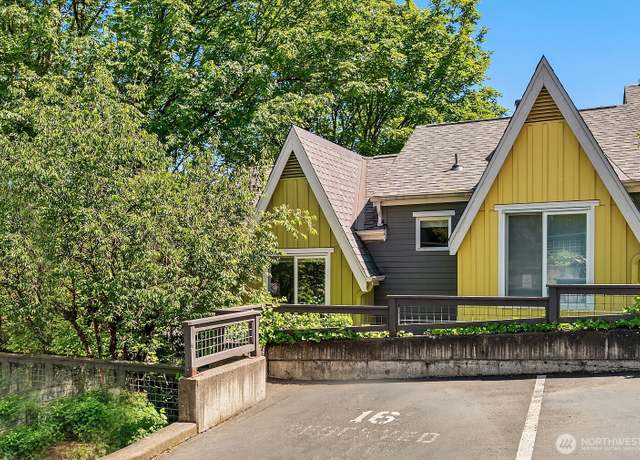 1540 Cherrylane Ave S, Seattle, WA 98144
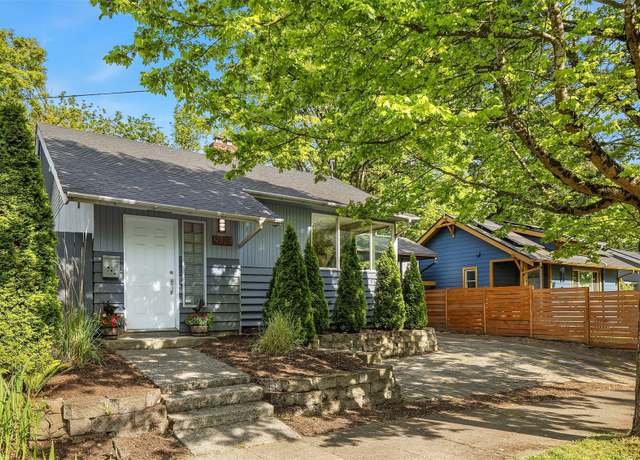 9328 39th Ave S, Seattle, WA 98118
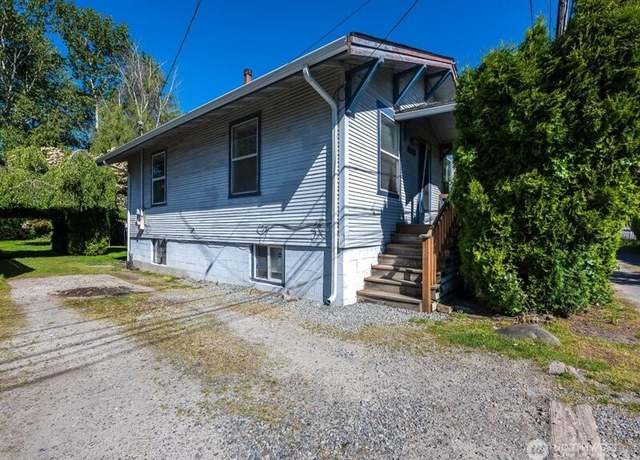 8434 34th Ave S, Seattle, WA 98118
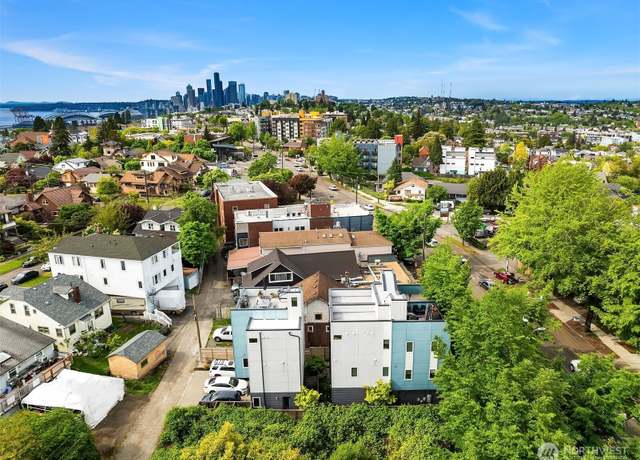 3025 Beacon Ave S, Seattle, WA 98144
 3020 18th Ave S Unit A, Seattle, WA 98144
 8618 37th Ave S, Seattle, WA 98118
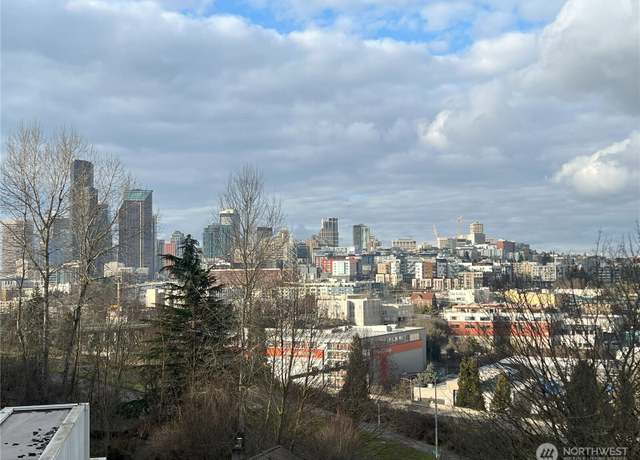 1015 Sturgus Ave S Unit A, Seattle, WA 98144
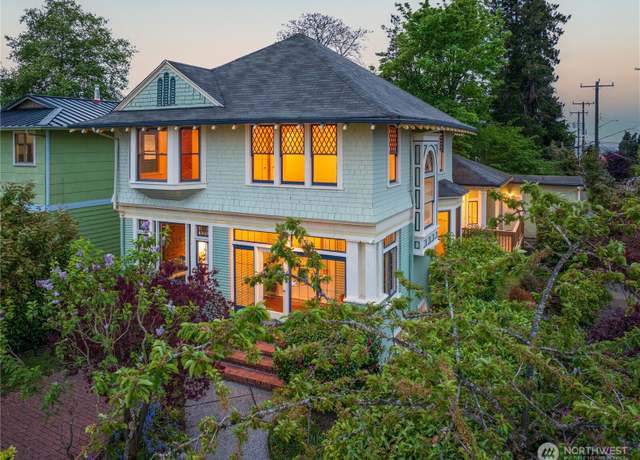 1503 14th Ave S, Seattle, WA 98144
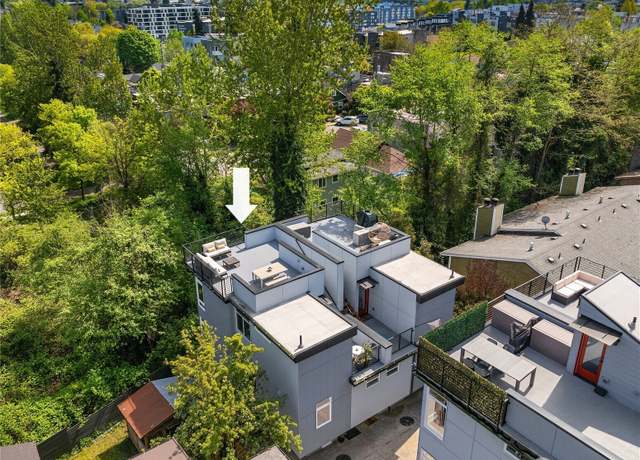 1514 17th Ave S Unit A, Seattle, WA 98144
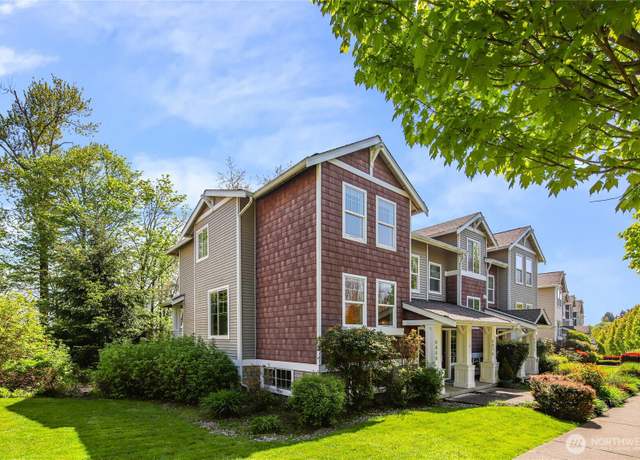 6868 Holly Park Dr S, Seattle, WA 98118
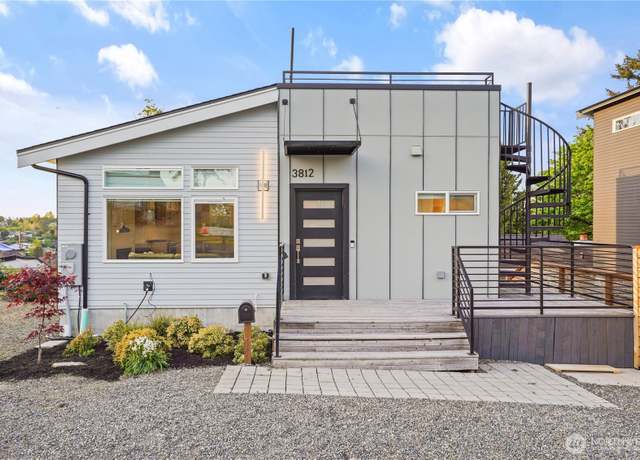 3812 S Trenton St Unit B, Seattle, WA 98118
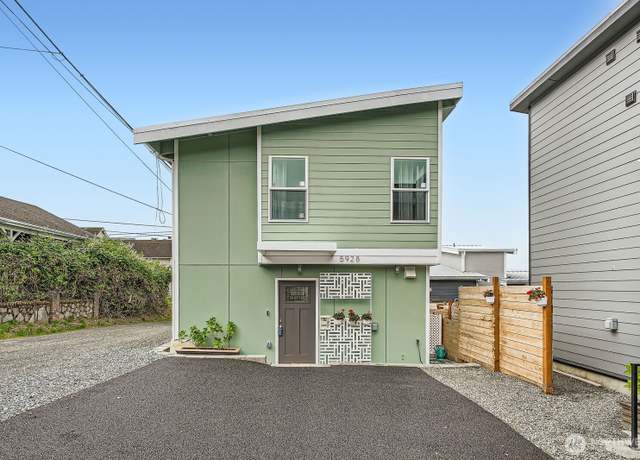 5928 18th Ave S, Seattle, WA 98108
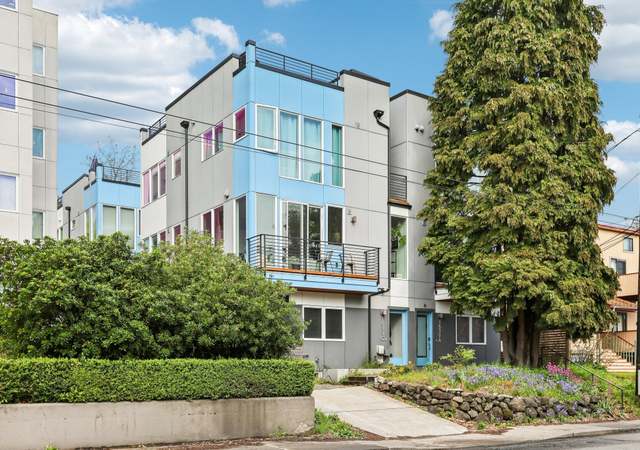 1539 14th Ave S Unit B, Seattle, WA 98144
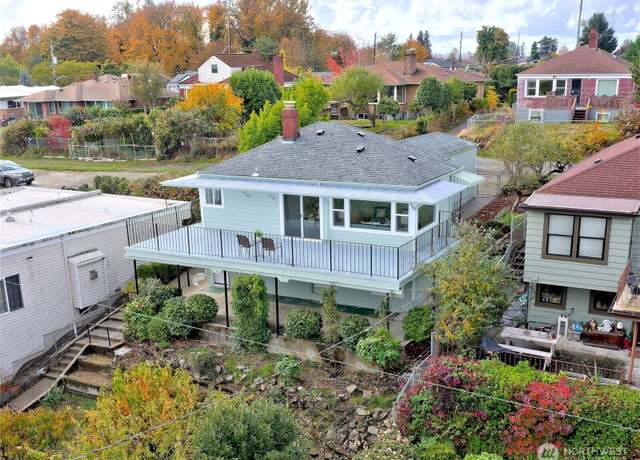 5029 29th Ave S, Seattle, WA 98108
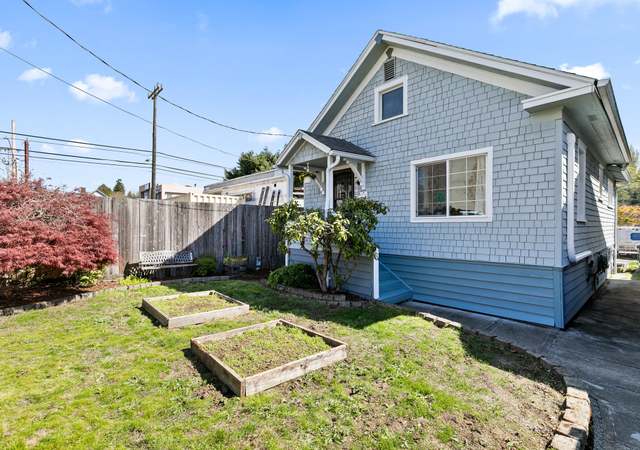 5506 15th Ave S, Seattle, WA 98108
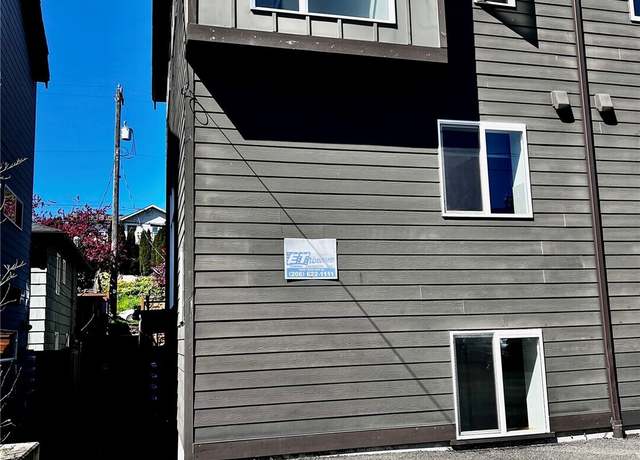 3392 14TH Ave S Unit C, Seattle, WA 98108
- Median Sale Price
- # of Homes Sold
- Median Days on Market
Median Sale Price (All Home Types)
$690,000
+2.3% YoY | Apr 2025
- 1 year
- 3 year
- 5 year

Based on information submitted to the MLS GRID as of Sun Jun 01 2025. All data is obtained from various sources and may not have been verified by broker or MLS GRID. Supplied Open House Information is subject to change without notice. All information should be independently reviewed and verified for accuracy. Properties may or may not be listed by the office/agent presenting the information. Some IDX listings have been excluded from this website.
About us
Find us
Subsidiaries
Copyright: © 2025 Redfin. All rights reserved.
Updated January 2023: By searching, you agree to the Terms of Use, and Privacy Policy.
Do not sell or share my personal information.
REDFIN and all REDFIN variants, TITLE FORWARD, WALK SCORE, and the R logos, are trademarks of Redfin Corporation, registered or pending in the USPTO.
California DRE #01521930
Redfin is licensed to do business in New York as Redfin Real Estate. NY Standard Operating Procedures
New Mexico Real Estate Licenses
TREC: Info About Brokerage Services, Consumer Protection Notice
If you are using a screen reader, or having trouble reading this website, please call Redfin Customer Support for help at 1-844-759-7732.
 REDFIN IS COMMITTED TO AND ABIDES BY THE FAIR HOUSING ACT AND EQUAL OPPORTUNITY ACT. READ REDFIN'S FAIR HOUSING POLICY AND THE NEW YORK STATE FAIR HOUSING NOTICE.
 United States
 Canada