Brackett Court is intimate, boutique 10 unit conversion zero lot line townhome community with low HOA dues with exceptional value 1516 sq. ft. 2 bedroom w/ 2 car garage. Close to ferries and downtown Edmonds shopping. Stainless appliances including refrigerator and convection clean top range. washer & dryer included. Vinyl plank flooring throughout most of main living area, new carpet. Private patio area to enjoy your fully landscaped backyard. Gas fireplace for chilly nights with remote control. Easy commute to downtown Seattle or Boeing, Microsoft and Google. Pets allowed with restrictions. Brackett Court.
1/27
$645,000
2 beds2.5 baths1,516 sq ft1,100 sq ft (lot)
23228 Edmonds Way #103, Edmonds, WA 98026
Listing provided by NWMLS as Distributed by MLS Grid
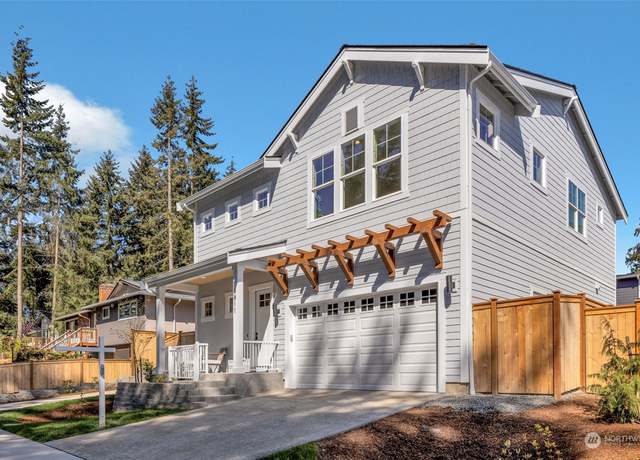
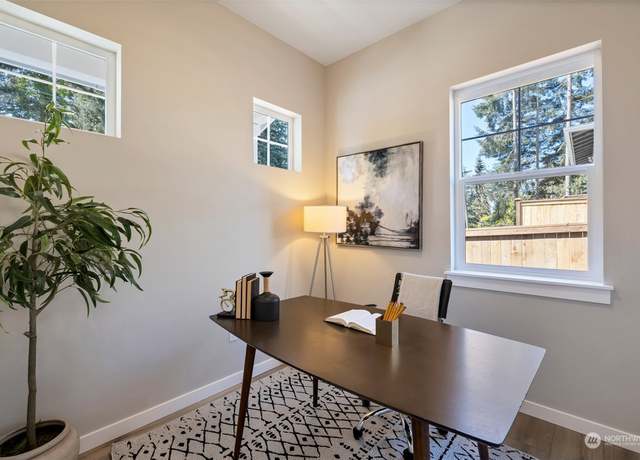
One of the last remaining homes at Vivero West - A boutique community in the heart of Edmonds. Unit Two features the most usable yard space and Western/Southern exposure for wonderful natural light. Chef's dream kitchen complete with Cafe appliances, a dedicated office/den, soaring 10' ceilings and a statement powder bath complete the main floor. Upstairs features a grand owner's suite with vaulted ceiling, spa-like bath and custom walk-in closet. Three more bedrooms, a well appointed guest bath and spacious laundry room put the finishing touches on the 2nd floor. A comfortable, open floor plan, modern color palette and luxury finishes make this house a true 'on trend' pad. Ask your Broker
1/13
$1,245,000
4 beds2.5 baths2,303 sq ft
8811 224th St SW, Edmonds, WA 98026
Listing provided by NWMLS as Distributed by MLS Grid
Brackett Court is intimate, boutique 10 unit conversion zero lot line townhome community with low HOA dues with exceptional value 1516 sq. ft. 2 bedroom w/ 2 car garage. Close to ferries and downtown Edmonds shopping and easy commute to Boeing. Stainless appliances including refrigerator and convection clean top range. washer & dryer included. Vinyl plank flooring throughout most of main living area, new carpet. Private patio area to enjoy your fully landscaped backyard. Gas fireplace for chilly nights with remote control. Easy commute to downtown Seattle or Boeing, Microsoft and Google. Pets allowed with restrictions.
1/27
$645,000
2 beds2.5 baths1,516 sq ft1,100 sq ft (lot)
23230 Edmonds Way #102, Edmonds, WA 98026
Listing provided by NWMLS as Distributed by MLS Grid
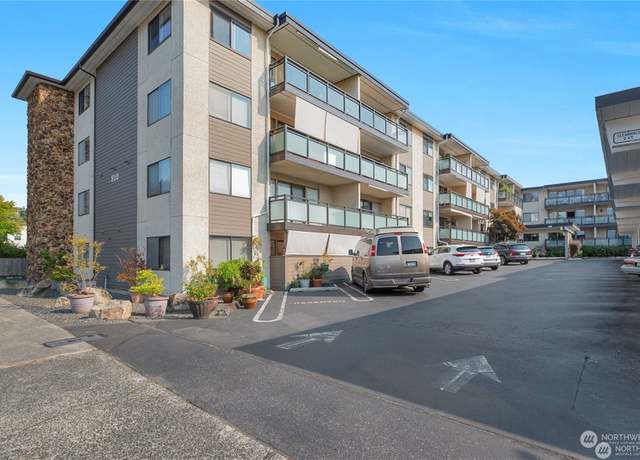
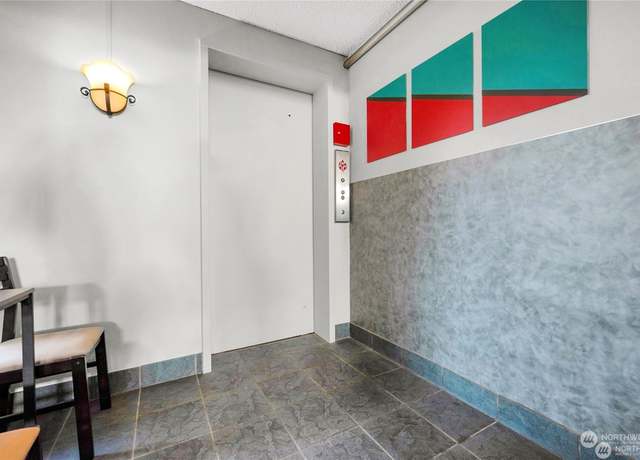
[THE CAMELOT] Fresh & Fabulous Condo located in the heart of Downtown Edmonds. Enjoy the VIEWS of PUGET SOUND, Olympic Mountains & SUNSETS from your own private deck. This 2 bed, 1 bath condo is full of natural light w/ large sliders off the living area. Primary bed w/ views & oversized walk in closet. Fresh interior paint, updated lighting & wall heaters makes this unit turn key. Secure lobby w/ elevator. Convenient washer/dryer just down the hallway on the same floor. One designated parking space + plenty of off street parking. Near walkable amenities including restaurants, beach, ferry terminal, parks, coffee shops & fishing pier! LOW monthly dues and strong
1/31
$474,900
2 beds1 bath927 sq ft
510 Forsyth Ln #305, Edmonds, WA 98020
Listing provided by NWMLS as Distributed by MLS Grid
Stunning Puget Sound & Olympic views from end to end in this Emerald Hills beauty. A perfect floor plan w/ updates throughout. Vaulted ceilings, grand size living, dining & kitchen with sweeping views. You will enjoy entertaining in your chef's kitchen w/ granite counters, SS appliances, abundance of cabinets w/ pantry & French doors to deck. Main floor also includes master suite w/ bath & walk in closet along w/ 2nd bed. Lower level consist of spacious family room w/ 3 beds, bath w/ jetted tub & double walk in shower, full kitchen w/ eating bar, dining & separate entrance (MIL?). Outdoor oasis has beautiful mature landscaping & 5 patio areas w/ an
1/36
$2,350,000
5 beds2.5 baths3,496 sq ft0.28 acre (lot)
614 12th Ave N, Edmonds, WA 98020
Listing provided by NWMLS as Distributed by MLS Grid
Live the life in prime Edmonds locale! Beautiful custom home one block up from the Sound on quiet lane. Captivating Puget Sound, Olympic Mountain and Sunset views. Open floor plan, substantial scale, quality construction. Spacious rooms, tall ceilings, maple floors, indoor-outdoor spaces. Very well maintained! Kitchen-family room with high end appliances, custom maple cabinets & slab granite countertops. Cathedral ceilings in primary suite plus large bath, walk-in closet & view balcony. Spacious daylight lower level has easy potential for MIL quarters. Sizable lot surrounding the home features 2 grand decks, garden & lawn space for hobby, entertainment or play. 3 stall dre
$2,495,000
5 beds4 baths5,074 sq ft0.28 acre (lot)
18829 Soundview Pl, Edmonds, WA 98020
Listing provided by NWMLS as Distributed by MLS Grid
Exceptional mid-century gem is a block away from Madrona School, nestled at the end of quiet street. This untouched rambler, ready for a modern revival, is nicely situated on a fenced lot surrounded by nature. The location offers the perfect balance between convenience & serenity. Upon entering this home let your imagination flow w/ it's potential. The term “this home has great bones” really applies here w/ original hardwoods under the carpet, vaulted ceilings and exposed beams (home inspection available). Finished downstairs space leaves room for adding a 2nd kitchen. MIL or rental potential w/ separate bath & outside entrance. RV & boat parking an added plus.
$849,950
4 beds3 baths2,480 sq ft0.24 acre (lot)
23717 91st Ave W, Edmonds, WA 98026
Listing provided by NWMLS as Distributed by MLS Grid
Discover the pride of homeownership in this cherished Picnic Point haven! Meticulously updated, this 4bed, 2.5bath sanctuary offers comfort at every turn. From the freshly planted fruit trees to the attached 2-car garage w/ ample storage, every detail reflects a commitment to quality living. Step inside to find hardwoods throughout, creating a warm ambiance that complements the luxurious primary bdrm with spacious en suite. Updated triple-pane windows, with a convenient floorplan invites seamless entertaining. Outside, a newly painted exterior and welcoming composite front porch add to the home's timeless elegance and charm. Whether hosting gatherings or enjoying quiet moments, seize the op
$1,029,000
4 beds2.5 baths2,125 sq ft9,583 sq ft (lot)
6304 137th Pl SW, Edmonds, WA 98026
Listing provided by NWMLS as Distributed by MLS Grid
Discover this stunning tri-level home on a tranquil street with high ceilings and skylights. This home features 3 bedrooms and a versatile office that can easily serve as a 4th bedroom or guest room, plus 2.75 bathrooms. The spacious master suite has a walk-in closet. Highlights include a family room, dining room, living room, bonus/media room, wrap-around back deck, and an enclosed patio. The lower level presents potential for a private MIL suite. Ample storage and a large garage enhance in a friendly neighborhood served by the esteemed Edmonds school district. It features a fully fenced backyard with a private sports court and a sunlit gardening space. This home shows true pride of owners
$1,049,800
3 beds3 baths2,278 sq ft9,583 sq ft (lot)
22521 91st Ave W, Edmonds, WA 98026
Listing provided by NWMLS as Distributed by MLS Grid
Tucked on a charming pedestrian friendly street in the desirable Meadowdale neighborhood this classic split level has it all! Beautifully upgraded with new floors, paint, kitchen, vanities, light fixtures, stainless steel appliances and more! Great floorplan upstairs w/ easy flowing kitchen/dining/living room and 3 bedrooms including primary w/ ensuite bath. Downstairs rec room features cozy fireplace, builtins and ample space for hanging out. Large deck, multiple patio spaces, a huge lawn and fully fenced backyard provide so many opportunities for outdoor living. Extra large garage, laundry room and shed make storage a breeze. Tons of parking including room for your RV/boat! Pre-inspected.
$850,000
3 beds2.5 baths1,732 sq ft8,276 sq ft (lot)
4910 152nd St SW, Edmonds, WA 98026
Listing provided by NWMLS as Distributed by MLS Grid
Legal non conforming duplex the will become legal in 2025 per City of Edmonds. The units were updated in 2021 with new kitchens, bathrooms, carpeting and raised panel doors. Exterior was painted in 2020, new asphalt driveway in 2020, all new double pane windows in 2021, new deck & railing 2023, new electrical panels 2023, flat roof replaced in 2021, new water heater in 18101 2022 and new dryer in 18105 in 2023. Huge treed lot provides excellent privacy and a sylvan view. 2 car carport and plenty of extra parking. South facing Clerestory windows bathe the upper unit in natural light. Storage space with power for each unit. Superb location a short walk the Perrinville restaurants &
$975,000
4 beds2.5 baths2,612 sq ft0.46 acre (lot)
18101 76th Ave W, Edmonds, WA 98026
Listing provided by NWMLS as Distributed by MLS Grid
This Parkside home offers a truly remarkable living experience. True masterpiece & rare opportunity to own a unique & impeccably maintained rambler w/ endless Sound, Mountain, Island views. Exudes sophisticated style, creating an inviting atmosphere perfect for both relaxation & grand entertaining. Extensive windows flood the interior w/ warmth & serenity. Kitchen fit for a culinary enthusiast featuring newer luxury SS appliances, custom crafted cabinetry w/ designer backsplash & gorgeous countertops. Rich hardwood & marble flrs, newer interior paint, vaulted/coffered ceilings w/ wainscoting. Cozy up in style w/ private sunroom surrounded by windows &
$1,400,000
3 beds2 baths2,365 sq ft0.24 acre (lot)
6333 139th Pl SW, Edmonds, WA 98026
Listing provided by NWMLS as Distributed by MLS Grid
Step inside this nicely updated Edmonds home at Villa Royale Community. New interior Paint, Lighting & Carpet throughout are a great refresh. Light & Bright kitchen features Cherry Cabinets, New SS modern faucet, Flooring & Lighting plus Spacious dining area. Living Room features Wood burning fireplace and adjacent Powder room. Fully fenced, private patio off kitchen offers Gardening & Dining space for year-round enjoyment. Primary bedroom with ensuite bath & 2nd bedroom/ flex space located on upper floor--large closets in both rooms. Edmonds City center Restaurants, Cafes, Shopping, Beach, PCC, Starbucks & more, close by. 2 deeded covered parking &
$400,000
2 beds1.5 baths1,086 sq ft
8713 238th St SW Unit A8, Edmonds, WA 98026
Listing provided by NWMLS as Distributed by MLS Grid
This condo bldg in Edmonds has 4 units. Spacious 1567sqft living space. Inside entrance has a coat, shoes, storage area. Kitchen is big & bright w/ a pantry. A door leads out to small deck and two steps down to huge fully fenced backyard. Room for a garden & concrete pad for basketball or leisure activities. The living room has big picture windows looking to the back yard. Master has en suite & walk in closet. The 2 other bdrms are large w/ oversize closets. W/ D are upstairs & all appliances are included. Carpets cleaned, freshly painted outside & new roof in 2018. Water heater is 2 yrs old. Window coverings stay & new insulation under unit. Pet friendly
$545,000
3 beds2.5 baths1,567 sq ft
23601 79th Ave W #3, Edmonds, WA 98026
Listing provided by NWMLS as Distributed by MLS Grid
Nestled on a lushly landscaped lot, this Edmonds classic offers fresh updates for modern living. You’ll love the bright, open layout with hardwoods throughout. Gather alongside the cozy fireplace, host parties in the spacious dining area, whip up gourmet meals in the beautiful stainless/quartz kitchen or watch movies together in the new stepdown family room. Three bedrooms together on the main, including your generous owner’s suite with private access to the sunny deck. Discover extra flex space downstairs with a huge rec room & 4th bedroom. Outside, a level lawn & raised planting beds await your summer sports & veggie garden. This peaceful locale is just minut
$1,070,000
4 beds2.5 baths2,721 sq ft0.26 acre (lot)
19500 84th Ave W, Edmonds, WA 98026
Listing provided by NWMLS as Distributed by MLS Grid
Nestled on a tranquil dead-end street in the heart of the picturesque Pacific Northwest, this home boasts captivating western exposure. Savor your morning coffee on one of three decks or from the numerous windows throughout the house while you watch seals, bald eagles, and passing water traffic. With two bedrooms (potentially three), an oversized garage, shed, and spacious lot, this property offers ample potential. It's a perfect opportunity for remodeling to suit your preferences, creating your dream waterfront estate. Priced thoughtfully, this isn't just a residence; it's a wise investment for those who value the sea and seek to blend the Northwest sound lifestyle with financial savvy. Be
$950,000
3 beds3 baths2,000 sq ft0.41 acre (lot)
12331 Possession Ln, Edmonds, WA 98026
Listing provided by NWMLS as Distributed by MLS Grid
{{Cascade Cottages}}, where refined living meets unparalleled convenience, an enclave of 16 private residences. This meticulously maintained detached 2-bed, 2.5 ba townhome is a testament to comfort and functionality. Step inside to discover premium bamboo flooring, quartz countertops, & stylish subway tile accents that evoke a sense of timeless elegance. The heart of the home features a large breakfast bar, Kohler farm sink, & upgraded appliances, offering both practicality & sophistication. Entertain effortlessly on the private front patio, perfect for barbecuing & enjoying al fresco dining. The oversized two-car garage with a storage room ensures ample space for all
$675,000
2 beds2.5 baths1,437 sq ft2,178 sq ft (lot)
7555 210th St SW, Edmonds, WA 98026
Listing provided by NWMLS as Distributed by MLS Grid
Discover tranquil living in the heart of Edmonds at this beautifully remodeled home. An open floorplan welcomes you home w warm hardwood floors & natural light throughout. Gorgeous, remodeled kitchen complete w shaker cabinetry, slab countertops, modern SS appliances, heated slate floors + peekaboo mountain views! Retreat to the primary suite w a spa-like ensuite bath + heated tile floors! Relax/entertain year-round thanks to the large deck w covered outdoor seating/BBQ areas! Fully fenced & level lot + mature landscaping offers areas for projects, play or privacy. Massive garage & outbuilding provide plenty of room for any vehicle or hobby you have in mind, even RV/boat s
$1,100,000
4 beds3 baths2,926 sq ft0.31 acre (lot)
8821 228th St SW, Edmonds, WA 98026
Listing provided by NWMLS as Distributed by MLS Grid
Just a mile from the heart of Downtown Edmonds, this light-filled Edmonds Bowl home is loaded w/ amazing potential. Ready for your updates & inspired personal touches, this is your opportunity to create something extraordinary (staging is virtual). Main floor features a generous living room w/ vaulted ceiling, gas fireplace, & pleasant peek-a-boo view. The adjoining formal dining area opens to an entertainment-sized deck. Primary bedroom w/ attached bath offers a sunroom perfect for your morning coffee. The lower level features a large rec-room w/ sliders to the private yard, a 4th bedroom, and a 2-car garage w/ abundant storage. Fantastic location just across the street from 7t
$1,250,000
4 beds3 baths2,548 sq ft7,841 sq ft (lot)
740 Elm St, Edmonds, WA 98020
Listing provided by NWMLS as Distributed by MLS Grid
Luxury meets warmth in this custom-built Woodway residence nestled on 1-acre. Every element integrates everyday functionality w/ timeless aesthetics. Soaring 2-story great room, the inviting atmosphere is accented by multiple French doors creating an easy flow between indoor & outdoor spaces. Formal dining opens to the expansive terrace, w/ an arbor, water feature, & outdoor fireplace. Gourmet kitchen w/ Viking gas range & thoughtful layout for effortless entertaining. The breakfast nook, give tons of extra seating. Luxurious hardwoods. Thoughtful built-ins throughout. Gracious entry, complete w/ circular driveway. 3-car garage. A/C. Office, 2 bonus rooms. Built-in speakers
$2,575,000
3 beds2.5 baths2,754 sq ft1.00 acre (lot)
21801 Makah Rd, Woodway, WA 98020
Listing provided by NWMLS as Distributed by MLS Grid
Welcome to Lennar's newest community in Edmonds - Bexley Ridge! Introducing the Adams floorplan, this comfortable three-story home offers a two-car garage on the first level, ideal for storage, and an open design on the second story that encompasses the Great Room, dining room and kitchen. Access to a patio and extra bedroom allows for flexible living, while the third floor privately hosts the remaining bedrooms and a versatile bonus room. Everything from kitchen appliances, window blinds, air conditioning, rear fencing, and landscaping are all included! If you are working with a Licensed Broker they must accompany you on the first visit per site registration policy.
$1,249,950
4 beds3 baths2,855 sq ft4,811 sq ft (lot)
6028 135th Pl SW #78, Edmonds, WA 98026
Listing provided by NWMLS as Distributed by MLS Grid
Offers due 4/24/2024 by 3pm. The Azalea by MainVue Homes is a five bedroom basement home design that inspires innovation and style. At the Foyer you are greeted by the Home Office and Multi-Purpose Room. The Gourmet Kitchen features 3cm Quartz counters, Stainless Steel appliances, Frameless Cabinetry and Grand Butler’s Pantry. The Signature Outdoor Room is accessed via three wall-height sliding glass doors from the Great Room, Dining and Kitchen. Downstairs, find a Guest Room, Full Bathroom, Recreation Room, and Covered Patio. Upstairs secondary bedrooms await, Leisure Room and the luxurious Grand Suite. Customer registration policy: Buyer’s Broker to visit or be registered on B
$1,733,995
5 beds3.5 baths4,273 sq ft5,000 sq ft (lot)
5912 160th St SW, Edmonds, WA 98026
Listing provided by NWMLS as Distributed by MLS Grid
Offers due 4/24/24 by 3pm. The Briar by MainVue Homes at Edmonds Ridge is an expansive design. Upon entry, the Foyer debuts a corner-set Home Office. Down the hall, glide into the entertainment ready Multi-Purpose Room or head straight to the main living areas of the Great Room and Dining, both connected to the Signature Outdoor Room via wall height sliding glass doors. Enjoy the expansive Gourmet Kitchen featuring 3cm Quartz Counters, Stainless Steel appliances and Grand Butler’s Pantry. Upstairs, find the Grand Suite with a frameless walk-in shower, designer free standing tub and walk-in Dressing Room. Customer registration policy: Buyer’s Broker to visit or be registered on B
$1,561,995
4 beds4 baths3,858 sq ft6,581 sq ft (lot)
5621 160th St SW, Edmonds, WA 98026
Listing provided by NWMLS as Distributed by MLS Grid
This spacious 1960's mid-century split level is located on a quiet cul-de-sac in Esperance. Bring your vision and tool belt, this diamond in the rough has 6 bedrooms and 2.75 bathrooms, oversized family room, lower-level bonus room and plenty of space for multigenerational living. There are hardwoods under the carpet on most of the main level, two fireplaces, 4 bedrooms up and 2 on the lower level with a small office. Laundry room just off the bonus room could be converted into a small kitchen. Large backyard with a deck, patio and a pool house. Close in location, convenient for commuting and near all that Edmonds has to offer, dining, parks, beaches, ferries and more.
$1,025,000
7 beds3 baths3,044 sq ft9,583 sq ft (lot)
22425 85th Ave W, Edmonds, WA 98026
Listing provided by NWMLS as Distributed by MLS Grid
One-of-a-kind home in sought after Edmonds Bowl with expansive views nestled on a shy half acre of private & manicured grounds. This stately custom residence has been updated with the highest quality finishes. Enter into a wall of windows & high density bamboo decks to enjoy 180 degree sound & mountain views. Main level features gas fp, dining rm, skylights throughout, updated kitchen w/ shaker maple cabinets, Pental Quartz counters, breakfast nook w/ floor to ceiling windows, maple HW’s & primary suite w/ private deck and hot tub. Lower level features living area & updated kitchen w/ stunning water views, 4 bedrms, updated baths, W & D & wheelc
$3,750,000
5 beds3.5 baths4,222 sq ft0.39 acre (lot)
711 Driftwood Pl, Edmonds, WA 98020
Listing provided by NWMLS as Distributed by MLS Grid
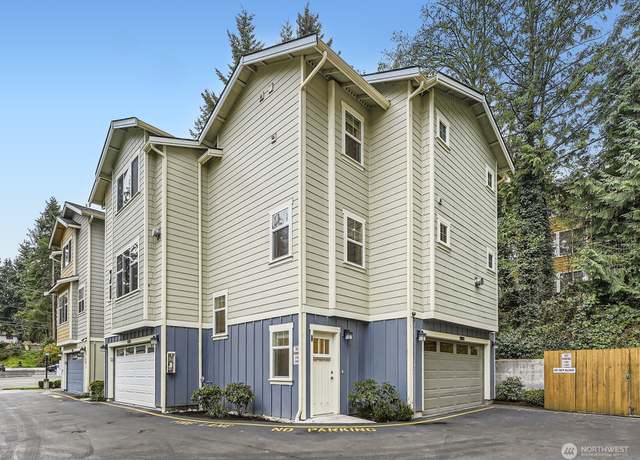
Welcome to Centerstone Townhomes located in the highly sought-after Edmonds community. Embrace the tranquility of easy living in this inviting, functional end-unit, where modern comforts meet timeless elegance. Escape to this stunning community where relaxation & convenience harmonize effortlessly. Enhancements featured in this former Model Home are, gleaming LVP floors, designer finishes, quartz counters, high-end SS appliances, & a 2-car tandem garage. Upstairs you will find 3 bedrooms including a lovely primary suite w/ private bath, walk-in closet & convenient adjacent laundry room. Discover the perfect blend of comfort & convenience in this charming home offering
$750,000
3 beds2.5 baths1,794 sq ft2,614 sq ft (lot)
16611 48th Ave W Unit C-4, Edmonds, WA 98026
Listing provided by NWMLS as Distributed by MLS Grid
Coveted new construction built by Select Homes. Tucked in Esperance, this 5-bed home offers luxurious spaces for everyday living. West-facing windows & open-concept floor plan for tons of natural light. Gas fireplace & floor to ceiling tile surround. Millwork, built-ins, & wide-plank oak hardwoods throughout. Chef-style kitchen w/ custom soft-close cabinetry, quartz countertops, subway tile backsplash. All SS Kitchen Aid appl. Huge walk-in pantry. Covered deck off dining. Den & main floor Suite. Upstairs find generous Primary Suite w/ space for a sitting rm. 5-piece bath w/ dual vanities & frameless glass walk-in shower, & soaking tub. Walk-in closet w/ bui
$1,675,000
5 beds3 baths3,110 sq ft0.39 acre (lot)
8929 220th St SW, Edmonds, WA 98026
Listing provided by NWMLS as Distributed by MLS Grid
Welcome to your tranquil retreat nestled within the coveted Seaview neighborhood. Embrace the essence of modern living w/ a down to studs remodel. Step into the bright and airy living room adorned with vaulted ceilings & expansive views from every angle. Immerse yourself in luxury in the primary 5 piece en-suite bath & WIC. Step outside onto the spacious deck & soak in the natural beauty of the private backyard oasis from a private hot tub & gazebo. Lower level presents boundless possibilities as an ADU or multi-family living. Fully equipped 2nd kitchen, living area, W/ D, & 3 bed/1.5 bath provides flexibility to suit your needs & lifestyle. Live moments a
$1,349,000
6 beds3.5 baths3,280 sq ft0.32 acre (lot)
19230 88th Ave W, Edmonds, WA 98026
Listing provided by NWMLS as Distributed by MLS Grid
This 4 bed, 2.5 bath Edmonds home is perfect for comfortable living & entertaining. The bright & airy living room upstairs boasts wood clad vaulted ceilings & large windows allowing tons of natural light. A spacious great room and dining area off the kitchen provide ample space for gatherings. The lower level features a generous rec-room with a wet bar, ideal for hosting. Step outside to enjoy the multiple decks with views of Puget Sound & the Olympic Mountains. The well-maintained front yard adds to the home's curb appeal, creating a charming first impression. Oversized 2-car garage, which includes extra space for a workshop or storage. Just moments from Downtown Ed
$1,550,000
4 beds3 baths3,486 sq ft0.27 acre (lot)
17151 Sealawn Dr, Edmonds, WA 98026
Listing provided by NWMLS as Distributed by MLS Grid
Lovely second story condo in Willow Creek, impeccably maintained with modern updates. Bamboo floors, newer cabinets, and stone wood burning fireplace. Large open living spaces and a huge deck with storage that captures the sunsets. Entertaining will be easy in the Cooks Kitchen and there's plenty of room for helpers. This unit is in excellent condition and has a spacious laundry room andl storage. Pamper yourself in the luxurious baths to create a spa feel. Two large bedrooms, primary expansive westside windows and they have oversizded closets. Edmonds a desired location!
$625,000
2 beds2 baths— sq ft
1224 6th Ave S Unit C201, Edmonds, WA 98020
Listing provided by NWMLS as Distributed by MLS Grid
This stunning and elegant end-unit townhome shows like new and boasts many upgrades, with a well designed open floor plan with 9-foot ceilings and lots of natural light. The open great room, dining area and chef's kitchen offer the perfect venue for gatherings. The large & sunny Trex deck on the ground level and separate deck off living room offer multiple outdoor living choices. Side yard stone pavers. You will cherish the 2 car garage with additional shop or hobby space fully covered raised-coin floor in garage. Extra guest parking in complex. HOA dues cover landscape maintenance, and the convenient location near amenities and commuting routes. Just minutes from downtown Edmonds wat
$764,950
3 beds2.5 baths1,816 sq ft2,178 sq ft (lot)
16611 48th Ave W Unit G-17, Edmonds, WA 98026
Listing provided by NWMLS as Distributed by MLS Grid
Welcome to Lennar's newest community in Edmonds - Bexley Ridge! Introducing the Magnolia, this two-story single-family home provides plenty of space, with an expansive open layout on the first floor among the gourmet kitchen, spacious Great Room, dining area, and covered back patio. Upstairs a loft adds more shared living space and is surrounded by all four bedrooms, including the lavish owner’s suite with spa-like bathroom and large walk-in closet. Everything from kitchen appliances, window blinds, air conditioning, rear fencing, and landscaping are all included! August 24' move-in! If you are working with a Licensed Broker they must accompany you on the first visit per site registra
$1,234,950
4 beds2.5 baths2,501 sq ft3,886 sq ft (lot)
6007 135th St SW #10, Edmonds, WA 98026
Listing provided by NWMLS as Distributed by MLS Grid
First time on market since built in 1989! Walk into a serene and spectacular space, just waiting for you to settle in and relax. Minutes from downtown Edmonds with loads of great shops, delicious restaurants, waterfront parks, Kingston Ferry, and 5 min from Hutt Park. You'll be thrilled to call this place home! This beautiful 4bed/2.5bath home has been lovingly maintained and updated over the years. Granite and quartz countertops in kitchens plus 2 of 3 bathrooms, newer carpets, EV charger. Lovely rooftop deck with views of Puget Sound & Olympic Mountains bringing sunny weekend mornings and beautiful sunsets to you. Gorgeous grounds with a stunning south garden area full of species pl
$1,375,000
4 beds2.5 baths2,646 sq ft0.33 acre (lot)
9303 192nd Pl SW, Edmonds, WA 98020
Listing provided by NWMLS as Distributed by MLS Grid
The Chambre in downtown Edmonds! Immaculate one-level condo with NO Steps from curb to the private entrance. Easy stroll to Edmond's finest restaurants, boutiques, beaches, and ferry. Bright and cheery corner unit with loads of natural light. Spacious kitchen with granite counters, quality wood cabinets and an adjacent walk-in pantry. Inviting primary suite with walk-in closet & remodeled bath with granite counters. Private, oversized garage with lots of storage space; ample room for a full-sized vehicle PLUS a golf cart or small electric vehicle. Need more storage space? No worries, the unit also comes with a large secure storage room! Quality condo coupled with a fantastic location-
$999,950
2 beds2 baths1,722 sq ft
555 Walnut St #6, Edmonds, WA 98020
Listing provided by NWMLS as Distributed by MLS Grid
Discover refined living at its best in this updated 3-level townhome nestled within the exclusive gated community of Sterling Crest. Step into the sun-drenched sunken living room, where floor-to-ceiling windows illuminate the hardwood floors & cozy gas FP, creating an ambiance of warmth & elegance. The modern galley kitchen, accompanied by a formal dining room w/ FP seamlessly transitions to a private deck perfect for relaxation. Upstairs, the Owner's Suite awaits offering a private updated bath. 2 add'l bedrooms, full bath & practical laundry area complete the upper level. Lower level offers 2-car garage & versatile bonus room offer endless possibilities. Situated i
$725,000
3 beds2.5 baths1,660 sq ft3,485 sq ft (lot)
19523 86th Ave W #523, Edmonds, WA 98026
Listing provided by NWMLS as Distributed by MLS Grid
Located in one of Edmonds' most sought-after neighborhoods, this home boasts arguably one of the most spectacular views in all of Edmonds. The home features timeless interior details, including formal living & dining areas, soaring ceilings w/ skylights, Italian marble & Hardwood floors. Huge island Kitchen w/ stone counters. Primary suite w/ a gas fireplace, walk-in closet & spa like bath. Outdoor oasis w/ immaculate landscaping & a heated pool. Add’l feat: 5 fireplaces, pwr sun shades, A/C, Surround sound, sauna & hot tub. The walk-out lower level has a spacious rec room w/ a bar, separate 3-beds, 3-baths, MIL unit w/ kitchenette. 1000 sqft 4 car garage
$3,250,000
5 beds5 baths5,525 sq ft0.29 acre (lot)
1220 Viewland Way, Edmonds, WA 98020
Listing provided by NWMLS as Distributed by MLS Grid
Welcome to the Willow Creek Condominiums. Enjoy views of Willow creek from this spacious 2-bedroom, 1.75-bathroom unit with 1,186 sqft of living space. This unit features a well-appointed primary bedroom with en-suite bath with shower, double sink vanity and several closets. The kitchen features plenty of space for cooking and entertainment. The generous living and dining room spaces lead to a private enclosed deck with storage room. This unit has a generous utility room with full-size laundry and storage. This unit has 2 assigned covered parking spots and a large storage locker in the building. Located just a few minutes from shopping, dining and parks in downtown Edmonds. Come enjoy the b
$580,000
2 beds2 baths1,186 sq ft
1226 6th Ave S Unit A203, Edmonds, WA 98020
Listing provided by NWMLS as Distributed by MLS Grid
The Boardwalk of Edmonds is above the rest with a complete $5 million new envelope - roofing & gutters, siding, walkways & stairways, decks & railings. In addition, the Seller has updated the interior with a list of improvements - appliances, lighting, paint, countertops, cabinets, window treatments, carpeting. .. ! The assessment has been paid in full by the current owner! Turn the key and enjoy living in the Edmonds Bowl.
$725,000
3 beds2 baths1,216 sq ft
1024 5th Ave S Unit B303, Edmonds, WA 98020
Listing provided by NWMLS as Distributed by MLS Grid
Based on information submitted to the MLS GRID as of Sat Apr 27 2024. All data is obtained from various sources and may not have been verified by broker or MLS GRID. Supplied Open House Information is subject to change without notice. All information should be independently reviewed and verified for accuracy. Properties may or may not be listed by the office/agent presenting the information. Some IDX listings have been excluded from this website.
This area's enrollment policy is not based solely on geography. Please check the school district website for more information.
Elementary schools
Middle schools
High schools
GreatSchools Summary Rating
8/10
Maplewood Parent Coop
Public, K-8 • Choice school
8/10
Seaview Elementary School
Public, K-6
7/10
Sherwood Elementary School
Public, K-6
7/10
Edmonds Home Resource Center
Public, K-12
6/10
Edmonds Elementary School
Public, K-6
Only showing 5 of
14 elementary schools.
School data is provided by GreatSchools, a nonprofit organization. Redfin recommends buyers and renters use GreatSchools information and ratings as a first step, and conduct their own investigation to determine their desired schools or school districts, including by contacting and visiting the schools themselves.Redfin does not endorse or guarantee this information. School service boundaries are intended to be used as a reference only; they may change and are not guaranteed to be accurate. To verify school enrollment eligibility, contact the school district directly.
Homes for sale in Edmonds have a median listing price of $899K. Some of these homes are Hot Homes, meaning they're likely to sell quickly.
What are some of the most popular neighborhoods in Edmonds?
Popular neighborhoods include Edmonds Bowl, College Place, Madrona, Richmond Beach, Aurora Marketplace, Olympic View, Firdale, Port of Edmonds, Westgate, and Chase Lake.
Edmonds, Washington boasts a well-structured transportation system, making it convenient for residents to navigate the city by car. Traffic levels can vary, with rush hours typically seeing increased congestion. Public transportation is readily available, with options including buses and ferries, providing alternatives to driving. Additionally, the city is conveniently located near major highways, such as Interstate 5, offering easy access for those commuting by car. Learn more on our Edmonds city guide.
What types of properties are available in Edmonds?
Edmonds, Washington offers a variety of single-family home types, including ranch-style, split-level, and contemporary homes, among others. These homes can be found throughout the city, in neighborhoods such as Meadowdale, Westgate, and Seaview. Most properties in Edmonds, Washington feature two to five bedrooms and were built in various years. To explore different property types for sale in Edmonds, Washington, use the 'Home type' filter located above the active listings. Customize your search by selecting options like single-family homes, condos, townhomes, and more.
What is life like in Edmonds?
Edmonds, Washington offers a charming coastal lifestyle with a picturesque landscape that includes stunning views of the Puget Sound and the Olympic Mountains. The region experiences a mild and temperate climate with cool summers and mild winters, making it an ideal place for outdoor enthusiasts to enjoy activities like hiking, biking, and boating. The city provides a range of job opportunities across various industries, including technology, healthcare, and education. Residents can engage in a vibrant arts scene, explore local parks and trails, and indulge in a diverse culinary scene featuring a variety of dining options. Edmonds also hosts community events and festivals throughout the year, fostering a sense of belonging and camaraderie among its residents.
What are the schools and amenities like in Edmonds?
Edmonds, Washington boasts a range of public amenities for its residents. Dining enthusiasts will appreciate the presence of numerous restaurants offering a variety of cuisines. Outdoor lovers will enjoy the city's parks, providing ample space for relaxation and recreation. For your everyday needs, several grocery stores are conveniently located throughout the city. Additionally, Edmonds offers more amenities including schools, libraries, and healthcare facilities, ensuring a comfortable living experience.
In the past month, 57 homes have been sold in Edmonds. In addition to houses in Edmonds, there were also 26 condos, 4 townhouses, and 3 multi-family units for sale in Edmonds last month. Edmonds is a minimally walkable city in Snohomish County with a Walk Score of 48. Edmonds is home to approximately 39,407 people and 11,296 jobs. Find your dream home in Edmonds using the tools above. Use filters to narrow your search by price, square feet, beds, and baths to find homes that fit your criteria. Our top-rated real estate agents in Edmonds are local experts and are ready to answer your questions about properties, neighborhoods, schools, and the newest listings for sale in Edmonds. Our Edmonds real estate stats and trends will give you more information about home buying and selling trends in Edmonds. If you're looking to sell your home in the Edmonds area, our listing agents can help you get the best price. Redfin is redefining real estate and the home buying process in Edmonds with industry-leading technology, full-service agents, and lower fees that provide a better value for Redfin buyers and sellers.


 REDFIN IS COMMITTED TO AND ABIDES BY THE FAIR HOUSING ACT AND EQUAL OPPORTUNITY ACT. READ REDFIN'S FAIR HOUSING POLICY AND THE NEW YORK STATE FAIR HOUSING NOTICE.
 United States
 Canada