 3600 S Glebe Rd Unit 1015W, Arlington, VA 22202
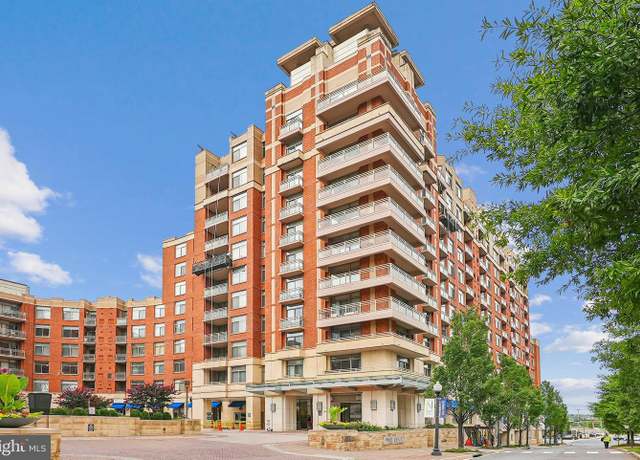 3600 S Glebe Rd Unit 1015W, Arlington, VA 22202
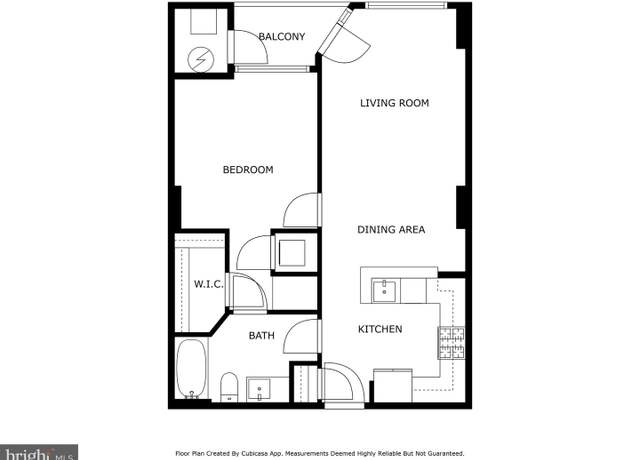 3600 S Glebe Rd Unit 1015W, Arlington, VA 22202
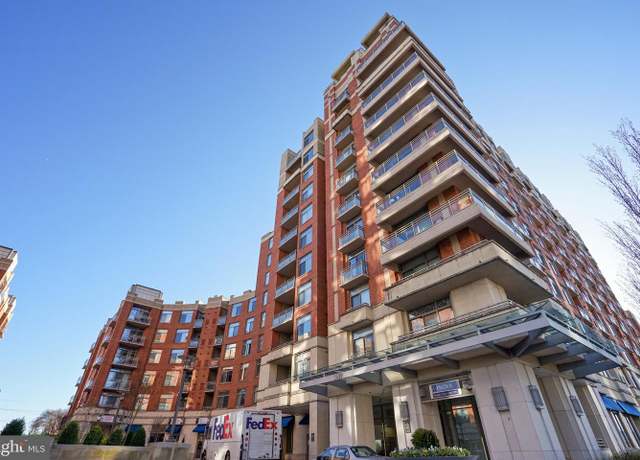 3600 S Glebe Rd Unit 1115W, Arlington, VA 22202
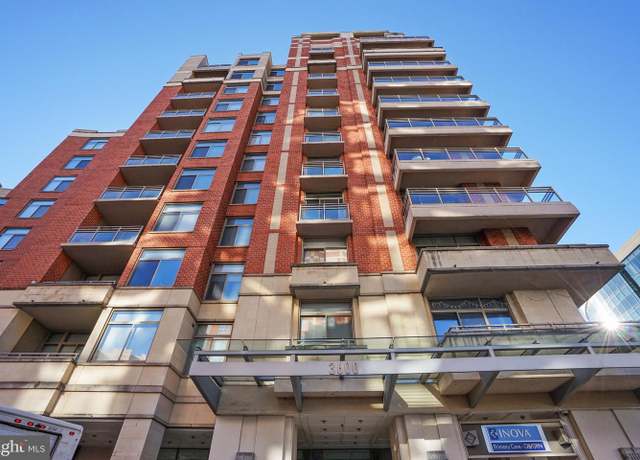 3600 S Glebe Rd Unit 1115W, Arlington, VA 22202
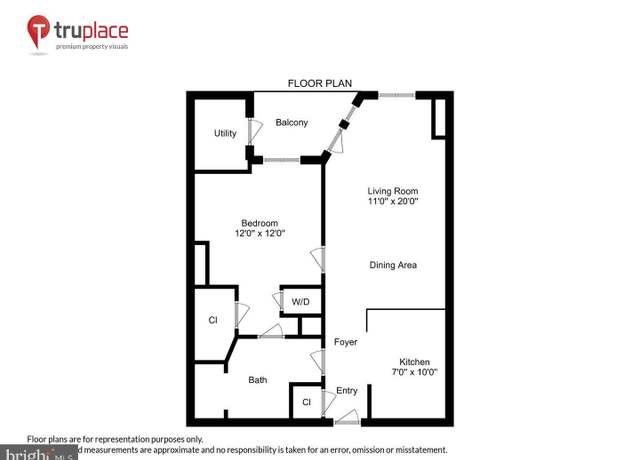 3600 S Glebe Rd Unit 1115W, Arlington, VA 22202
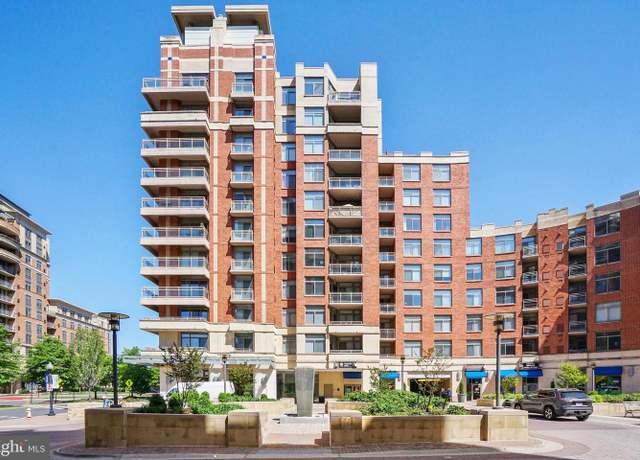 3600 S Glebe Rd Unit 613W, Arlington, VA 22202
 3600 S Glebe Rd Unit 613W, Arlington, VA 22202
 3600 S Glebe Rd Unit 613W, Arlington, VA 22202
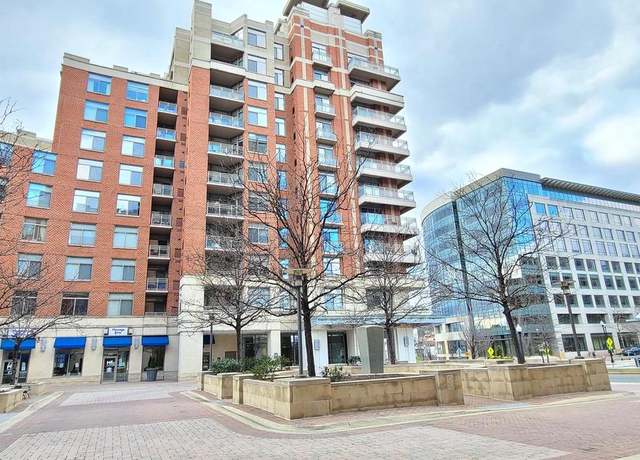 3600 S Glebe Rd Unit 330W, Arlington, VA 22202
 3600 S Glebe Rd Unit 330W, Arlington, VA 22202
 3600 S Glebe Rd Unit 330W, Arlington, VA 22202
 3650 S Glebe Rd #851, Arlington, VA 22202
 3650 S Glebe Rd #851, Arlington, VA 22202
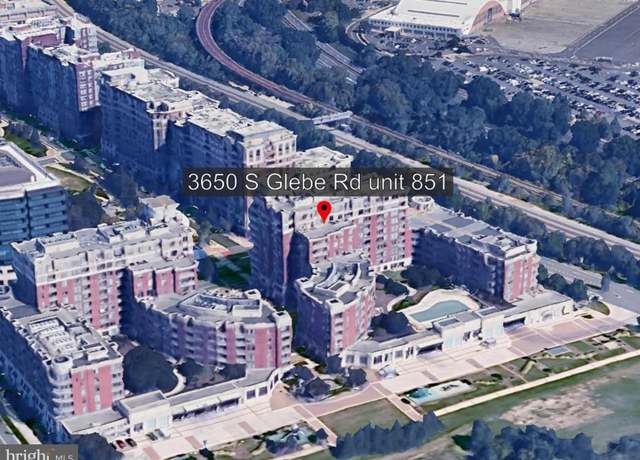 3650 S Glebe Rd #851, Arlington, VA 22202
 1211 S Eads St #601, Arlington, VA 22202
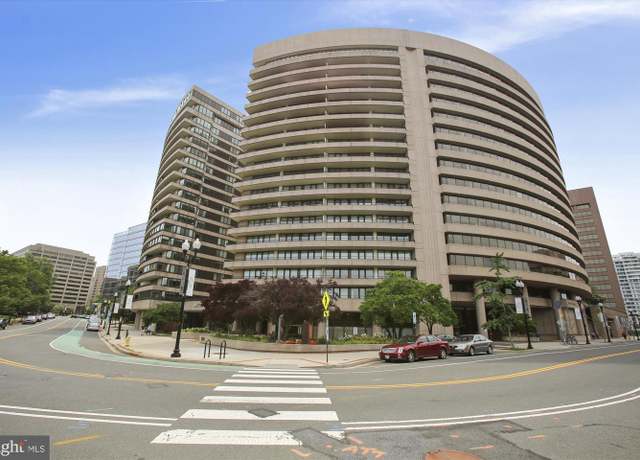 1200 Crystal Dr #514, Arlington, VA 22202
 3600 S Glebe Rd Unit 526W, Arlington, VA 22202
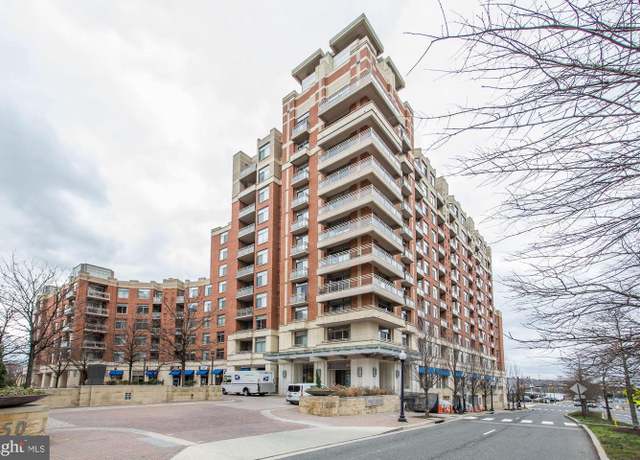 3600 S Glebe Rd Unit 215W, Arlington, VA 22202
 1805 Crystal Dr Unit 403S, Arlington, VA 22202
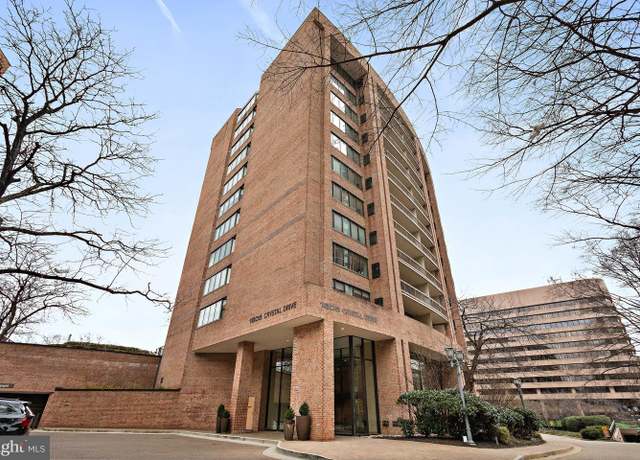 1805 Crystal Dr Unit 1016S, Arlington, VA 22202
 1805 S Crystal Dr Unit 1109S, Arlington, VA 22202
 1805 Crystal Dr Unit 504S, Arlington, VA 22202
 3650 S Glebe Rd #1050, Arlington, VA 22202
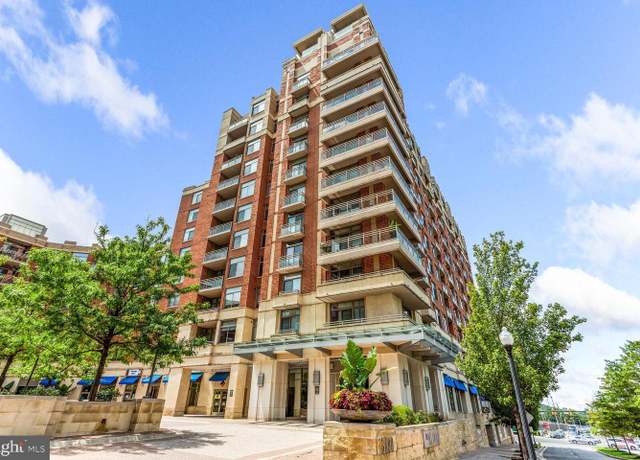 3600 S Glebe Rd Unit 822W, Arlington, VA 22202
 1805 Crystal Dr Unit 1011S, Arlington, VA 22202
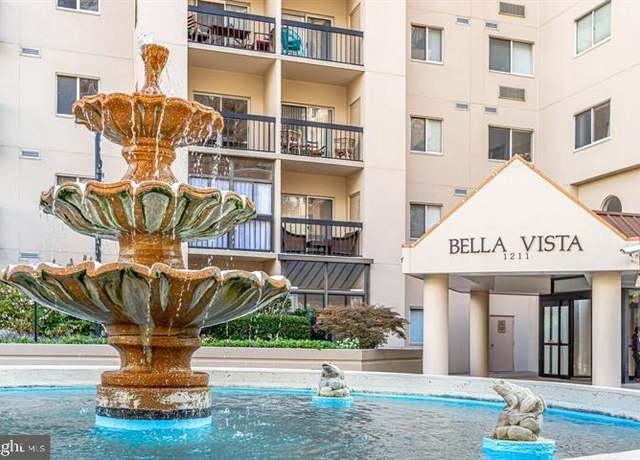 1211 S Eads St S #401, Arlington, VA 22202
 3650 S Glebe Rd #666, Arlington, VA 22202
 1805 Crystal Dr Unit 713S, Arlington, VA 22202
 1211 S Eads St #804, Arlington, VA 22202
 1300 Crystal Dr Unit 901S, Arlington, VA 22202
- Median Sale Price
- # of Homes Sold
- Median Days on Market
Median Sale Price (All Home Types)
$560,000
-8.2% YoY | Jun 2025
- 1 year
- 3 year
- 5 year
About us
Find us
Subsidiaries
Copyright: © 2025 Redfin. All rights reserved.
Updated January 2023: By searching, you agree to the Terms of Use, and Privacy Policy.
Do not sell or share my personal information.
REDFIN and all REDFIN variants, TITLE FORWARD, WALK SCORE, and the R logos, are trademarks of Redfin Corporation, registered or pending in the USPTO.
California DRE #01521930
Redfin is licensed to do business in New York as Redfin Real Estate. NY Standard Operating Procedures
New Mexico Real Estate Licenses
TREC: Info About Brokerage Services, Consumer Protection Notice
Rocket Mortgage is an affiliated business of Redfin. All mortgage lending products and information are provided by Rocket Mortgage, LLC | NMLS #3030; www.NMLSConsumerAccess.org. Licensed in 50 states. This site is not authorized by the New York State Department of Financial Services for mortgage solicitation or loan applications activities related to properties located in the State of New York. For additional information on Rocket Mortgage or to receive lending services in the State of New York, please visit RocketMortgage.com.
Rocket Mortgage, LLC, Rocket Homes Real Estate LLC, Rocket Card, LLC, RockLoans Marketplace LLC (doing business as Rocket Loans), and Rocket Money, Inc., are separate operating subsidiaries of Rocket Limited Partnership. Redfin Corporation is an affiliated business of Rocket Limited Partnership. Each company is a separate legal entity operated and managed through its own management and governance structure. Rocket Limited Partnership is an indirect, wholly owned subsidiary of Rocket Companies, Inc. (NYSE: RKT).
If you are using a screen reader, or having trouble reading this website, please call Redfin Customer Support for help at 1-844-759-7732.
 REDFIN IS COMMITTED TO AND ABIDES BY THE FAIR HOUSING ACT AND EQUAL OPPORTUNITY ACT. READ REDFIN'S FAIR HOUSING POLICY AND THE NEW YORK STATE FAIR HOUSING NOTICE.
 United States
 Canada