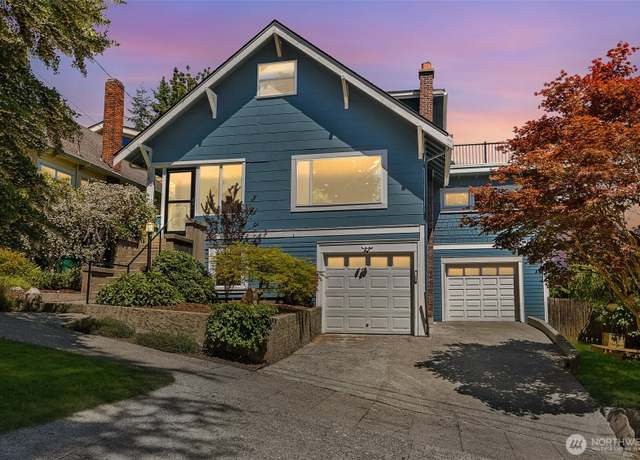
 612 N 64th St, Seattle, WA 98103
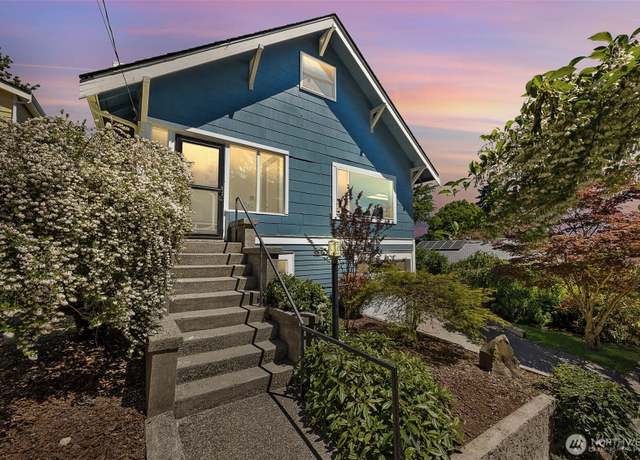 612 N 64th St, Seattle, WA 98103
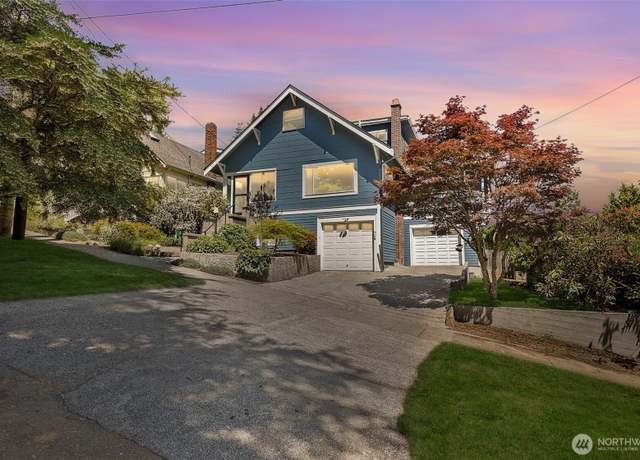 612 N 64th St, Seattle, WA 98103
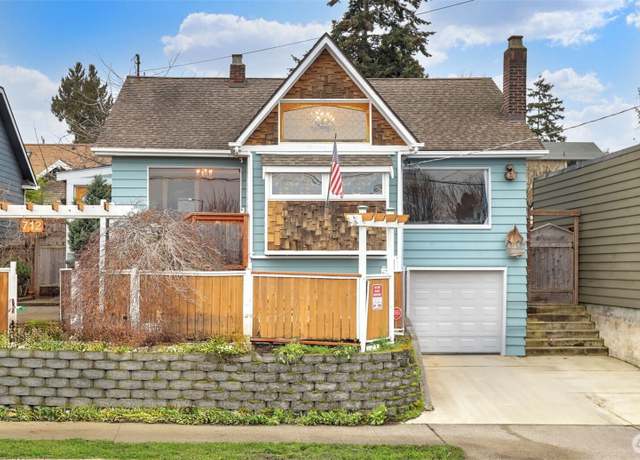 712 NW 65th St, Seattle, WA 98117
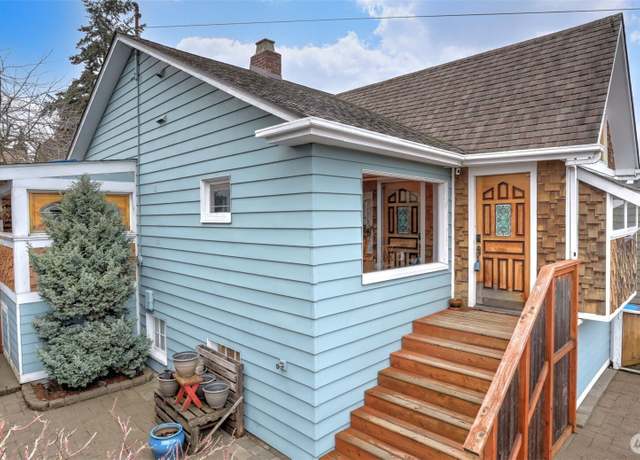 712 NW 65th St, Seattle, WA 98117
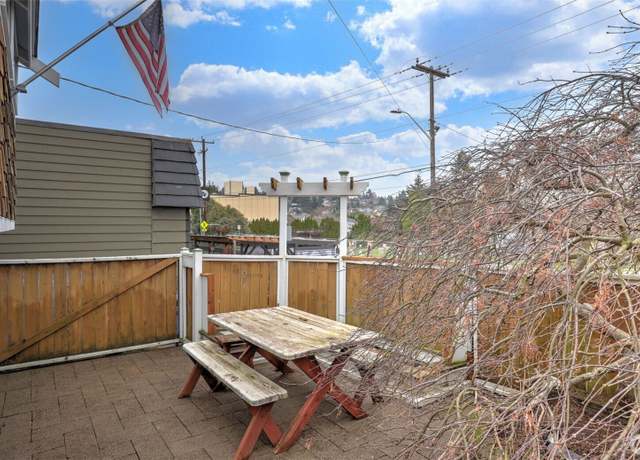 712 NW 65th St, Seattle, WA 98117
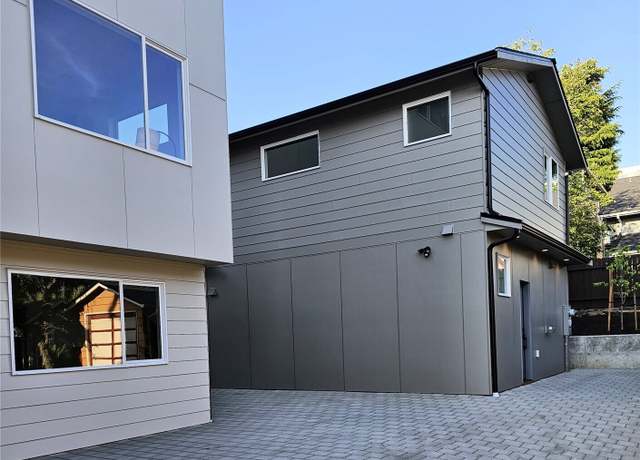 5218 1st Ave NW, Seattle, WA 98107
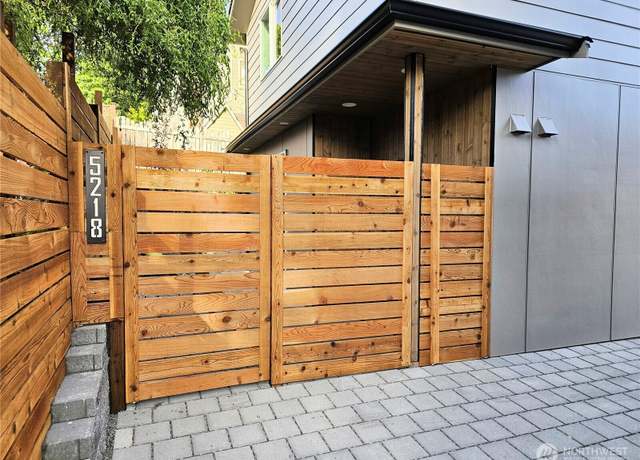 5218 1st Ave NW, Seattle, WA 98107
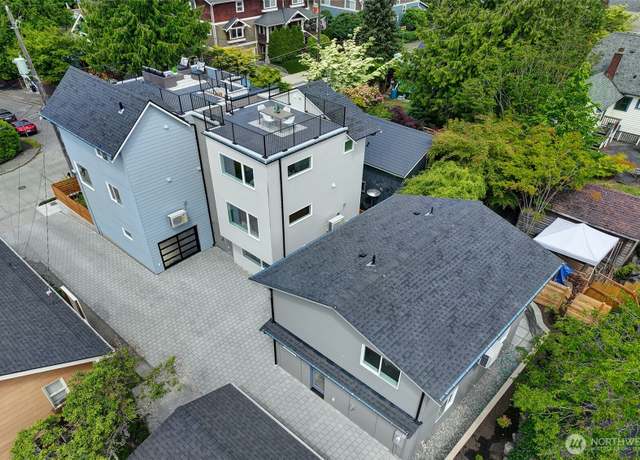 5218 1st Ave NW, Seattle, WA 98107
 101 NW 58th St #9, Seattle, WA 98107
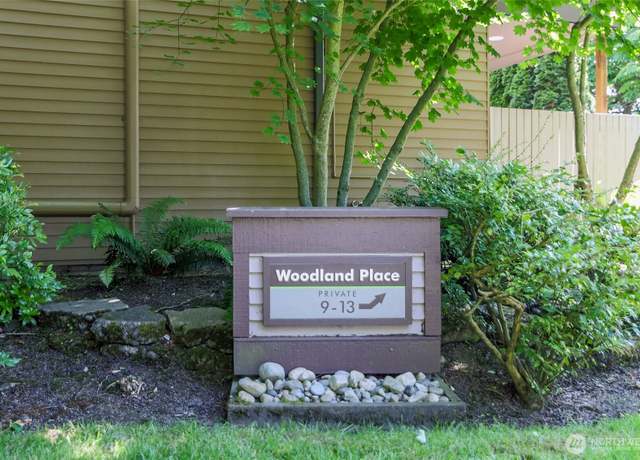 101 NW 58th St #9, Seattle, WA 98107
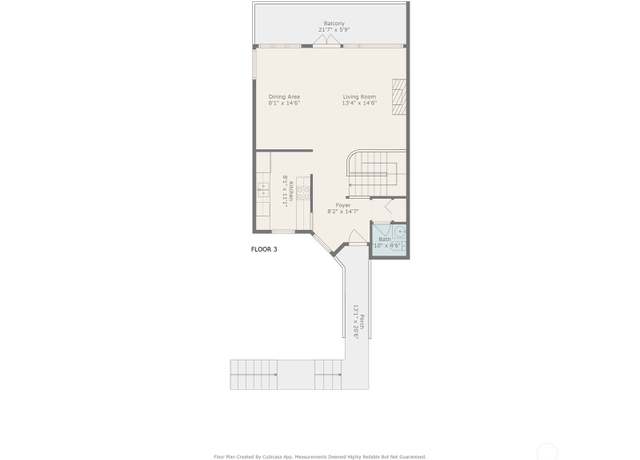 101 NW 58th St #9, Seattle, WA 98107
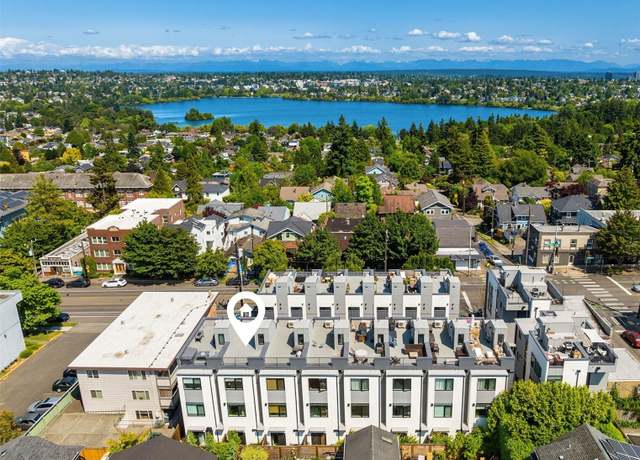 6517 Phinney Ave N Unit G, Seattle, WA 98103
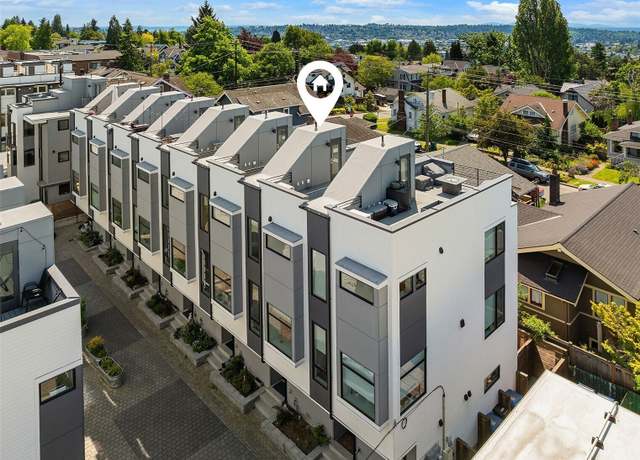 6517 Phinney Ave N Unit G, Seattle, WA 98103
 6517 Phinney Ave N Unit G, Seattle, WA 98103
 718 N 59TH St, Seattle, WA 98103
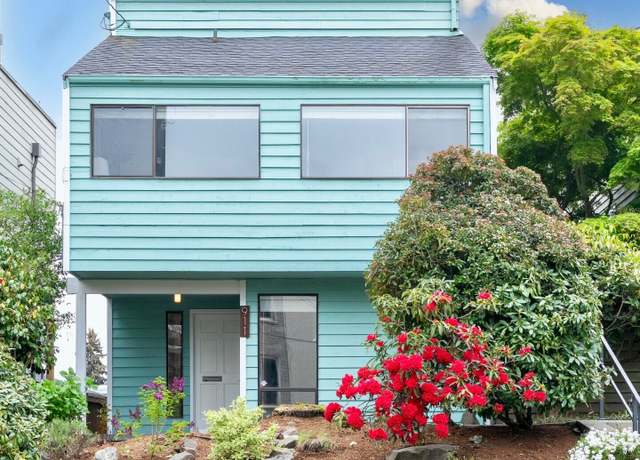 911 N 72nd St, Seattle, WA 98103
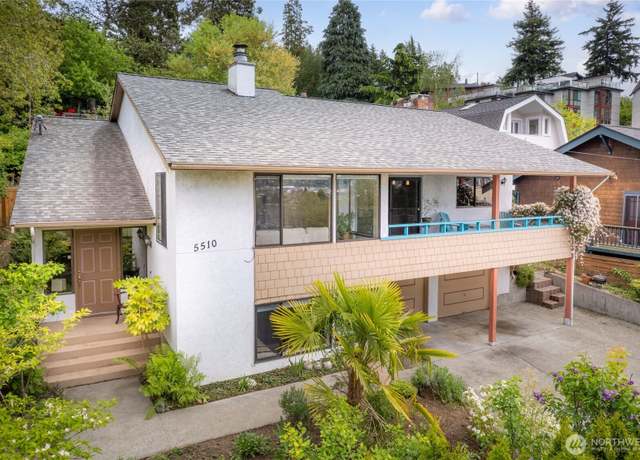 5510 3rd Ave NW, Seattle, WA 98107
 5801 Phinney Ave N #103, Seattle, WA 98103
 7107 Aurora Ave N, Seattle, WA 98103
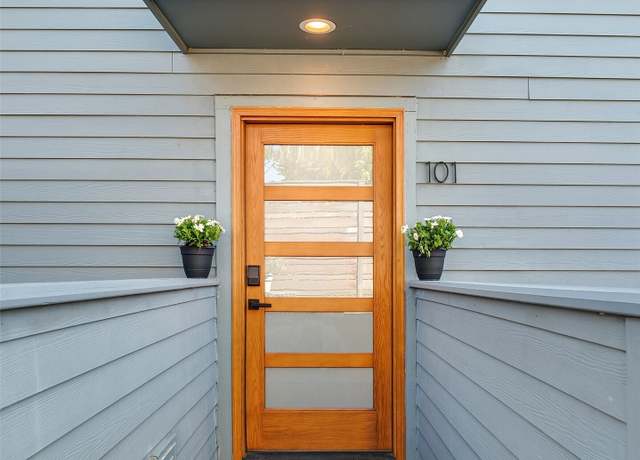 756 N 72nd St #101, Seattle, WA 98103
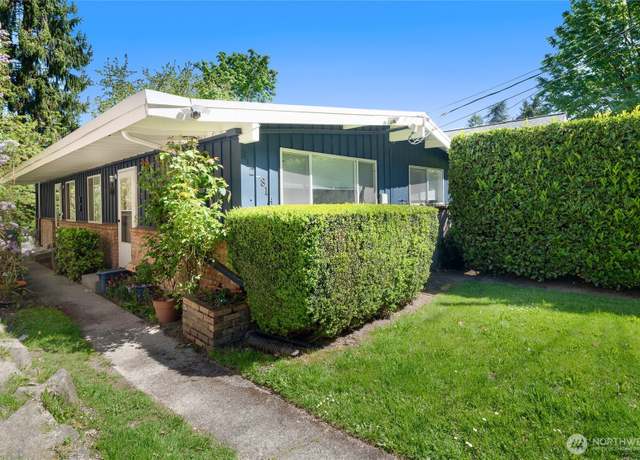 812 N 59th St, Seattle, WA 98103
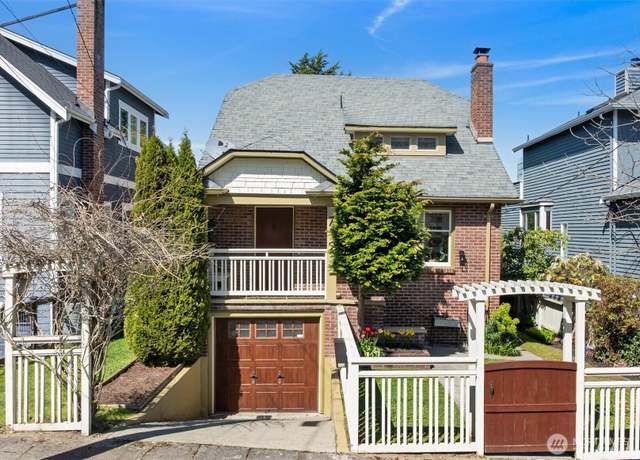 712 N 64th St, Seattle, WA 98103
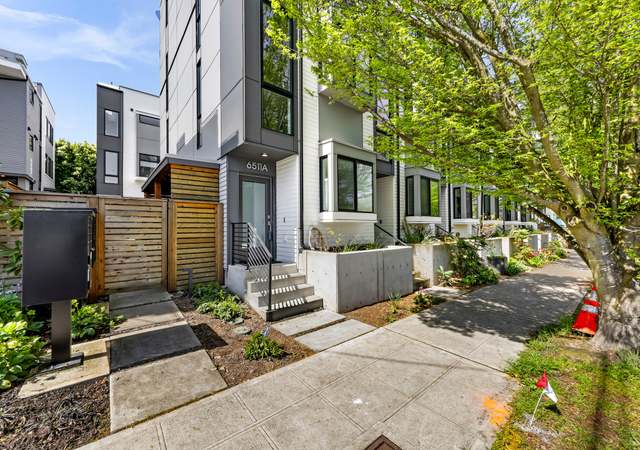 6511 Phinney Ave N Unit A, Seattle, WA 98103
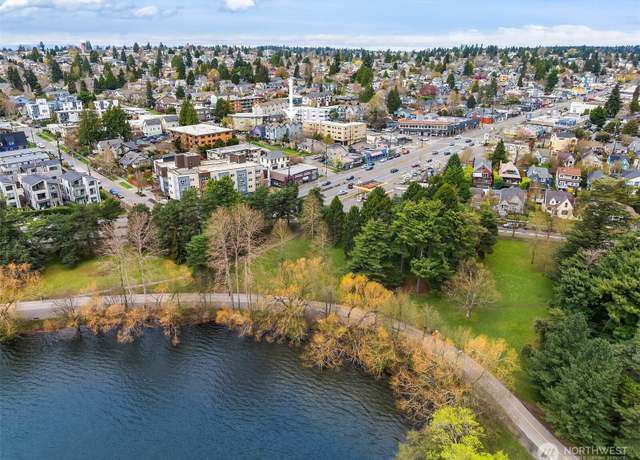 916 N 73rd St Unit A, Seattle, WA 98103
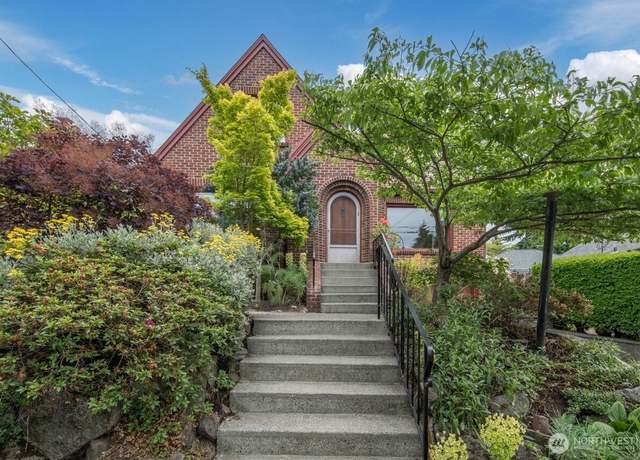 7310 10th Ave NW, Seattle, WA 98117
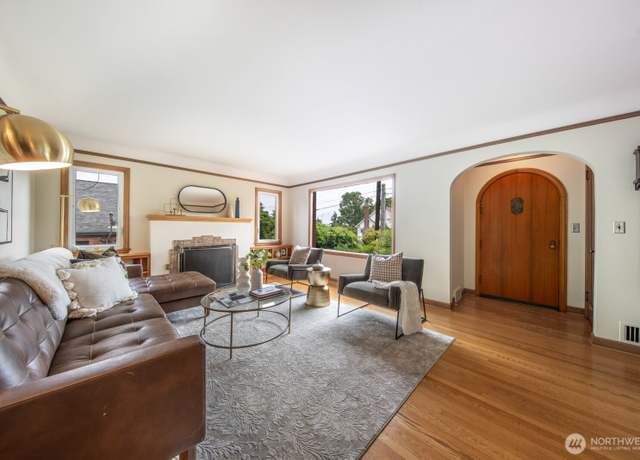 7310 10th Ave NW, Seattle, WA 98117
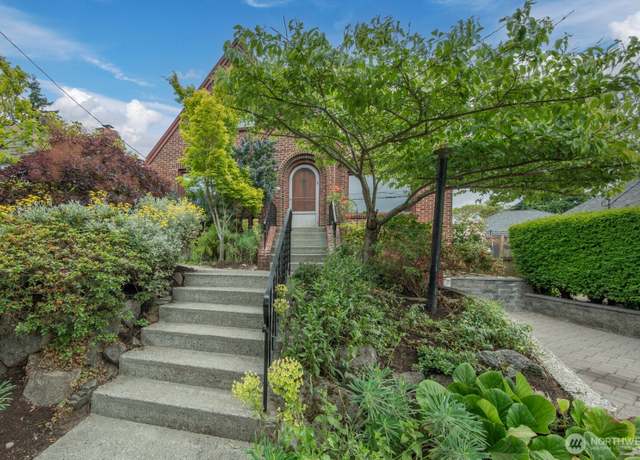 7310 10th Ave NW, Seattle, WA 98117
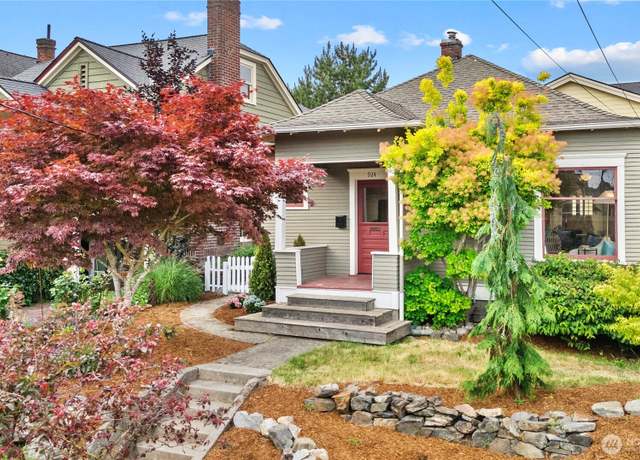 924 N 78th St Unit B, Seattle, WA 98103
 924 N 78th St Unit B, Seattle, WA 98103
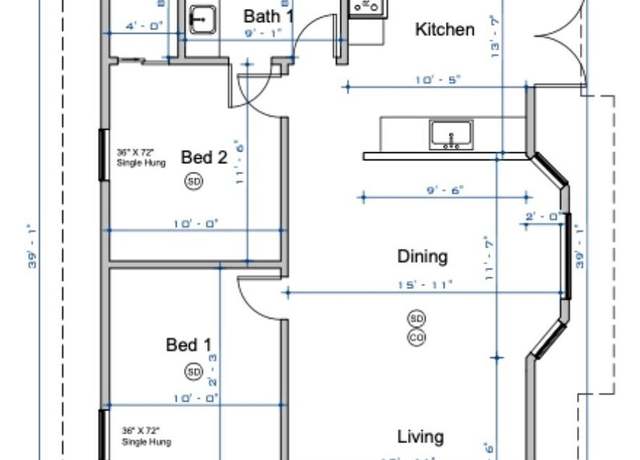 924 N 78th St Unit B, Seattle, WA 98103
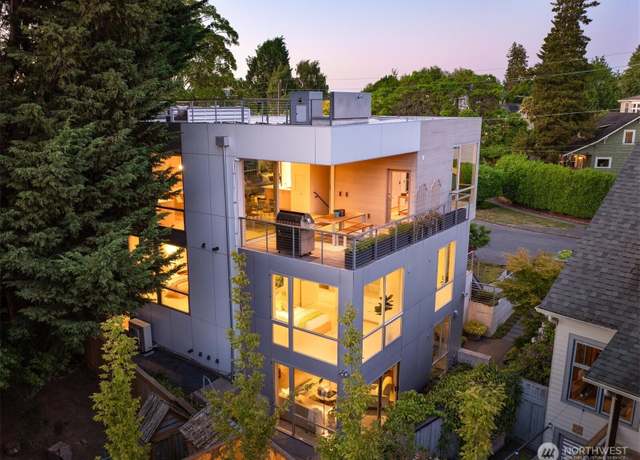 5567 Wallingford Ave N, Seattle, WA 98103
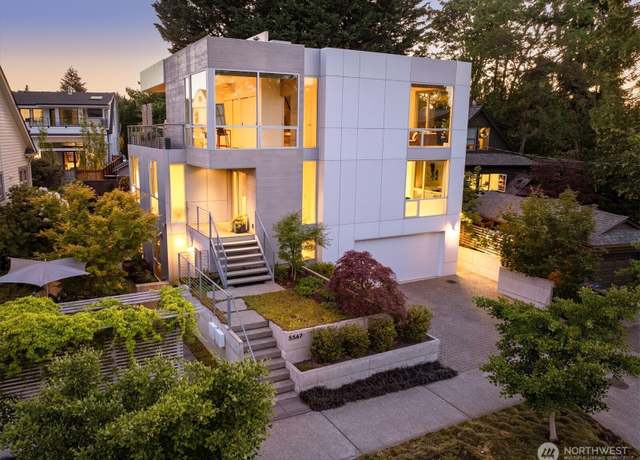 5567 Wallingford Ave N, Seattle, WA 98103
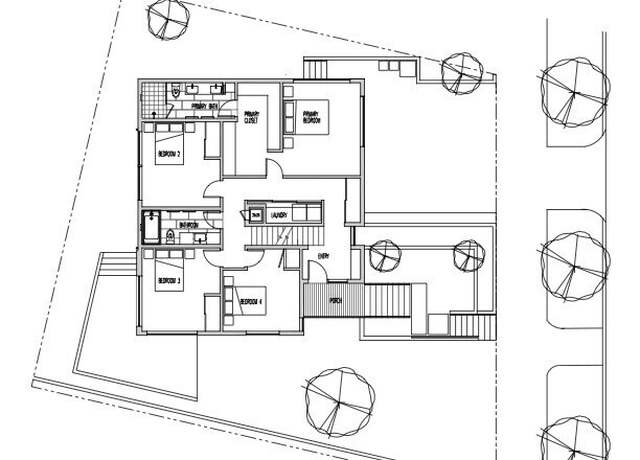 5567 Wallingford Ave N, Seattle, WA 98103
 7814 Greenwood Ave N #106, Seattle, WA 98103
 7814 Greenwood Ave N #106, Seattle, WA 98103
 7814 Greenwood Ave N #106, Seattle, WA 98103
 116 NW 78th St, Seattle, WA 98117
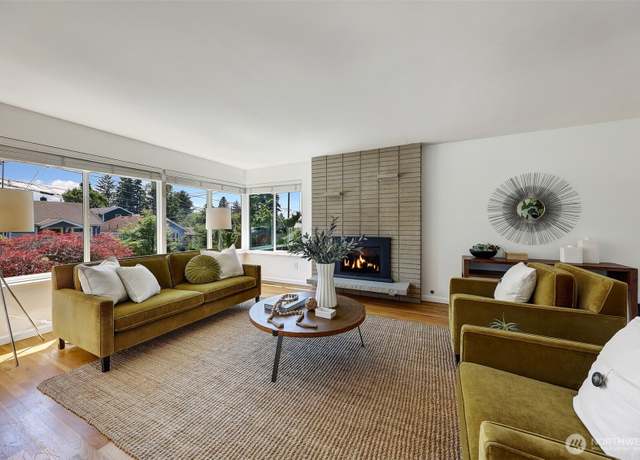 116 NW 78th St, Seattle, WA 98117
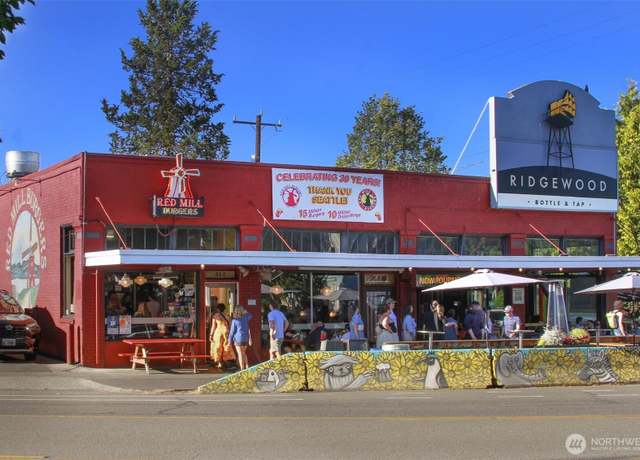 116 NW 78th St, Seattle, WA 98117
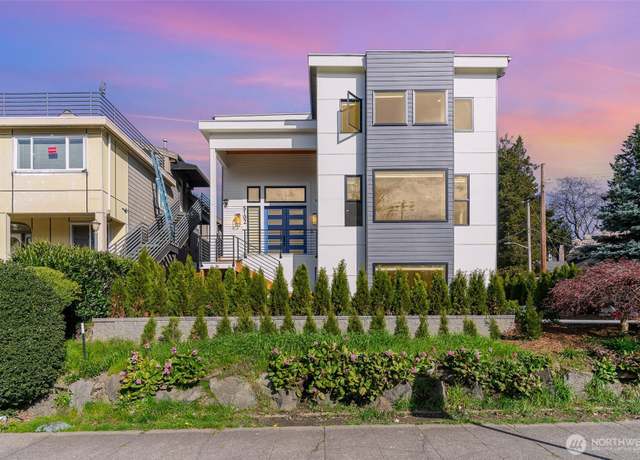 5102 Green Lake Way N, Seattle, WA 98103
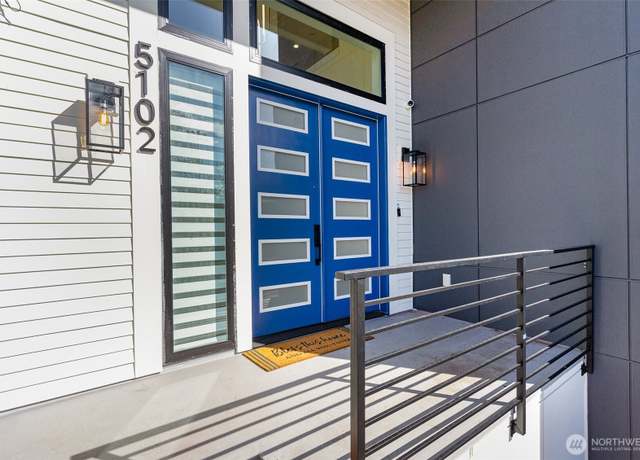 5102 Green Lake Way N, Seattle, WA 98103
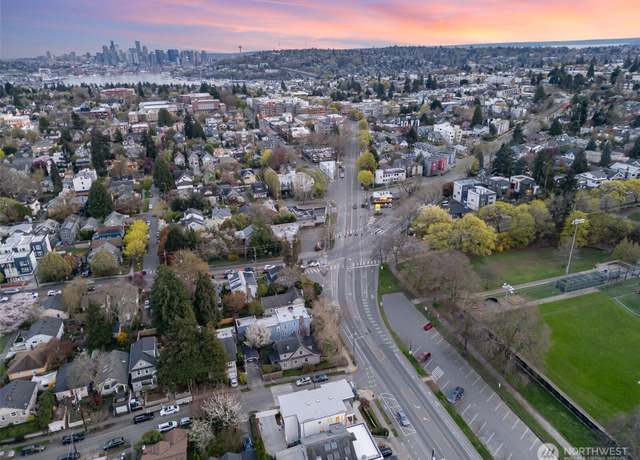 5102 Green Lake Way N, Seattle, WA 98103
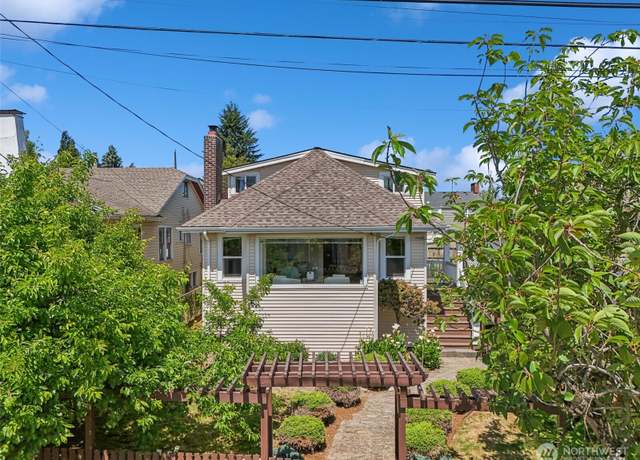 1316 N 77th St, Seattle, WA 98103
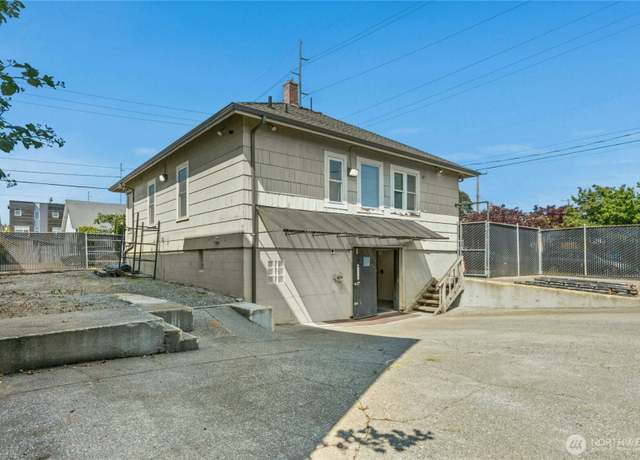 903 NW 50th St, Seattle, WA 98107
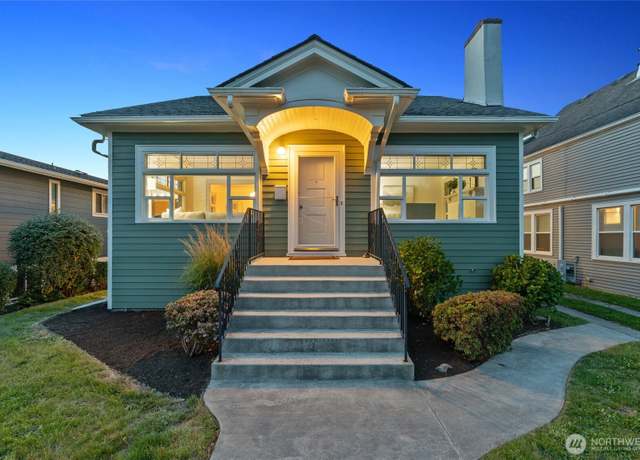 122 N 76th St, Seattle, WA 98103
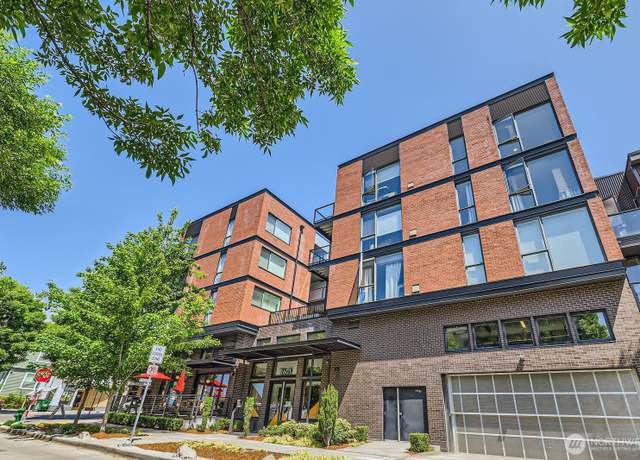 1601 N 45th St #411, Seattle, WA 98103
 916 NW 56th St Unit F, Seattle, WA 98107
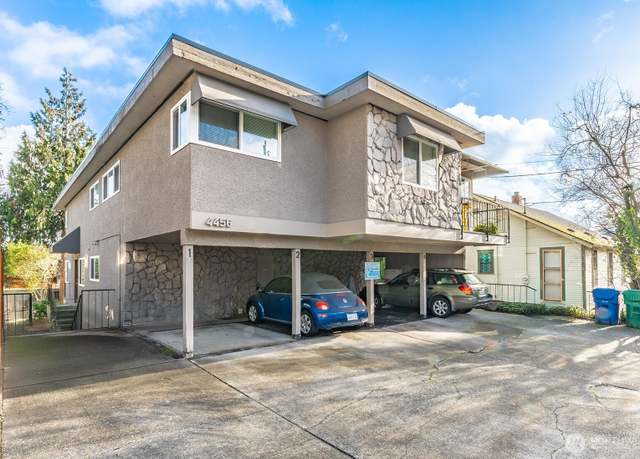 4456 Whitman Ave N, Seattle, WA 98103
 418 NW Market St, Seattle, WA 98107
 327 NW 52nd St, Seattle, WA 98107
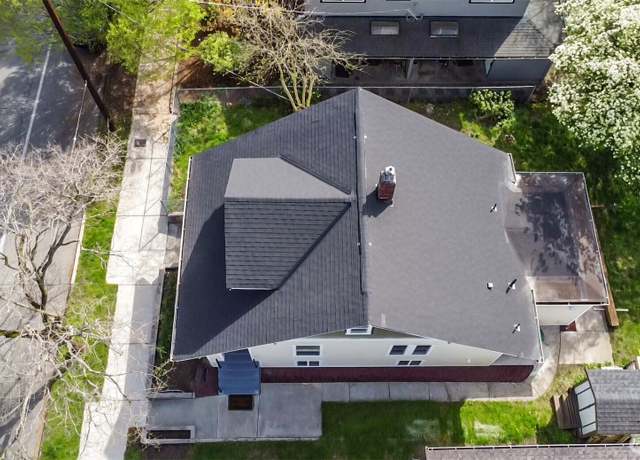 5909 8th Ave NW, Seattle, WA 98107
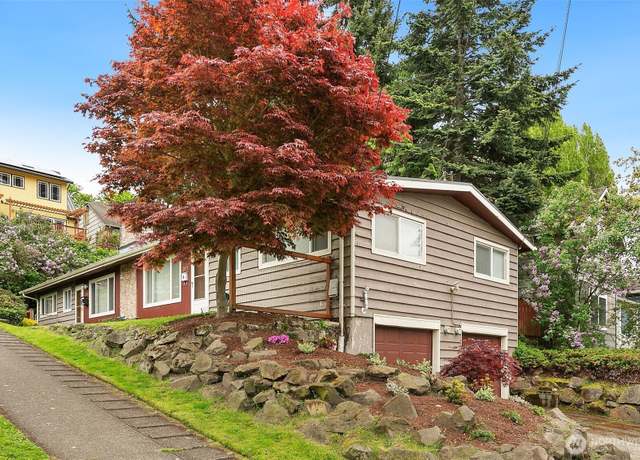 315 317 NW 58th St, Seattle, WA 98107
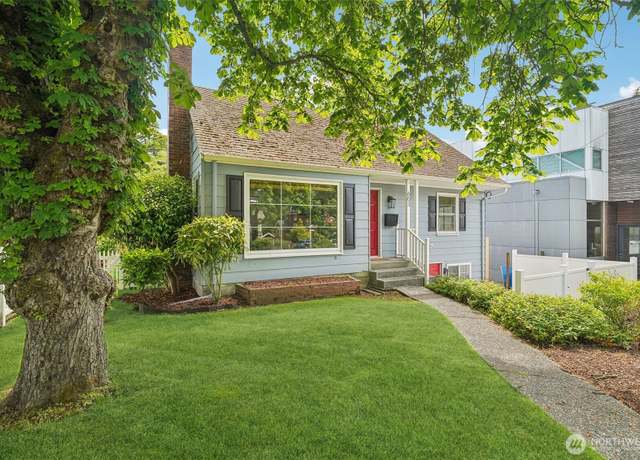 603 NW 52nd St, Seattle, WA 98107
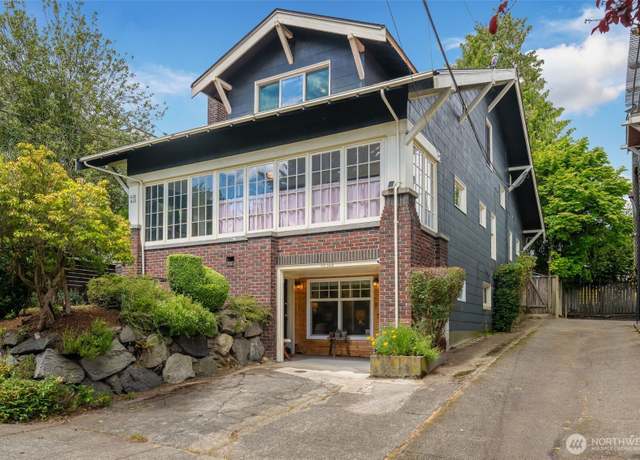 410 N 48th St, Seattle, WA 98103
 923 NW 56th St Unit B, Seattle, WA 98107
 1420 N 50th St, Seattle, WA 98103
- Median Sale Price
- # of Homes Sold
- Median Days on Market
Median Sale Price (All Home Types)
$1,287,500
+40.5% YoY | May 2025
- 1 year
- 3 year
- 5 year
Loading...

Based on information submitted to the MLS GRID as of Sat Jun 14 2025. All data is obtained from various sources and may not have been verified by broker or MLS GRID. Supplied Open House Information is subject to change without notice. All information should be independently reviewed and verified for accuracy. Properties may or may not be listed by the office/agent presenting the information. Some IDX listings have been excluded from this website.
About us
Find us
Subsidiaries
Copyright: © 2025 Redfin. All rights reserved.
Updated January 2023: By searching, you agree to the Terms of Use, and Privacy Policy.
Do not sell or share my personal information.
REDFIN and all REDFIN variants, TITLE FORWARD, WALK SCORE, and the R logos, are trademarks of Redfin Corporation, registered or pending in the USPTO.
California DRE #01521930
Redfin is licensed to do business in New York as Redfin Real Estate. NY Standard Operating Procedures
New Mexico Real Estate Licenses
TREC: Info About Brokerage Services, Consumer Protection Notice
If you are using a screen reader, or having trouble reading this website, please call Redfin Customer Support for help at 1-844-759-7732.
 REDFIN IS COMMITTED TO AND ABIDES BY THE FAIR HOUSING ACT AND EQUAL OPPORTUNITY ACT. READ REDFIN'S FAIR HOUSING POLICY AND THE NEW YORK STATE FAIR HOUSING NOTICE.
 United States
 Canada