
Remote work, the desire for privacy and record-low mortgage rates make single-family homes more desirable during the coronavirus pandemic. But condos could make a comeback if single-family home prices continue to surge.
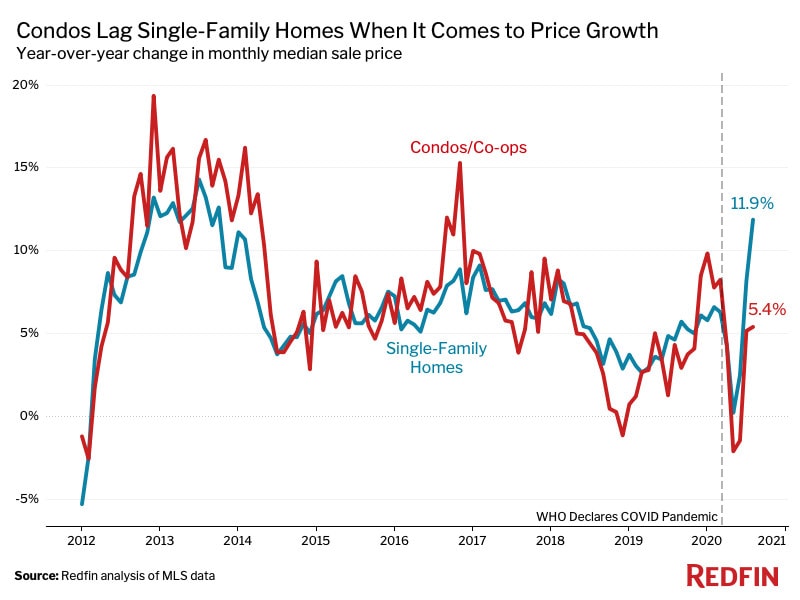
Condo sale prices in the U.S. increased 5.4% year over year to a median of $266,000 in August, trailing growth in single-family home prices, which surged 11.9% to $343,000. That’s the largest price-growth gap between the two property types since 2014.
About one in five condos (21.9%) sold for above the price at which it was listed, up slightly from 19.2% in August 2019. That compares with one of every three single-family homes (33.6%), up from 24.3% a year earlier and the highest share on record.
“Home prices have been growing across all property types, as record-low mortgage rates have suddenly equipped Americans with more buying power. But condos have experienced relatively modest price growth because the coronavirus pandemic has motivated many homebuyers to instead bid on single-family homes, which typically offer more space and privacy,” said Redfin lead economist Taylor Marr. “But if prices of single-family homes continue to surge to unsustainable levels, condos may make a comeback, as they could become the only type of home that buyers in some areas can afford while also avoiding intense bidding wars.”
Interest in single-family homes has already started to decline slightly; about a third (34%) of saved searches created by Redfin.com users filtered exclusively for single-family homes in September, down from a peak of 37% in July, indicating that living in a single-family home is becoming less of a priority for house hunters.
Market Summary, August 2020
| Condos | Single-Family Homes | |
|---|---|---|
| Median sale price | $266,000 | $343,000 |
| Median sale price, YoY change | 5.4% | 11.9% |
| Total homes for sale (AKA active listings), YoY change, seasonally adjusted | 3.6% | -26.0% |
| New listings, YoY change, seasonally adjusted | 18.4% | 1.8% |
| Homes sold, YoY change, seasonally adjusted | 11.8% | 10.8% |
| Median days on market | 36 | 30 |
| Share of homes that sold above list price | 21.9% | 33.6% |
| Share of homes with price drops | 14.5% | 12.8% |
Condo Supply Climbs, Single-Family Home Supply Plunges
Condos have seen relatively sluggish price growth, in part because they’re not as desirable among homebuyers during a pandemic, but also because the number of condos buyers have to choose from has been on the rise. The supply of condos for sale in the U.S. climbed 3.6% in August on a seasonally adjusted basis, while the number of single-family homes plummeted 26%.
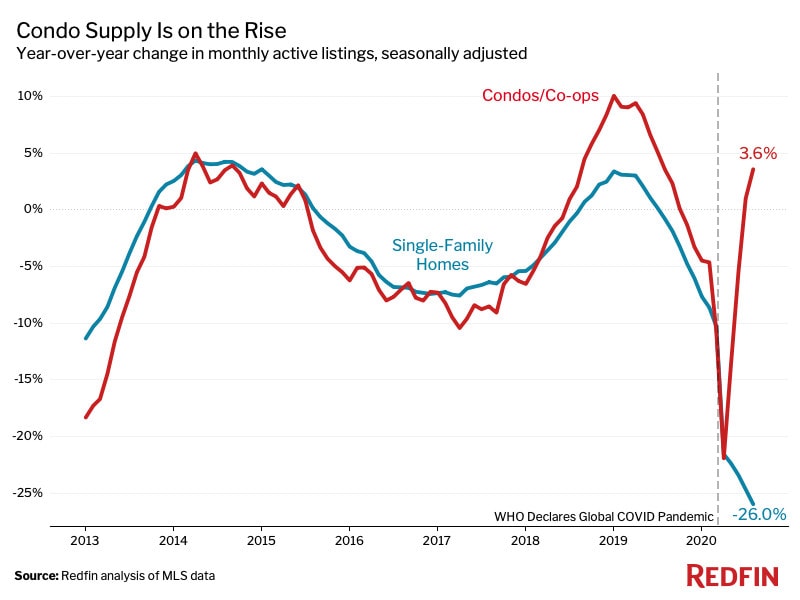
New listings of condos surged 18.4% year over year in August on a seasonally adjusted basis, the second-consecutive month of double-digit gains. That compares with an increase of just 1.8% in new listings of single-family homes, explaining the large gap in supply growth between the two property types in the chart above.
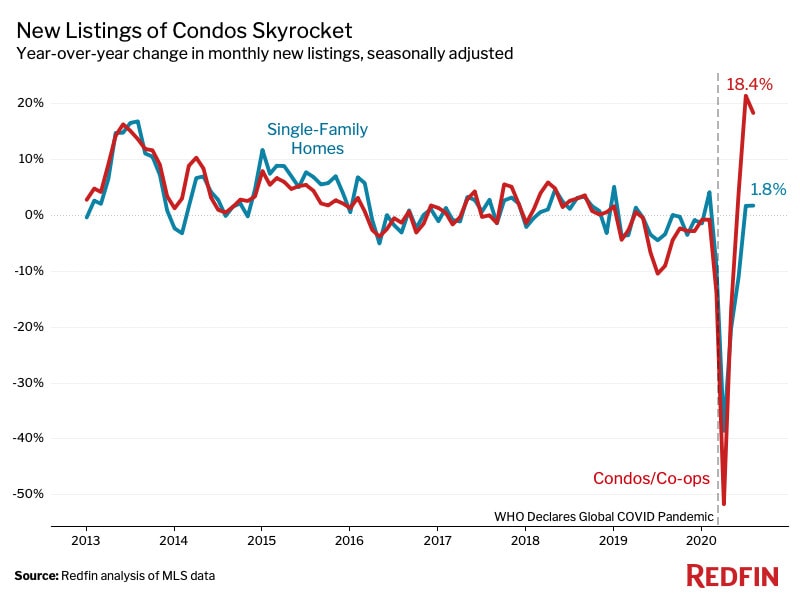
“Many Americans are putting their condos up for sale because they’re realizing that owning a single-family home is now possible for the first time, thanks to record-low mortgage rates and remote work,” Marr said. “Landlords have also been selling condos that they previously rented out because the rental market has been showing signs of weakness due to the coronavirus.”
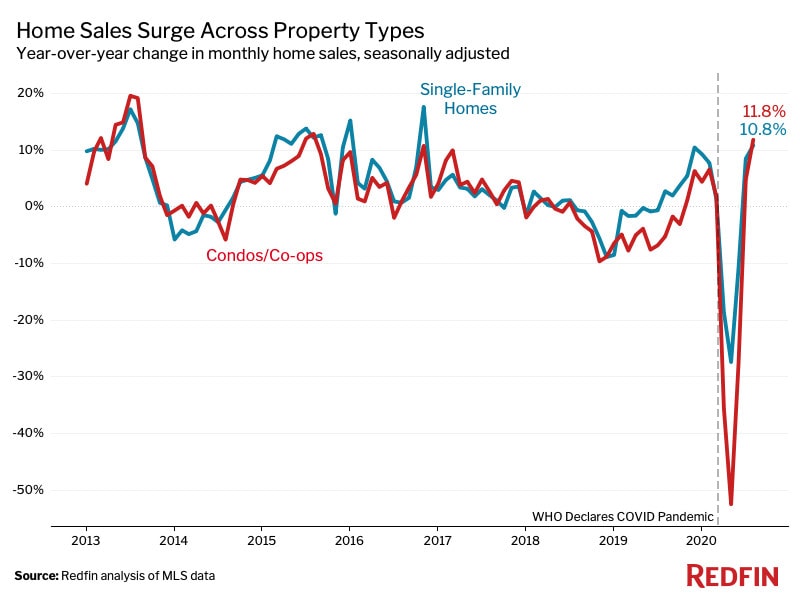
Condo Sales Are on the Rise, But Single-Family Homes Still Sell Faster and Attract More Bidding Wars
Condo sales climbed 11.8% in August on a seasonally adjusted basis, outpacing the 10.8% increase in sales of single-family homes and surpassing the pre-coronavirus (February) growth rate for the first time. One might expect to see stronger home sales in the single-family market given robust homebuyer demand, but the supply shortage has put a lid on how far single-family home sales can grow, according to Marr.
The typical condo was on the market for 36 days before going under contract in August, four days faster than a year earlier. Still, that trails the pace of the typical single-family home, which spent just 30 days on the market before going under contract—nine days faster than the prior year.
Nationwide, 40% condos went off the market within two weeks in August, up from 33.3% a year earlier. But single-family homes saw much higher growth, with 50.1% of properties going off the market within two weeks, up from 35.2% in August 2019.
These measures indicate that condos aren’t attracting as much competition as single-family homes; just 41.3% of condos faced bidding wars in August, compared with 56.6% of single-family homes.
“There’s high inventory, not much competition, and minimal buyer demand for condos right now,” said Seattle Redfin real estate agent Jessie Culbert Boucher. “Sellers are getting more flexible in terms of prices and realistic expectations, but it can take them a number of months to be willing to let things go for lower than they expected.”
Metro-Level Condo Highlights
To be included in the metro-level section, metro areas must have a population of at least 1.5 million and at least 100 condo sales in august. The New York metro area was excluded from this analysis due to limited data availability.
Prices
- The median sale price for condos increased year over year in 33 of the 42 markets included in this report.
- Pittsburgh saw the largest gain, with the median sale price for condos climbing 28% year over year to $230,000. Tampa, FL came in second place, up 18.5% to $160,000, followed by Washington, D.C., up 18.1% to $360,000.
- Philadelphia saw the biggest decline, with the median sale price for condos falling 9.3% year over year to $264,450. It was followed by Nashville, TN, down 5.9% to $296,450, and Las Vegas, down 3.8% to $154,000.
Supply
- The total number of condos for sale increased the most in San Francisco, with a 141.7% year-over-year gain. Rounding out the top three were Washington, D.C., up 39%, and Minneapolis, up 29.6%.
- Supply declined the most in St. Louis, falling 23.9% year over year, followed by San Diego, down 18.7%, and Providence, RI, down 18.4%.
New Listings
- New listings of condos rose the most in San Francisco, which experienced a 128.5% year-over-year surge. It was followed by New Brunswick, NJ, up 57.3%, and Seattle, up 52.1%.
- New listings only fell in seven of the metros analyzed in this report; the biggest declines were in St. Louis (-38.1%), Detroit (-12.5%) and San Diego (-4.9%).
Sales
- Condo sales increased the most in Virginia Beach, VA, which saw a 26% year-over-year increase. Indianapolis came in second place, up 24.6%, followed by Columbus, OH, up 16.6%.
- Nassau County, NY experienced the biggest decline, with condo sales sliding 47.2%. Next was Las Vegas, down 19.6%, followed by Orlando, FL, down 17.8%.
Below are market-by-market breakdowns for prices, supply, new listings and sales for markets with at least 100 condo sales in August. For downloadable data on all of the markets Redfin tracks, visit the Redfin Data Center.
Condo Median Sale Price, August 2020
| Redfin metro | Median sale price | Month over month | Year over year |
|---|---|---|---|
| Anaheim, CA | $513,000 | 1.6% | 9.1% |
| Atlanta, GA | $215,000 | 0.9% | 1.9% |
| Austin, TX | $295,000 | 0.3% | 5.4% |
| Baltimore, MD | $206,000 | 0.2% | 4.3% |
| Boston, MA | $502,000 | 0.6% | 2.7% |
| Chicago, IL | $230,000 | -6.1% | 3.4% |
| Cincinnati, OH | $145,000 | -13.4% | -3.3% |
| Cleveland, OH | $135,667 | 8.6% | 16.5% |
| Columbus, OH | $200,750 | 2.9% | 13.4% |
| Dallas, TX | $210,000 | 5.0% | 10.3% |
| Denver, CO | $279,600 | -3.3% | 3.7% |
| Detroit, MI | $165,000 | -2.0% | -1.5% |
| Fort Lauderdale, FL | $157,500 | 1.6% | 8.5% |
| Houston, TX | $133,000 | -11.0% | -1.5% |
| Indianapolis, IN | $169,900 | -2.9% | 9.3% |
| Las Vegas, NV | $154,000 | -8.3% | -3.8% |
| Los Angeles, CA | $529,000 | 1.2% | 9.8% |
| Miami, FL | $250,000 | 4.0% | 11.1% |
| Milwaukee, WI | $215,000 | 13.5% | 17.2% |
| Minneapolis, MN | $184,900 | 0.0% | 2.7% |
| Montgomery County, PA | $191,500 | -1.8% | 4.9% |
| Nashville, TN | $296,450 | -0.2% | -5.9% |
| Nassau County, NY | $320,000 | 0.0% | -1.5% |
| New Brunswick, NJ | $265,000 | 2.3% | 12.3% |
| Oakland, CA | $570,750 | 3.8% | 11.5% |
| Orlando, FL | $146,000 | 0.7% | 6.6% |
| Philadelphia, PA | $264,450 | -8.2% | -9.3% |
| Phoenix, AZ | $220,000 | 3.3% | 16.5% |
| Pittsburgh, PA | $230,000 | 24.3% | 28.0% |
| Portland, OR | $284,750 | 3.7% | 3.2% |
| Providence, RI | $250,000 | 4.2% | 9.2% |
| Riverside, CA | $319,250 | -1.8% | 8.2% |
| Sacramento, CA | $280,000 | 0.0% | 3.7% |
| San Diego, CA | $433,750 | 0.5% | -1.0% |
| San Francisco, CA | $1,085,000 | -3.2% | -1.4% |
| San Jose, CA | $713,500 | -1.6% | 2.1% |
| Seattle, WA | $395,000 | -2.9% | 6.8% |
| St. Louis, MO | $165,000 | -0.4% | 6.9% |
| Tampa, FL | $160,000 | 0.0% | 18.5% |
| Virginia Beach, VA | $223,000 | -0.4% | 14.5% |
| Warren, MI | $179,250 | 4.6% | 9.3% |
| Washington, D.C. | $360,000 | 2.7% | 18.1% |
Total Condos for Sale, August 2020
| Redfin metro | Number of active listings | Month over month | Year over year |
|---|---|---|---|
| Anaheim, CA | 2913 | -0.5% | -14.5% |
| Atlanta, GA | 2896 | 0.6% | 10.5% |
| Austin, TX | 1236 | -1.4% | 11.7% |
| Baltimore, MD | 898 | 1.4% | -4.1% |
| Boston, MA | 3969 | -2.3% | 20.6% |
| Chicago, IL | 12231 | 7.7% | 10.4% |
| Cincinnati, OH | 864 | -2.0% | -0.3% |
| Cleveland, OH | 910 | -0.1% | -16.4% |
| Columbus, OH | 1397 | -2.4% | 0.3% |
| Dallas, TX | 1659 | -1.7% | 0.9% |
| Denver, CO | 2492 | -4.1% | -1.2% |
| Detroit, MI | 916 | -4.2% | -1.8% |
| Fort Lauderdale, FL | 7652 | -1.2% | 3.3% |
| Houston, TX | 1649 | -0.5% | 0.9% |
| Indianapolis, IN | 627 | -1.7% | -1.7% |
| Las Vegas, NV | 2307 | 1.6% | -11.6% |
| Los Angeles, CA | 4847 | 5.1% | 9.8% |
| Miami, FL | 11152 | -1.3% | -2.8% |
| Milwaukee, WI | 1275 | 0.0% | 17.4% |
| Minneapolis, MN | 1483 | 4.0% | 29.6% |
| Montgomery County, PA | 395 | -4.1% | -6.2% |
| Nashville, TN | 915 | 1.1% | 22.0% |
| Nassau County, NY | 1634 | -1.9% | 5.2% |
| New Brunswick, NJ | 1803 | 0.2% | 1.9% |
| Oakland, CA | 1179 | 3.2% | 19.8% |
| Orlando, FL | 1900 | 0.2% | 19.2% |
| Philadelphia, PA | 1146 | 2.0% | 13.6% |
| Phoenix, AZ | 1988 | -3.3% | 0.9% |
| Pittsburgh, PA | 677 | 0.0% | 19.4% |
| Portland, OR | 1252 | 1.8% | -3.1% |
| Providence, RI | 904 | -4.1% | -18.4% |
| Riverside, CA | 2062 | -4.0% | -5.2% |
| Sacramento, CA | 623 | -6.7% | 2.3% |
| San Diego, CA | 2496 | -1.9% | -18.7% |
| San Francisco, CA | 2006 | 14.2% | 141.7% |
| San Jose, CA | 782 | 6.7% | 10.5% |
| Seattle, WA | 2261 | 9.2% | 16.1% |
| St. Louis, MO | 810 | -14.7% | -23.9% |
| Tampa, FL | 3034 | -4.1% | -1.0% |
| Virginia Beach, VA | 954 | 1.0% | -16.6% |
| Warren, MI | 2362 | -0.3% | -2.8% |
| Washington, D.C. | 3738 | 3.0% | 39.0% |
Condos New Listings, August 2020
| Redfin metro | Number of new listings | Month over month | Year over year |
|---|---|---|---|
| Anaheim, CA | 988 | -4.1% | 16.8% |
| Atlanta, GA | 915 | -1.0% | 6.8% |
| Austin, TX | 385 | -17.4% | 12.2% |
| Baltimore, MD | 331 | -0.6% | 18.2% |
| Boston, MA | 1365 | -16.1% | 44.8% |
| Chicago, IL | 4102 | -5.5% | 51.4% |
| Cincinnati, OH | 315 | 0.3% | 16.2% |
| Cleveland, OH | 346 | -11.1% | 3.6% |
| Columbus, OH | 510 | -11.0% | -0.8% |
| Dallas, TX | 403 | -14.6% | 1.0% |
| Denver, CO | 1026 | -13.9% | 1.0% |
| Detroit, MI | 314 | -10.3% | -12.5% |
| Fort Lauderdale, FL | 1420 | -4.8% | 1.7% |
| Houston, TX | 427 | -2.5% | 8.1% |
| Indianapolis, IN | 281 | 4.5% | 3.3% |
| Las Vegas, NV | 611 | 2.9% | -2.6% |
| Los Angeles, CA | 1607 | 0.7% | 30.3% |
| Miami, FL | 1701 | -8.5% | -0.9% |
| Milwaukee, WI | 414 | 0.2% | 15.3% |
| Minneapolis, MN | 528 | -7.7% | 17.6% |
| Montgomery County, PA | 132 | -5.7% | -1.5% |
| Nashville, TN | 246 | -2.8% | 31.6% |
| Nassau County, NY | 484 | -13.7% | 29.8% |
| New Brunswick, NJ | 659 | -5.6% | 57.3% |
| Oakland, CA | 490 | -2.8% | 25.3% |
| Orlando, FL | 561 | -7.3% | 13.6% |
| Philadelphia, PA | 284 | -16.7% | 21.9% |
| Phoenix, AZ | 784 | 5.5% | 14.6% |
| Pittsburgh, PA | 145 | -16.2% | 14.2% |
| Portland, OR | 422 | -15.9% | 4.5% |
| Providence, RI | 295 | -12.5% | 0.7% |
| Riverside, CA | 621 | -1.0% | 14.2% |
| Sacramento, CA | 238 | -10.5% | 3.0% |
| San Diego, CA | 1064 | -8.2% | -4.9% |
| San Francisco, CA | 674 | -4.9% | 128.5% |
| San Jose, CA | 287 | -4.7% | 22.6% |
| Seattle, WA | 1031 | 0.1% | 52.1% |
| St. Louis, MO | 224 | -42.7% | -38.1% |
| Tampa, FL | 1009 | -0.2% | 16.8% |
| Virginia Beach, VA | 359 | -4.8% | 21.7% |
| Warren, MI | 968 | 0.6% | 11.1% |
| Washington, D.C. | 1475 | -9.0% | 50.5% |
Condos Sold, August 2020
| Redfin metro | Number of condos sold | Month over month | Year over year |
|---|---|---|---|
| Anaheim, CA | 859 | 6.7% | 7.1% |
| Atlanta, GA | 745 | 0.8% | 16.4% |
| Austin, TX | 314 | -9.5% | -2.2% |
| Baltimore, MD | 262 | -16.6% | -3.3% |
| Boston, MA | 1114 | -4.9% | -5.9% |
| Chicago, IL | 2677 | 2.8% | 7.8% |
| Cincinnati, OH | 292 | -7.3% | 3.9% |
| Cleveland, OH | 305 | -1.0% | -7.0% |
| Columbus, OH | 513 | 4.5% | 16.6% |
| Dallas, TX | 271 | -19.6% | -1.1% |
| Denver, CO | 943 | -6.6% | 9.3% |
| Detroit, MI | 251 | -9.1% | -0.4% |
| Fort Lauderdale, FL | 1024 | 1.9% | -11.1% |
| Houston, TX | 271 | -16.9% | -3.9% |
| Indianapolis, IN | 284 | 5.2% | 24.6% |
| Las Vegas, NV | 414 | -1.7% | -19.6% |
| Los Angeles, CA | 1025 | 6.8% | -0.1% |
| Miami, FL | 919 | -4.5% | -9.2% |
| Milwaukee, WI | 386 | 0.8% | 11.2% |
| Minneapolis, MN | 417 | -0.2% | -9.3% |
| Montgomery County, PA | 121 | -12.9% | -3.2% |
| Nashville, TN | 186 | -0.5% | -7.0% |
| Nassau County, NY | 219 | 10.6% | -47.2% |
| New Brunswick, NJ | 450 | 22.6% | -3.2% |
| Oakland, CA | 369 | -2.6% | 8.5% |
| Orlando, FL | 382 | -12.6% | -17.8% |
| Philadelphia, PA | 174 | 9.4% | -13.9% |
| Phoenix, AZ | 622 | -16.3% | 11.9% |
| Pittsburgh, PA | 110 | -16.7% | -6.8% |
| Portland, OR | 320 | -17.1% | -7.5% |
| Providence, RI | 227 | -10.6% | -16.8% |
| Riverside, CA | 598 | -1.3% | 14.6% |
| Sacramento, CA | 236 | 4.0% | 4.4% |
| San Diego, CA | 899 | -3.1% | -6.1% |
| San Francisco, CA | 305 | -9.8% | 6.3% |
| San Jose, CA | 186 | -13.5% | -0.5% |
| Seattle, WA | 728 | 3.6% | 10.3% |
| St. Louis, MO | 372 | -8.4% | 7.8% |
| Tampa, FL | 942 | -7.4% | 9.9% |
| Virginia Beach, VA | 334 | -3.2% | 26.0% |
| Warren, MI | 846 | -1.2% | 7.8% |
| Washington, D.C. | 1196 | 6.3% | 10.3% |


