- Homebuying affordability improved slightly in April because mortgage rates declined while incomes rose. Still, the income required to afford a home was $29,000 higher than the typical U.S. income–and mortgage rates rose again in May, potentially erasing some of the affordability gains made in April.
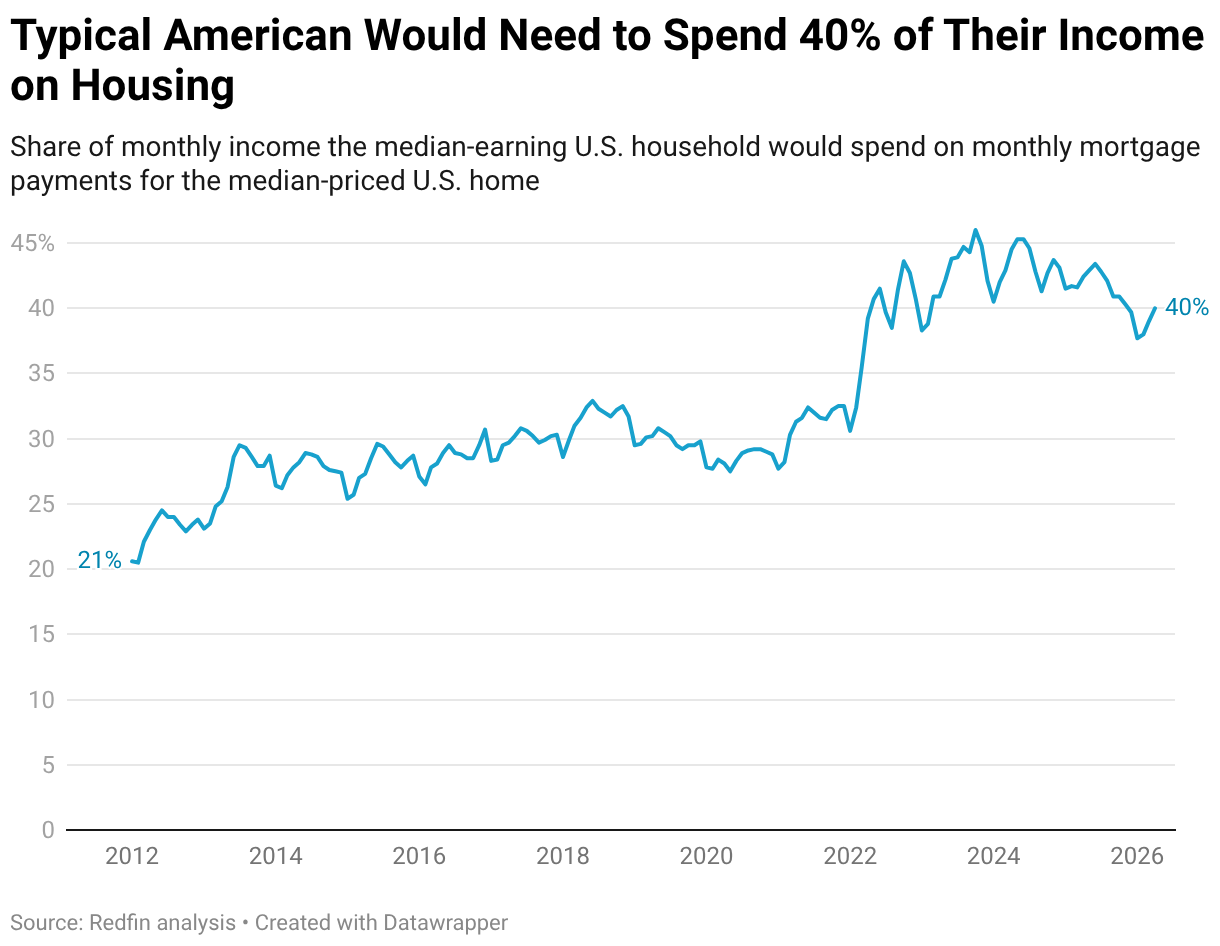
- A household earning the average U.S. income would need to spend 40% of their income on the median-priced home, down from 42% a year ago.
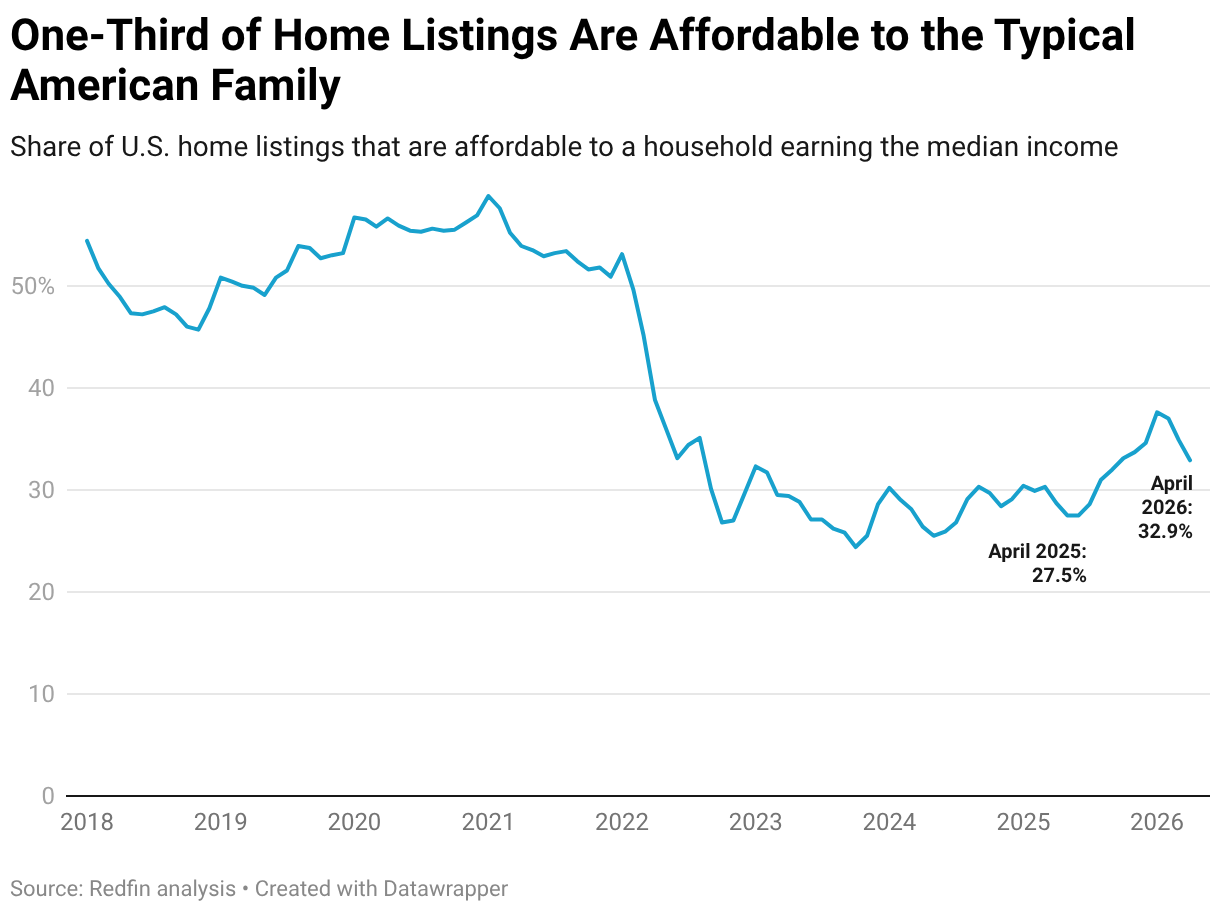
- 33% of home listings are affordable, up from 29% a year ago–but down from more than half five years ago.
- Buying a home is getting more affordable in 34 of the 50 most populous U.S. metros, led by Chicago, Oakland and Dallas.
Americans needed to earn $116,780 to afford the typical U.S. home for sale in April, down 2% from $119,191 a year earlier. That marks the seventh straight month in which buying a home became more affordable on a year-over-year basis. The income needed to afford a home peaked at $122,000 in mid-2025.
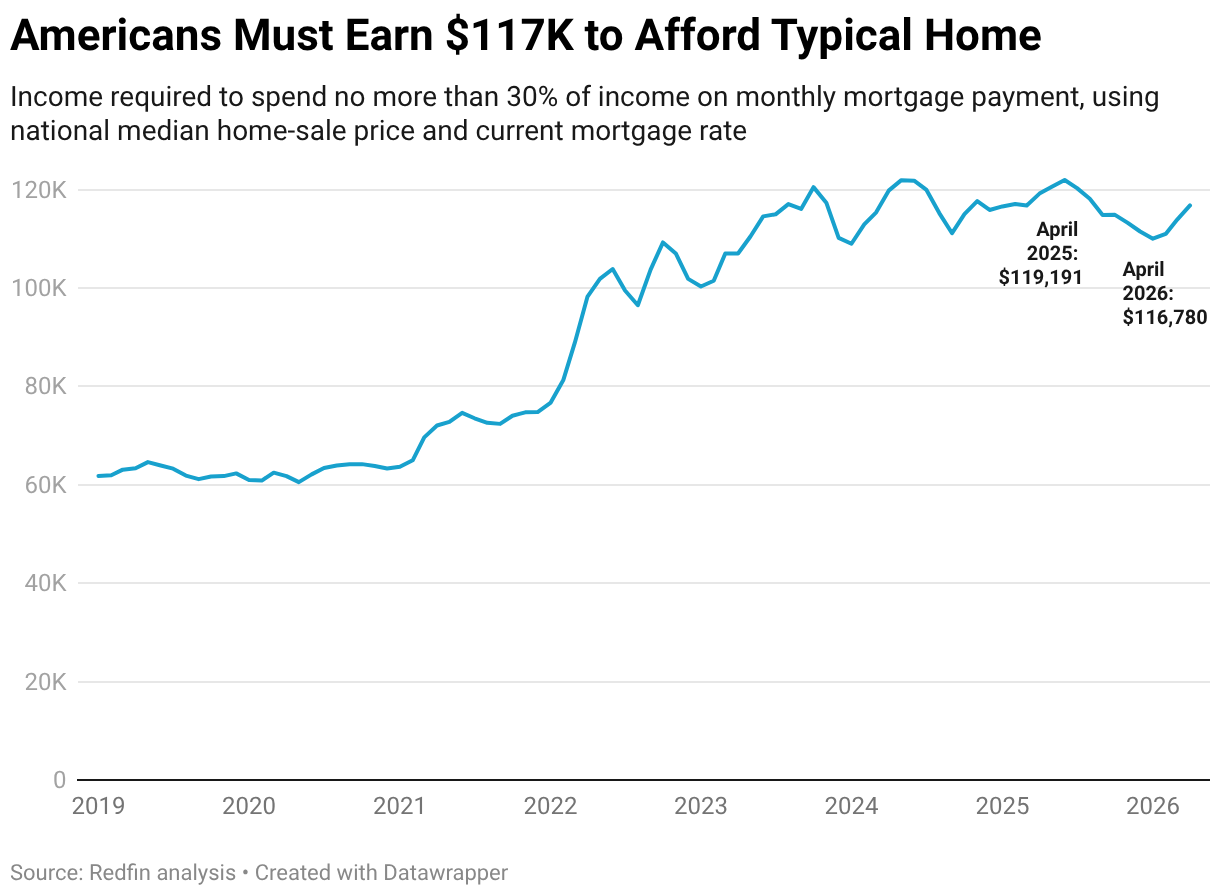
We consider a home affordable if a buyer taking out a mortgage would spend no more than 30% of their income on their monthly housing payment. This is based on a Redfin analysis of median home sale prices, prevailing mortgage rates and property-tax payments, and assumes a 15% down payment. This report focuses on April 2026—the most recent period for which data is available.
Homebuying affordability improved because monthly housing costs are decreasing while incomes are increasing:
- Housing costs came down in April because the average 30-year fixed rate was lower than a year earlier; April’s monthly average was 6.33%, down from 6.73%.
- The estimated median household income was $87,599, up 4% year over year.
Still, the median home-sale price rose 2.4% year over year in April, which is why affordability is improving only slightly. Note that mortgage rates jumped in May, with the weekly average hitting 6.51%. Because of that increase, house hunters locking in a rate now may not find the market more affordable than a year ago.
The income required to afford a home soared in 2022 and 2023: Home prices skyrocketed amid the pandemic homebuying frenzy, then mortgage rates doubled. Now, the tide is slowly turning, with the income needed to afford a home consistently dropping since October 2025. Still, it’s about $29,000 higher than the typical U.S. household income of roughly $88,000.
“Americans still need a six-figure income to afford a regular home, but it’s encouraging that affordability is gradually improving,” said Redfin Economist Grishma Bhattarai. “House hunters who have been waiting on the sidelines may want to start paying close attention: In addition to costs coming down, there are still more homes on the market than there were a year ago, many more sellers than buyers, and more room for buyers to negotiate. Buyers are starting to notice: Pending home sales jumped in early May, which may lead to more bidding wars and bigger price increases.”
Redfin economists expect housing affordability to continue to improve slightly throughout this year. But that could be derailed if the Iran war continues pushing up oil prices, the Fed hikes interest rates or the economy experiences another shock.
Housing Costs Are Consuming a Smaller Share of Buyers’ Budgets
While a common rule of thumb in housing is that you should spend no more than 30% of your income on your monthly housing payment, that isn’t realistic for everyone.
The typical American homebuyer would need to spend 40% of their income to buy the median-priced U.S. home. But the good news is that’s down from 42.4% a year ago.
33% of Home Listings Are Affordable, Up From 28% Last Year
To look at improving affordability one more way, the share of home listings that are affordable–i.e. they would require no more than 30% of income spent on housing–has increased over the last year.
One-third (32.9%) of U.S. home listings were affordable to someone earning the median income in April, up from 28.7% a year earlier.
Still, there are far fewer affordable home listings than there used to be. Before mortgage rates shot up in 2022, more than half of U.S. home listings were affordable to the typical American nearly every single month in records dating back through 2013.
Homebuying Is Getting More Affordable in Most Major Metros, Led By Chicago
Homebuying affordability is improving in 35 of the 50 most populous U.S. metro areas.
In Chicago, homebuyers needed to earn $101,075 to afford the median-priced home in April, down 13.3% year over year–the biggest decline of the 50 most populous U.S. metros. San Jose, CA had the second-biggest improvement in affordability: Buyers there must earn $426,318, down 5.6% year over year. Seattle, where buyers must earn $219,313, down 5.5%, rounds out the top three.
There are nine metros–all in the eastern half of the U.S.–where the typical household earns more than what’s required to afford a home: Baltimore, Cincinnati, Cleveland, Detroit, Indianapolis, Minneapolis, Pittsburgh, St. Louis and Warren, MI.
Buying a Home Is Getting Less Affordable in San Francisco and Other Seller’s Markets
San Francisco homebuyers needed an income of $443,979 to afford the median-priced local home in April, up 7% year over year–the highest income required and the biggest increase of the metros Redfin analyzed. That’s because San Francisco home prices are shooting up, partly due to the AI boom.
The next biggest increases were in Philadelphia (5.7% to $85,541) and Providence, RI (4.7% to $143,195). Providence is one of just seven seller’s markets in the U.S.
| Metro-Level Summary: Income Needed to Afford a Home, April 2026
We analyzed the 50 most populous U.S. CSBAs and included the 49 with sufficient data |
|||||
| U.S. metro area | Income required to afford a home | Income required to afford a home, YoY change | Estimated median household income | Share of income required to afford a home | Share of listings affordable to median-earning household |
| Anaheim, CA | $319,840 | 0.7% | $126,178 | 76.0% | 4.8% |
| Atlanta, GA | $107,113 | -3.0% | $98,778 | 32.5% | 37.5% |
| Austin, TX | $133,390 | -4.2% | $109,059 | 36.7% | 23.4% |
| Baltimore, MD | $108,416 | -1.7% | $112,328 | 29.0% | 55.5% |
| Boston, MA | $207,511 | -0.8% | $127,467 | 48.8% | 10.1% |
| Charlotte, NC | $106,449 | -2.2% | $91,545 | 34.9% | 32.2% |
| Chicago, IL | $101,075 | -13.3% | $98,502 | 30.8% | 48.2% |
| Cincinnati, OH | $85,615 | 3.0% | $89,002 | 28.9% | 49.2% |
| Cleveland, OH | $73,261 | 3.6% | $78,519 | 28.0% | 56.9% |
| Columbus, OH | $99,787 | 3.4% | $91,468 | 32.7% | 41.6% |
| Dallas, TX | $122,952 | -4.9% | $103,144 | 35.8% | 25.5% |
| Denver, CO | $155,507 | -2.4% | $116,323 | 40.1% | 27.6% |
| Detroit, MI | $56,219 | -0.5% | $65,687 | 25.7% | 71.3% |
| Fort Worth, TX | $107,260 | -2.9% | $93,102 | 34.6% | 24.6% |
| Houston, TX | $101,964 | -2.9% | $90,865 | 33.7% | 30.1% |
| Indianapolis, IN | $86,460 | 0.8% | $90,927 | 28.5% | 52.8% |
| Jacksonville, FL | $100,799 | -2.0% | $88,715 | 34.1% | 34.2% |
| Kansas City, MO | $95,583 | 3.9% | $92,718 | 30.9% | 43.5% |
| Las Vegas, NV | $111,556 | -5.0% | $82,975 | 40.3% | 18.8% |
| Los Angeles, CA | $242,495 | -0.8% | $97,775 | 74.4% | 1.2% |
| Miami, FL | $154,477 | -4.3% | $77,854 | 59.5% | 11.1% |
| Milwaukee, WI | $98,226 | -1.1% | $86,909 | 33.9% | 42.0% |
| Minneapolis, MN | $107,835 | -4.1% | $108,714 | 29.8% | 46.5% |
| Montgomery County, PA | $142,081 | 0.0% | $127,721 | 33.4% | 36.2% |
| Nashville, TN | $120,317 | -1.7% | $96,448 | 37.4% | 22.6% |
| Nassau County, NY | $214,059 | 0.5% | $149,811 | 42.9% | 11.2% |
| New Brunswick, NJ | $162,669 | -2.3% | $122,960 | 39.7% | 21.4% |
| New York, NY | $219,485 | -0.6% | $98,287 | 67.0% | 7.8% |
| Newark, NJ | $183,219 | -4.2% | $113,773 | 48.3% | 12.4% |
| Oakland, CA | $251,591 | -3.2% | $139,407 | 54.1% | 11.8% |
| Orlando, FL | $111,110 | -1.8% | $85,400 | 39.0% | 21.9% |
| Philadelphia, PA | $85,541 | 5.7% | $75,254 | 34.1% | 47.3% |
| Phoenix, AZ | $115,538 | -2.4% | $95,979 | 36.1% | 25.6% |
| Pittsburgh, PA | $73,411 | 2.7% | $83,419 | 26.4% | 59.2% |
| Portland, OR | $149,369 | -3.3% | $105,952 | 42.3% | 16.3% |
| Providence, RI | $143,195 | 4.7% | $94,620 | 45.4% | 8.9% |
| Riverside, CA | $155,689 | -3.8% | $97,116 | 48.1% | 9.9% |
| Sacramento, CA | $155,362 | -3.6% | $105,873 | 44.0% | 10.0% |
| San Antonio, TX | $90,573 | -4.2% | $83,650 | 32.5% | 36.4% |
| San Diego, CA | $242,657 | -1.7% | $115,304 | 63.1% | 4.8% |
| San Francisco, CA | $443,979 | 7.0% | $162,118 | 82.2% | 5.9% |
| San Jose, CA | $426,318 | -5.6% | $176,401 | 72.5% | 7.0% |
| Seattle, WA | $219,313 | -5.5% | $131,404 | 50.1% | 13.8% |
| St. Louis, MO | $77,743 | 1.4% | $88,593 | 26.3% | 60.0% |
| Tampa, FL | $102,854 | -0.3% | $81,390 | 37.9% | 25.2% |
| Virginia Beach, VA | $99,780 | 2.1% | $91,854 | 32.6% | 33.9% |
| Warren, MI | $86,880 | -3.8% | $96,676 | 27.0% | 54.3% |
| Washington, DC | $163,491 | -1.3% | $141,029 | 34.8% | 41.6% |
| West Palm Beach, FL | $140,739 | -2.6% | $90,688 | 46.6% | 29.9% |