If you are interested in a snapshot of the numbers for the Orange County housing market, see another one of my post for today, OC Housing—In the News and By the Numbers.

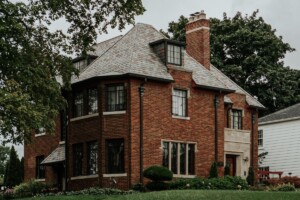
For now, the time to check the Irvine housing numbers is here. And here are two interesting ones that I saw on Trulia: Average listing price in Irvine for May-July 2007 was $981,298; however, the average sales price in Irvine for May-July 2007 was $806,224. A strong dose of reality might be in store for some Irvine home sellers.
And with the increasing number of foreclosures in Irvine, some unfortunate souls or over-eager flippers have apparently already had a dose of this reality: 102 in the second quarter of 2007 vs 42 in the second quarter of 2006 (source: First American CoreLogic, Orange County Register).
Now the charts:
 Median Home Price Trends Conditions seem to be changing rapidly, so watching how the Irvine home sellers adjust their pricing will be interesting.
 Market Action Index This index is a measure of how the real estate supply is balancing with the demand. Above 30 is a seller’s market. Below 30 is a buyer’s market. Looks like a buyer’s market to me.
 Days On Market Days on market are going up.
 Price Per Square Foot According to Trulia, Irvine’s average is $419.
 Inventory If inventory increases as demand falls, the Market Action Index will drop, and prices will have to follow downward.


 United States
 Canada