
Data analysis by Troy Martin
America’s fastest-growing cities are no longer along the coasts. Rather, domestic migration has shifted such that the highest population growth is in inland cities that have both strong job growth AND affordably priced homes. Examples of these affordable high-growth cities include Austin, Houston and Oklahoma City.
In the New York Times article, “Affordable Housing Draws Middle Class to Inland Cities” Shaila Dewan cited Redfin data and analysis to conclude that: “The country’s fastest-growing cities are now those where housing is more affordable than average, a decisive reversal from the early years of the millennium, when easy credit allowed cities to grow without regard to housing cost and when the fastest-growing cities had housing that was less affordable than the national average.”
To help uncover this new trend in domestic migration to more affordably priced cities, Redfin examined metropolitan areas with populations of more than 500,000 people. These metropolitan divisions were analyzed based on job growth and affordability. Here’s the data behind the story that explains why cities grow, and how it’s different now than in the past.
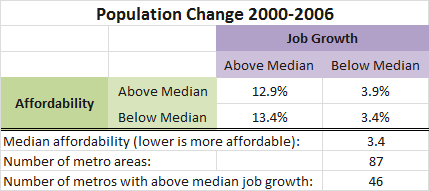
From 2000 to 2006, the period preceding the Great Recession, median job growth across the metro areas was 4.7 percent, compared with a median decline in the latter half of the decade (2006-2012) of 2.4 percent. In terms of affordability, median home values were 3.4 times and 4 times median household incomes for these areas for the early and late time periods, respectively. For the purpose of this analysis, cities with ratios of house price to income below the median for all metro areas are considered more affordable.
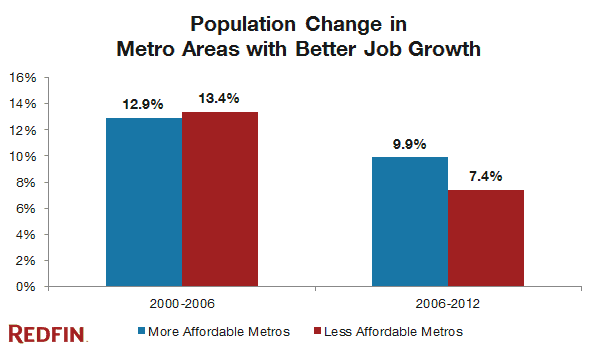
Between 2000 and 2006, job growth marginally outweighed affordability in terms of population increase. Metros that were less affordable but with strong job growth saw population increase 0.5 percentage points more (13.4% vs. 12.9%) than metros that were more affordable. But in the 2006-2012 period, affordability played a more influential role. Metros that were more affordable than the national average and had strong job growth grew 2.5 percentage points more (9.9% vs. 7.4%) than less affordable metros with job growth above the median.
Comparison of the Fastest Cities
In the table below, we exclude growth in 2006-2007, when the housing market transitioned from home value growth to decline nationally. The relationship identified above still holds: Affordable metros with strong job growth grew 2 percentage points more (6.6% vs. 4.6%) than less affordable metros with above median job growth.
We use this truncated time period to compare changes in home values with the 2000-2006 time period.
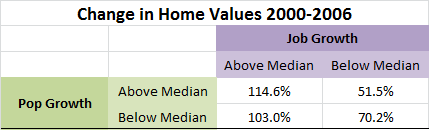
The average increase in home values in areas with both high job growth and high population growth was 114.6 percent from 2000 to 2006. This contrasts sharply with a 51 percent increase in median home values for cities characterized by high population growth but low job growth. In the 2008-2012 period, high job and population growth metros saw home values decrease less than other metros. This result underscores the importance of job creation to stable housing markets over the long term. Places with high population growth but low job growth saw home values tumble the most, by an average of 26 percent.

2013’s Fastest Growing Cities
Below are estimates of population changes for 2012-2013 from the U.S. Census. Fifteen of the fastest growing metros in 2013 were more affordable than the national average from 2006 to 2012.
The influence of affordability on domestic migration is a long-term consequence of the housing boom and bust. People aren’t just moving to where the jobs are; it now matters how much homes costs when they get there. Affordability continues to play an important role in a choice to move from one city to another. Because of this, cities in the middle of the country will continue to be among the nation’s fastest growth areas.
![]()
To download the full spreadsheet of data comparing job growth, affordability and population changes click here.


