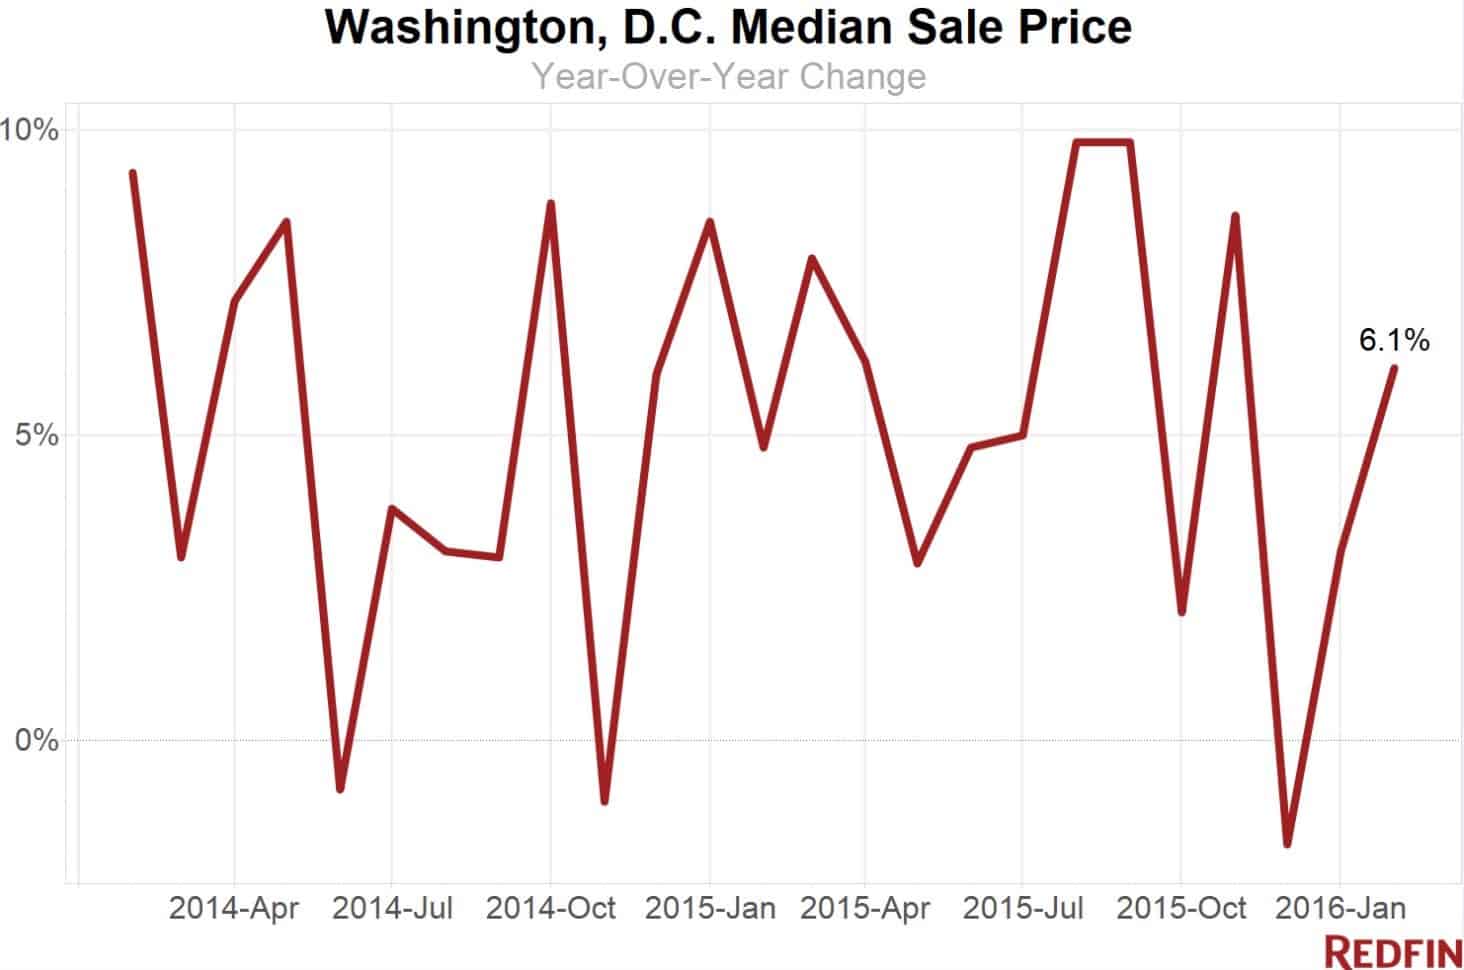
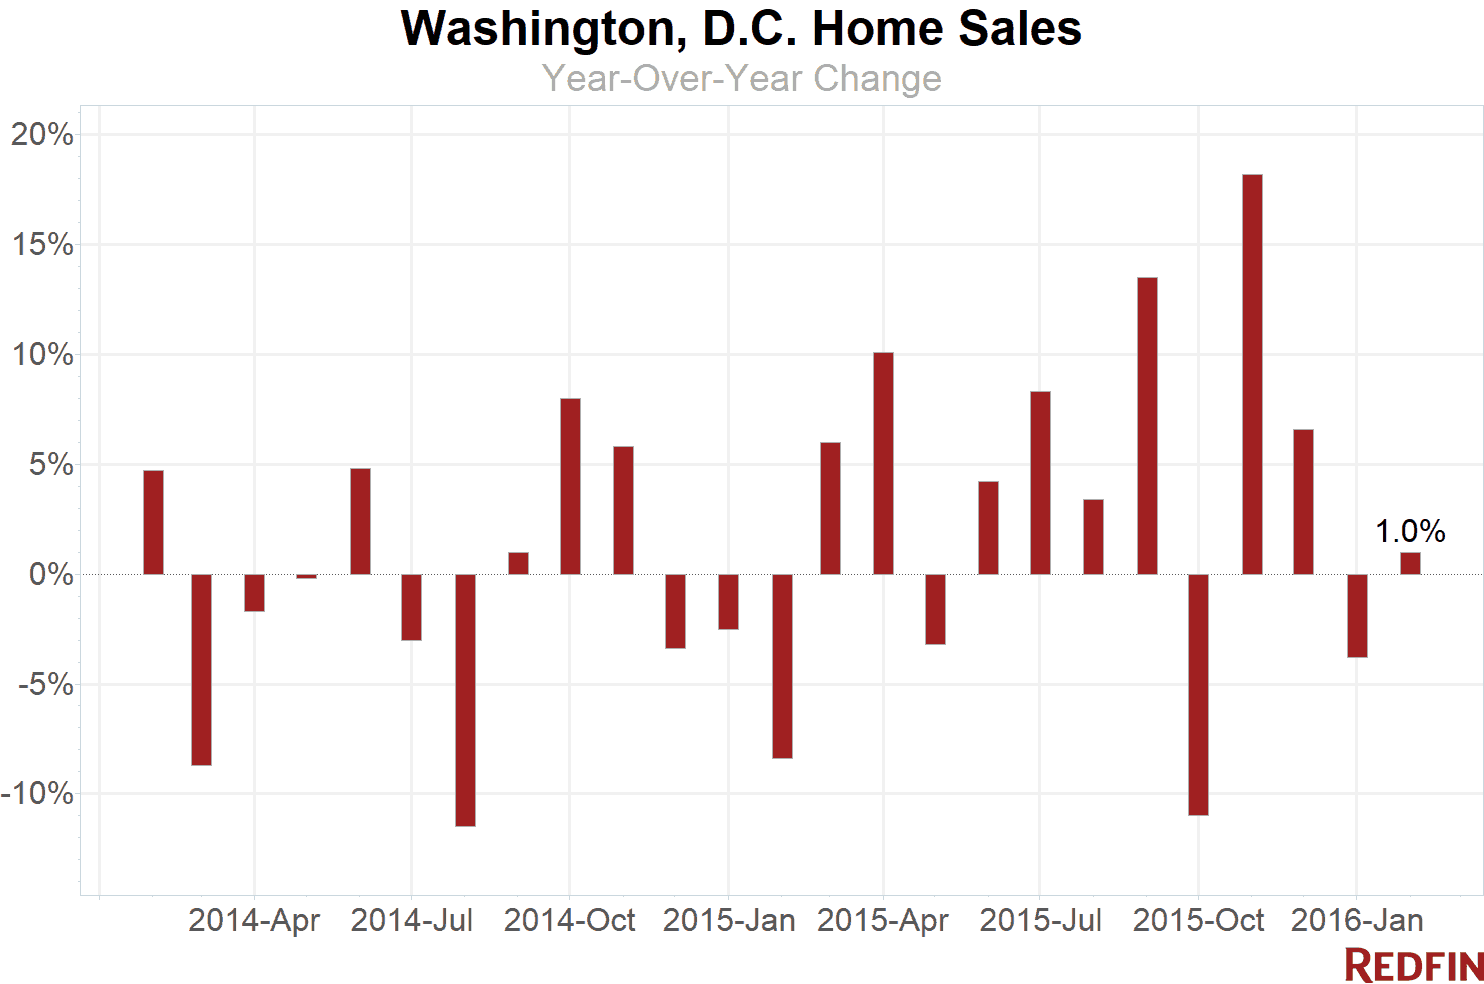
Washington, D.C., home prices increased 6.1 percent in February from a year earlier, with the typical home selling for nearly $515,000. Sales inched up 1 percent over the same period.
A 9.2 percent increase in new listings boosted the overall number of homes for sale 4 percent compared to a year earlier. Despite new homes coming on the market, the District was left with only 2.2 months of supply in February, far below the six months that signals a balanced market.
As the weather starts to warm, competition is also heating up. More than a third of homes in February sold above asking price. The typical home sold in 17 days, similar to last February when homes sold in 16 days and at a quicker pace than last month when homes sold in 22 days.
“There’s already a lot of pent-up demand from buyers who’ve been looking over the winter and haven’t found what they’re looking for,” Washington agent Marshall Carey said. “Those clients are hopeful about new homes hitting the market this spring.”
“Meanwhile, new buyers are jumping into their home search now, too,” Carey said. “With a lot of buyers and only so many quality homes for sale, it’s shaping up to be another competitive year.”
Across the broader D.C, Maryland and Virginia region, the median sale price fell 2.2 percent from a year earlier to $340,000. While prices have been cooling in the region for several months, the District has been insulated from the trend thus far.
Sales increased 6.6 percent year over year. The number of homes for sale was down 8.6 percent, leaving the metro area with a 3.5-month supply. The typical home found a buyer in 48 days.
Hot Neighborhoods
Prices in several neighborhoods east of the Anacostia River surged over the past few months. In Benning Heights/Capitol View/Marshall Heights, home prices rose 52.6 percent compared to last year. In Greenway/Benning/Dupont Park/River Terrace and Fairlawn/Twining/Randle Highlands/Penn Branch, prices rose 28.6 percent and 27 percent.
Georgetown was the most expensive neighborhood, with a median sale price of $1.29 million, followed by Foxhall/Palisades/Spring Valley at $1.1 million. These were the only neighborhoods where the median sale price exceeded $1 million.
Southwest/Waterfront, Logan Circle/Shaw, LeDroit Park and Adams Morgan/Kalorama shared honors for the fastest-moving neighborhood, with the typical home finding a buyer in just eight days.
See our city page for the most up-to-date data on Washington-area home prices.
Here’s what’s happening in your neighborhood:
| Neighborhood | Median Sale Price | Year-Over-Year | Homes Sold | Year-Over-Year | Inventory | Year-Over-Year | New Listings | Median Days on Market | Avg Sale-to-List |
|---|---|---|---|---|---|---|---|---|---|
| Adams Morgan / Kalorama Heights / Lanier Heights | $517,000 | -1.7% | 101 | 8.6% | 73 | 10.6% | 100 | 9 | 99.4% |
| American University Park / Friendship Heights / Tenleytown | $1,023,000 | 11.2% | 52 | 20.9% | 16 | -36.0% | 33 | 8 | 99.9% |
| Atlas District | $720,000 | 10.3% | 44 | -32.3% | 41 | 41.4% | 52 | 8 | 100.7% |
| Bellevue / Congress Heights / Washington Highlands | $215,500 | 6.9% | 40 | 48.1% | 61 | -7.6% | 65 | 32 | 102.5% |
| Benning Heights / Capitol View / Marshall Heights | $260,500 | 18.4% | 39 | 18.2% | 49 | -44.3% | 48 | 28 | 97.9% |
| Bloomingdale | $752,000 | 12.2% | 32 | 0.0% | 29 | 11.5% | 53 | 8 | 100.3% |
| Capitol Hill | $794,500 | 8.1% | 103 | 1.0% | 57 | 14.0% | 90 | 8 | 99.5% |
| Chevy Chase-DC | $928,000 | 9.4% | 57 | 11.8% | 43 | 16.2% | 43 | 12 | 97.2% |
| Chinatown / Mount Vernon Square / Penn Quarters | $499,500 | 1.5% | 84 | -10.6% | 63 | -8.7% | 75 | 18 | 96.9% |
| Cleveland Park | $462,450 | 4.5% | 36 | 38.5% | 18 | 38.5% | 32 | 10 | 100.1% |
| Columbia Heights | $544,000 | 7.2% | 99 | 26.9% | 84 | 33.3% | 113 | 11 | 99.2% |
| Congress Heights | $220,000 | -13.7% | 21 | 61.5% | 32 | 10.3% | 30 | 32 | 99.6% |
| Deanwood | $200,000 | -1.7% | 27 | 42.1% | 27 | -15.6% | 32 | 29 | 93.7% |
| Dupont Circle | $434,325 | 9.4% | 88 | -12.9% | 58 | -4.9% | 84 | 14 | 100.0% |
| Eckington | $600,000 | 36.4% | 18 | -14.3% | 22 | 120.0% | 20 | 13 | 97.7% |
| Edgewood | $530,000 | -10.2% | 13 | -35.0% | 17 | 41.7% | 26 | 8 | 99.4% |
| Fairlawn / Twining / Randle Highlands / Penn Branch | $285,000 | -2.4% | 33 | 6.5% | 40 | 2.6% | 39 | 34 | 101.1% |
| Foggy Bottom / George Washington University / West End | $439,000 | -12.0% | 72 | 18.0% | 50 | -21.9% | 52 | 25 | 96.6% |
| Fort Totten / Lamont Riggs / Pleasant Hill / Queens Chapel | $385,500 | 10.8% | 30 | -3.2% | 29 | -21.6% | 36 | 21 | 99.7% |
| Foxhall / Palisades / Spring Valley / Wesley Heights | $1,269,750 | 4.5% | 48 | 17.1% | 71 | 22.4% | 55 | 24 | 95.1% |
| Georgetown | $1,312,500 | 16.2% | 46 | -22.0% | 63 | 14.5% | 61 | 15 | 95.6% |
| Glover Park / Cathedral Heights / McLean Gardens | $442,000 | -5.9% | 106 | 5.0% | 94 | 2.2% | 107 | 12 | 98.3% |
| Greenway / Benning / Dupont Park / River Terrace | $220,000 | 8.1% | 17 | -15.0% | 16 | -40.7% | 18 | 33 | 95.1% |
| Hill East | $692,500 | 8.4% | 64 | 16.4% | 27 | -34.1% | 55 | 8 | 99.7% |
| Historic Anacostia | $191,000 | -27.2% | 20 | 66.7% | 22 | 46.7% | 28 | 9 | 100.1% |
| Howard University / Le Droit Park | $688,000 | 17.1% | 60 | 13.2% | 30 | -6.3% | 48 | 8 | 99.2% |
| Kingman Park | $485,000 | 2.6% | 34 | 13.3% | 38 | 22.6% | 52 | 13 | 99.2% |
| Logan Circle-Shaw | $605,000 | 11.5% | 167 | -20.1% | 85 | -8.6% | 150 | 10 | 99.7% |
| Logan Circle-Shaw | $698,750 | 9.7% | 32 | -11.1% | 15 | 15.4% | 34 | 8 | 100.4% |
| Massachusetts Avenue Heights | $834,500 | 77.6% | 25 | -35.9% | 30 | 0.0% | 37 | 14 | 97.7% |
| Mount Pleasant | $890,000 | 10.3% | 23 | 4.5% | 14 | 100.0% | 23 | 7 | 102.5% |
| Navy Yard | $632,545 | 39.3% | 13 | 30.0% | 2 | 0.0% | 9 | 7 | 100.4% |
| NoMa | $710,000 | 6.0% | 20 | -42.9% | 21 | 133.3% | 20 | 14 | 99.7% |
| Petworth | $645,000 | 7.5% | 59 | -18.1% | 42 | -14.3% | 71 | 15 | 98.1% |
| Pleasant Plains | $597,500 | 17.7% | 27 | -15.6% | 19 | -9.5% | 31 | 8 | 101.5% |
| Southwest / Waterfront | $335,750 | 17.0% | 46 | -27.0% | 38 | 18.8% | 49 | 8 | 99.3% |
| Stanton Park | $700,000 | 13.8% | 81 | -13.8% | 62 | 26.5% | 102 | 8 | 100.2% |
| Takoma | $765,000 | 118.6% | 23 | 64.3% | 16 | 60.0% | 25 | 18 | 99.1% |
| Trinidad / Arboretum / Ivy City | $400,000 | -8.0% | 57 | 35.7% | 63 | 16.7% | 76 | 12 | 100.4% |
| Truxton Circle | $638,000 | 3.7% | 14 | -17.6% | 18 | 0.0% | 20 | 25 | 100.5% |
| Union Station / Kingman Park / Stanton Park | $649,000 | 6.7% | 117 | -16.4% | 101 | 36.5% | 140 | 9 | 100.0% |
| Van Ness / Forest Hills / Wakefield | $480,000 | 17.5% | 33 | -21.4% | 27 | 3.8% | 30 | 16 | 96.2% |
| Woodley Park | $522,500 | -4.7% | 17 | 6.3% | 8 | -20.0% | 8 | 8 | 96.2% |
| Washington, DC | $500,500 | -0.9% | 739 | 5.4% | 1,241 | -7.1% | 502 | 16 | 98.7% |
NOTE: Not all neighborhoods are listed, but totals for Washington, D.C., encompass entire city. Data is based on listing information and might not reflect all real estate activity in the market. Neighborhood-specific data is measured over the three months ended Feb. 29. Inventory measures listings active as of Feb. 29.
For more information, contact Redfin journalist services
Phone: 206-588-6863
Email: press@redfin.com
See Redfin’s data center to find out what’s happening in other cities.
To be added to Redfin’s press release distribution list, subscribe here.
 United States
 Canada