High mortgage rates and harsh weather are pushing down home sales, but some house hunters are touring and getting a feel for the market.
The bumpy start to 2024’s housing market continues, with daily average mortgage rates posting their biggest one-day increase in over a year on February 2. The jump came after a hotter-than-expected January jobs report and the Fed’s confirmation that they’re unlikely to cut interest rates in the next two months, which means mortgage rates will probably remain elevated near their current level for at least that long.
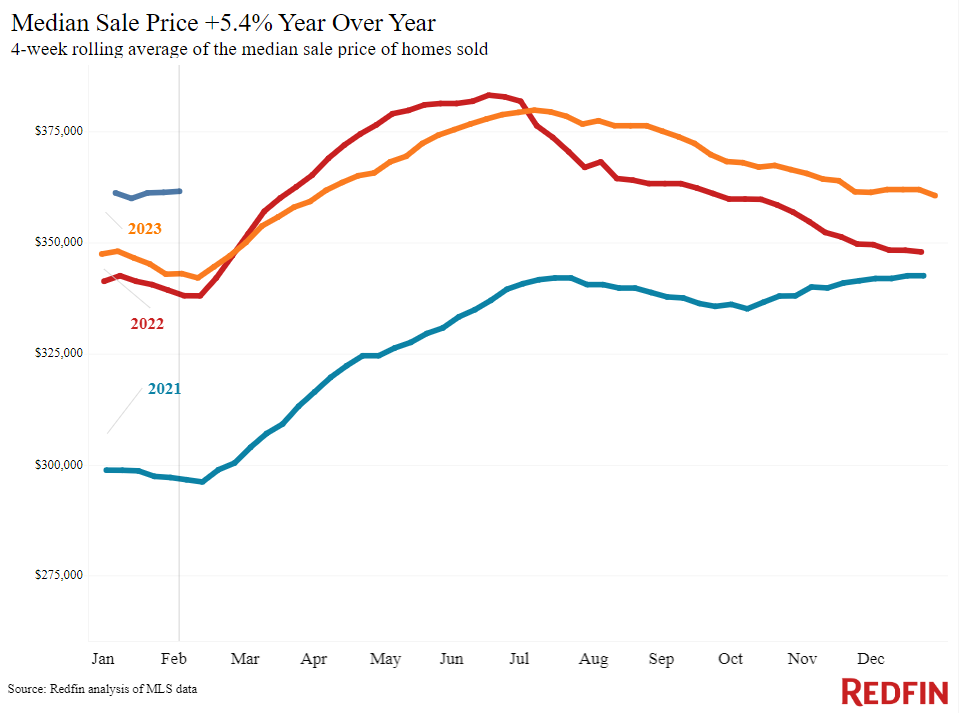
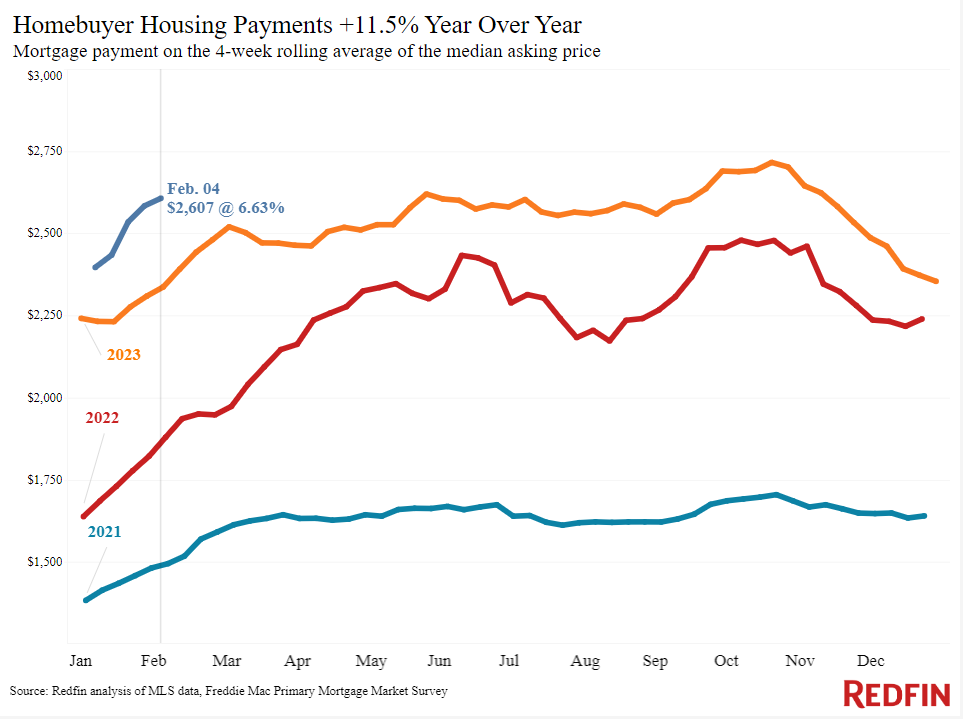
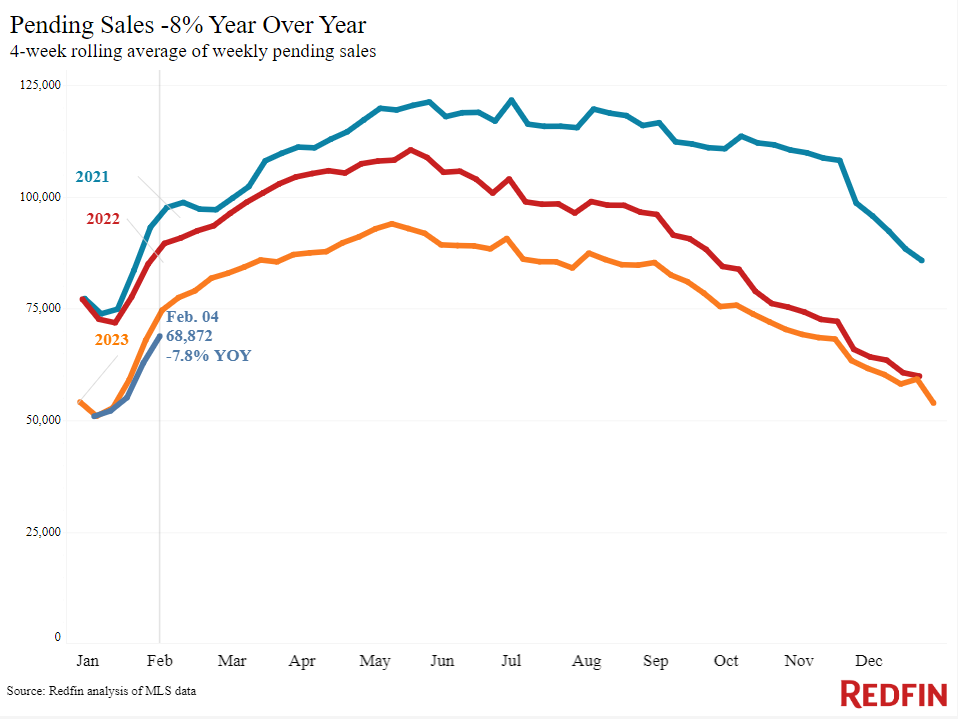
Rising home prices are exacerbating rising rates, with the typical monthly mortgage payment just about $100 shy of October’s all-time high. The median U.S. sale price rose 5.4% year over year during the four weeks ending February 4, the biggest increase in over a year. High housing costs are pricing out many would-be homebuyers; pending sales are down 8%, the biggest decline in four months. There are also a few other contributors to sales falling: Harsh winter weather in the first half of January delayed a lot of homebuying deals, and pending sales were improving at this time last year as mortgage rates temporarily dropped.
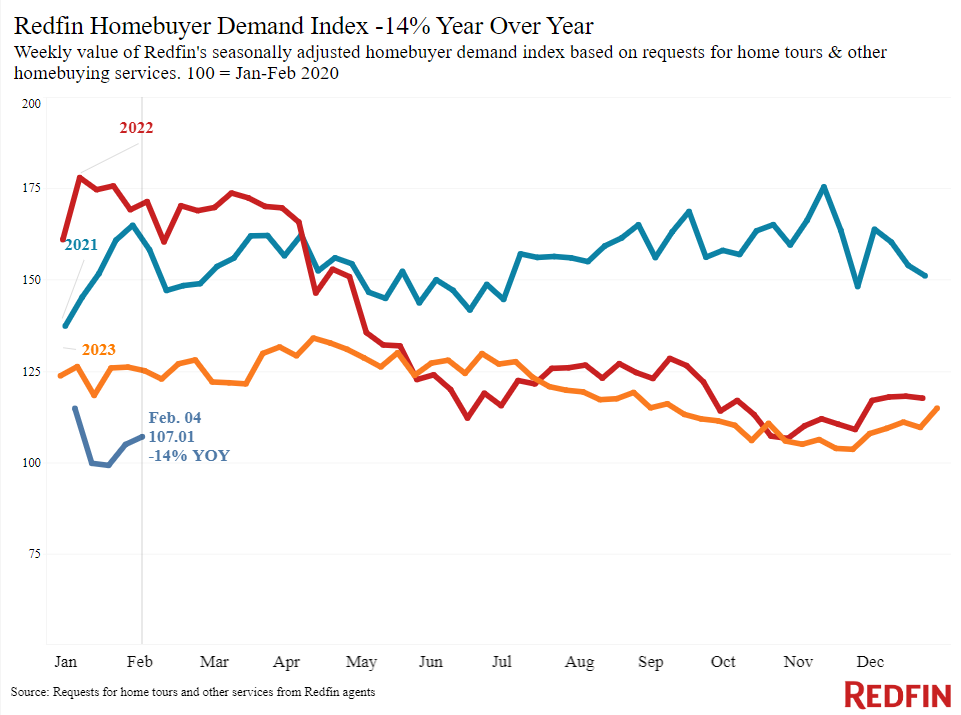
Still, some house hunters are at least getting a feel for the market. Redfin’s Homebuyer Demand Index–a seasonally adjusted measure of requests for tours and other buying services from Redfin agents–has steadily risen since mid-January, and a separate measure of home tours shows they’ve increased 16% since the start of the year, compared with a 10% rise at this time last year. Some sellers are jumping in, too, with new listings up 7% year over year.
“We’re seeing a bit of recovery with house hunters touring homes, but even demand at the earliest stages isn’t up as much as we would expect at this time of year,” said Chen Zhao, Redfin’s economic research lead. “That’s because mortgage rates are climbing again and winter weather has been harsher than usual in much of the country, keeping some house hunters at home.”
Luis Rojas, a Redfin Premier agent in the Viera West, FL area, said today’s housing market is touch and go. “High mortgage rates brought the local market to a near-standstill from August through November, activity picked up when rates dropped a bit in mid-December, and now it’s slowing down again as rates rise,” Rojas said. “I’m advising buyers–especially first-timers–that the mortgage rates they see in the news aren’t the be-all and end-all. Some local lenders are willing to give rates in the 5% range for new construction projects because any business is better than no business.”
Leading indicators
| Indicators of homebuying demand and activity | ||||
| Value (if applicable) | Recent change | Year-over-year change | Source | |
| Daily average 30-year fixed mortgage rate | 6.92% (Feb. 7) | Up from 6.75% a week earlier | Up from 6.39% | Mortgage News Daily |
| Weekly average 30-year fixed mortgage rate | 6.63% (week ending Feb. 1) | Near lowest level since May | Up from 6.09% | Freddie Mac |
| Mortgage-purchase applications (seasonally adjusted) | Down 1% from a week earlier; up 3% from a month earlier (as of week ending Feb. 2) | Down 19% | Mortgage Bankers Association | |
| Redfin Homebuyer Demand Index (seasonally adjusted) | Up slightly from a week earlier, but down 7% from a month earlier (as of week ending Feb. 4) | Down 14% | Redfin Homebuyer Demand Index, a measure of requests for tours and other homebuying services from Redfin agents | |
| Google searches for “home for sale” | Down 2% from a month earlier (as of Feb. 3) | Down 16% | Google Trends | |
| Touring activity | Up 16% from the start of the year (as of Feb. 6) | At this time last year, it was up 10% from the start of 2023 | ShowingTime, a home touring technology company | |
Key housing-market data
| U.S. highlights: Four weeks ending February 4, 2024
Redfin’s national metrics include data from 400+ U.S. metro areas, and is based on homes listed and/or sold during the period. Weekly housing-market data goes back through 2015. Subject to revision. |
|||
| Four weeks ending February 4, 2024 | Year-over-year change | Notes | |
| Median sale price | $361,498 | 5.4% | Biggest increase since Oct. 2022 |
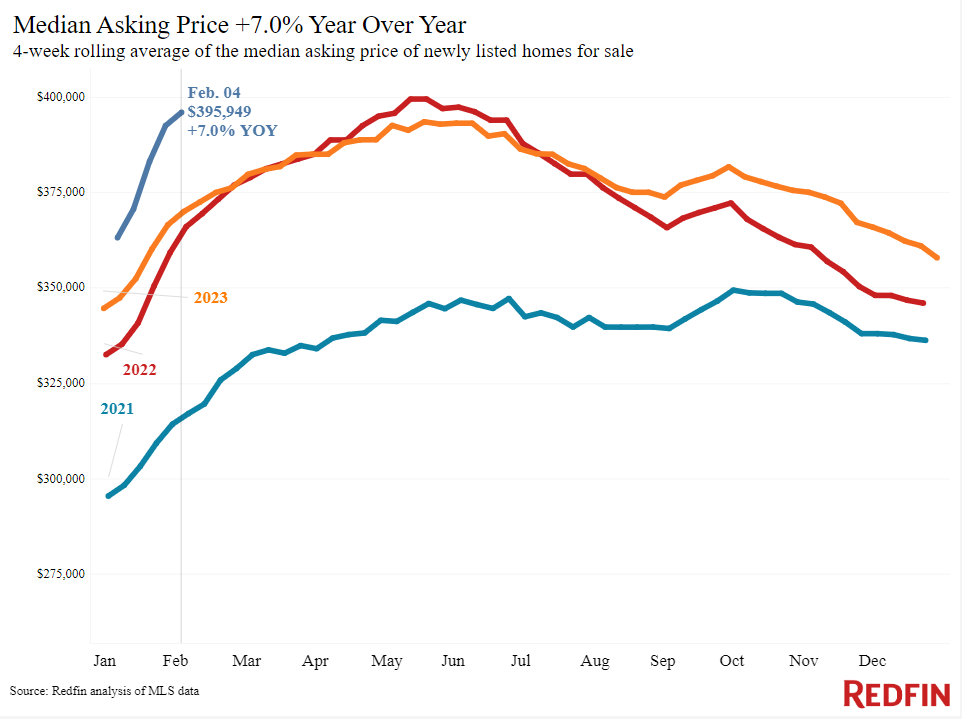
| Median asking price | $395,949 | 7% | Biggest increase since Sept. 2022 |
| Median monthly mortgage payment | $2,607 at a 6.63% mortgage rate | 11.5% | Down roughly $110 from all-time high set in October 2023, but up roughly $250 from the four weeks ending Dec. 31 |
| Pending sales | 68,872 | -7.8% | Biggest decline since October 2023 |
| New listings | 70,415 | 6.6% | |
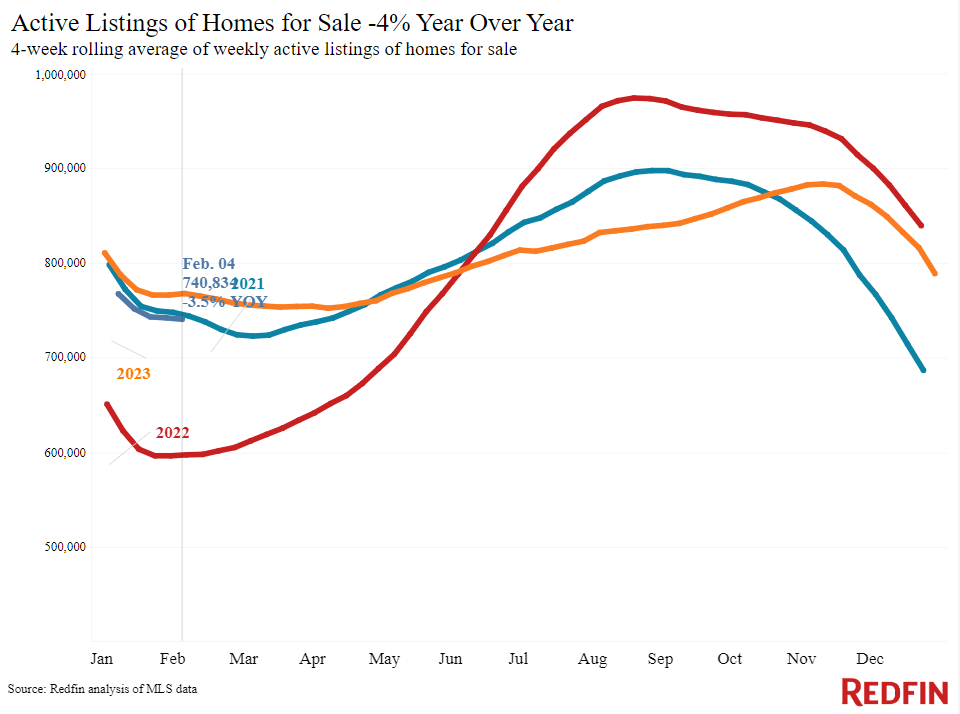
| Active listings | 740,834 | -3.5% | |
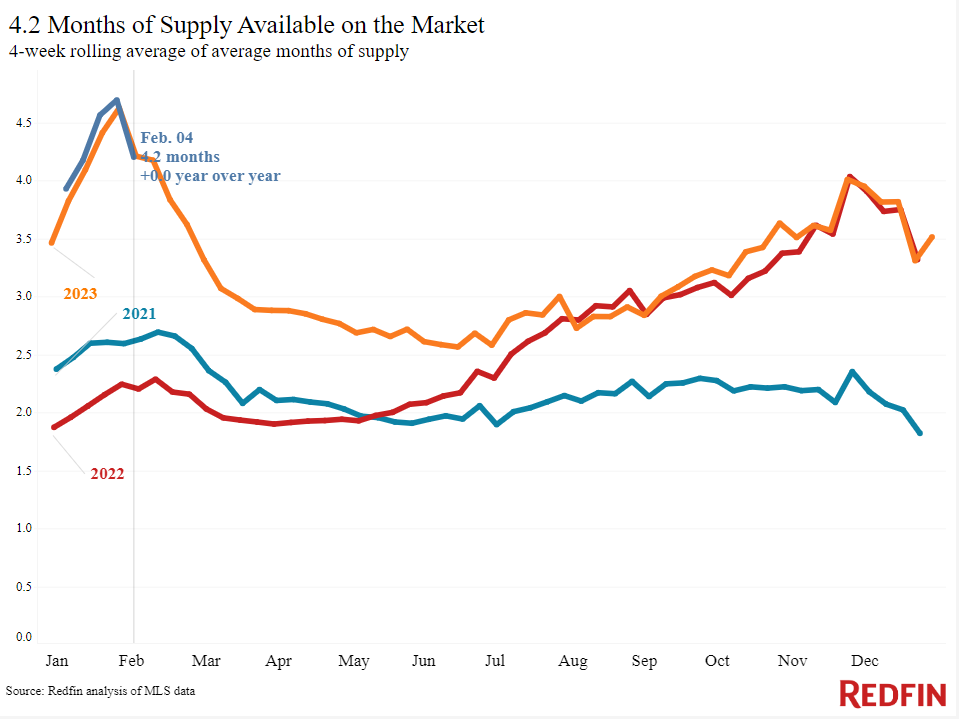
| Months of supply | 4.2 months | Unchanged | 4 to 5 months of supply is considered balanced, with a lower number indicating seller’s market conditions. |
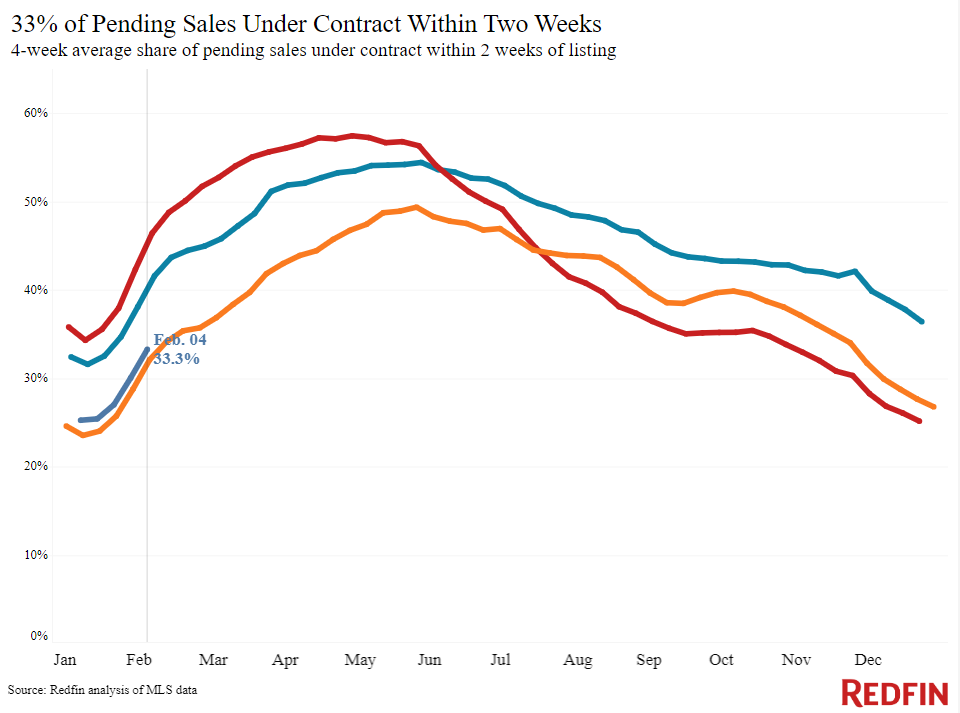
| Share of homes off market in two weeks | 33.3% | Up from 32% | |
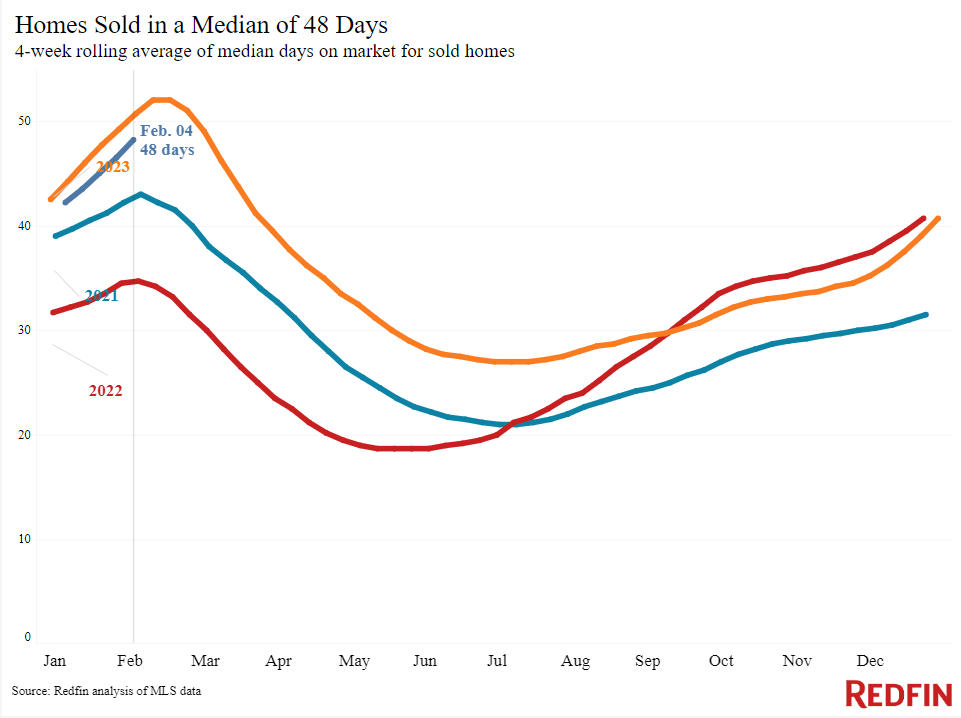
| Median days on market | 48 | -2 days | |
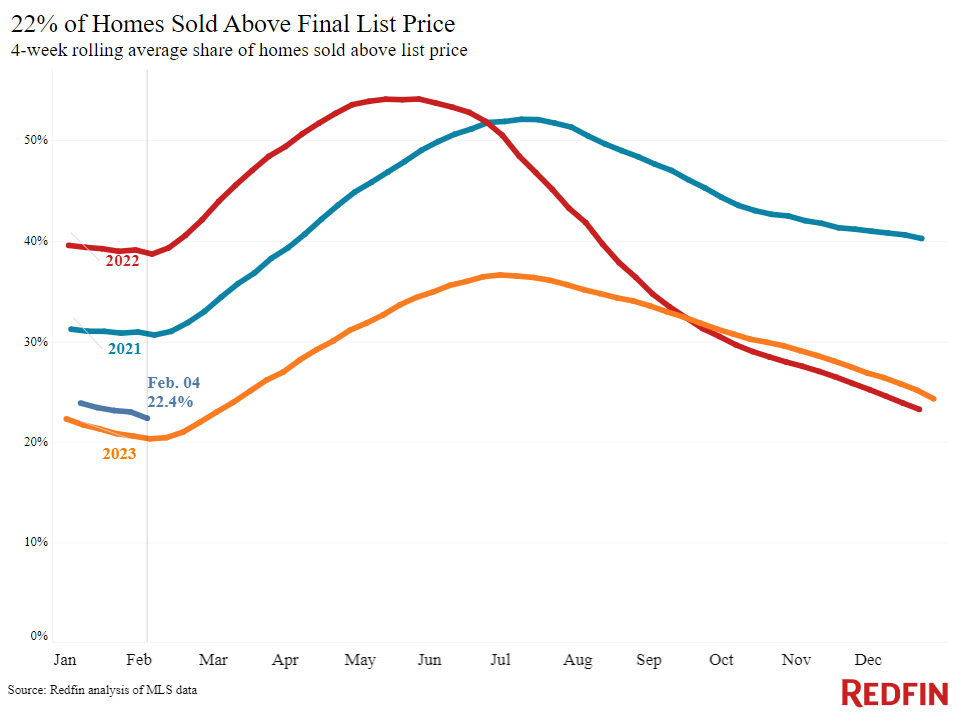
| Share of homes sold above list price | 22.4% | Up from 20% | |
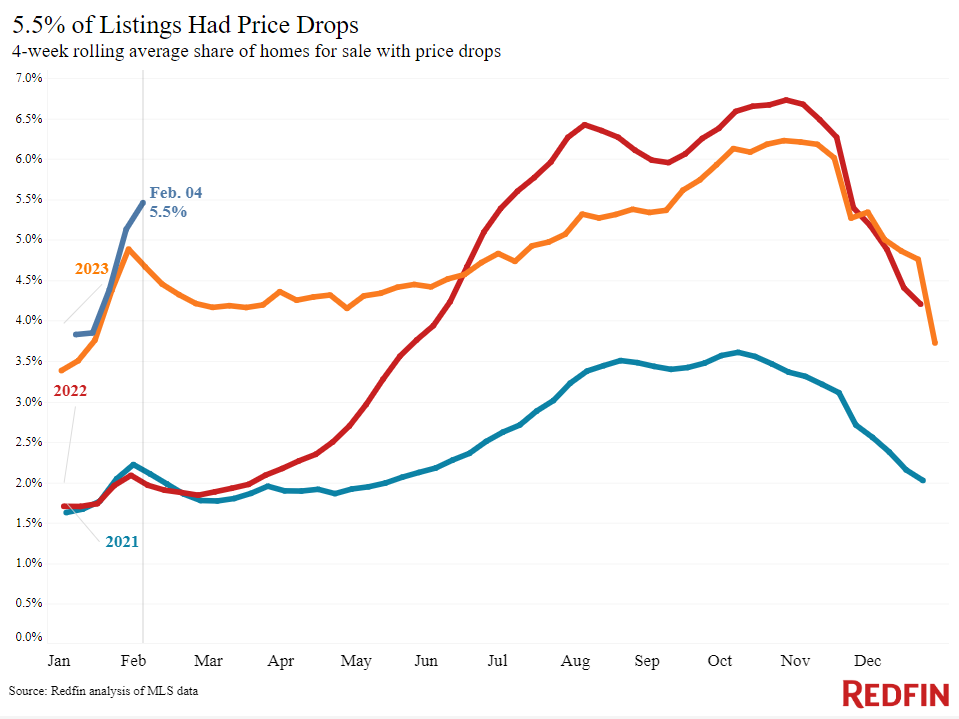
| Share of homes with a price drop | 5.5% | +1 pt. | |
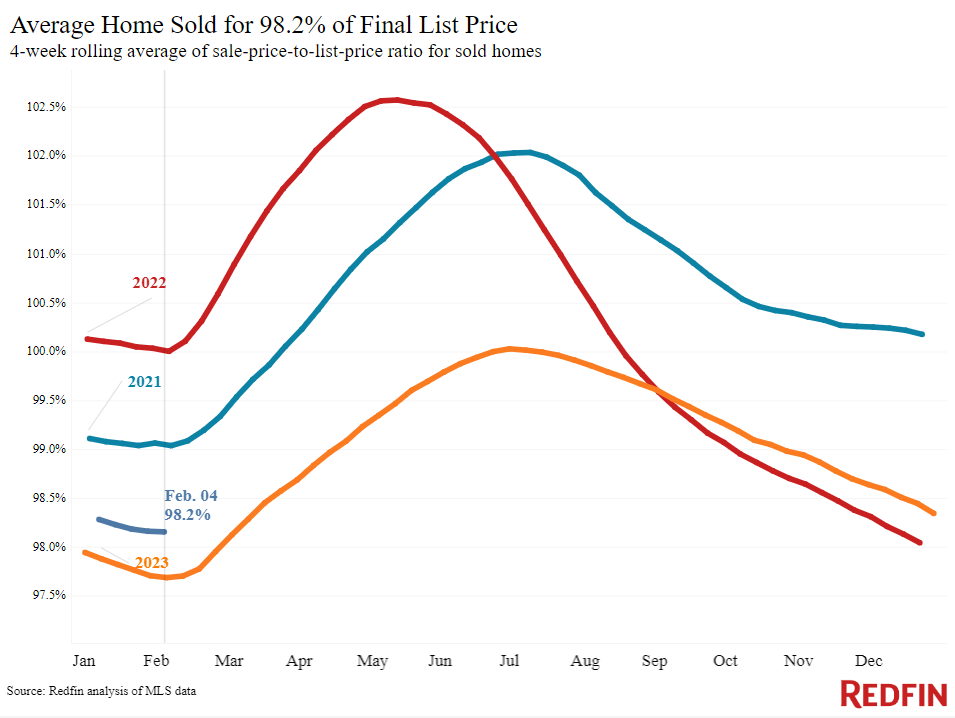
| Average sale-to-list price ratio | 98.2% | +0.5 pts. | |
|
Metro-level highlights: Four weeks ending February 4, 2024 Redfin’s metro-level data includes the 50 most populous U.S. metros. Select metros may be excluded from time to time to ensure data accuracy. |
|||
|---|---|---|---|
| Metros with biggest year-over-year increases | Metros with biggest year-over-year decreases | Notes | |
| Median sale price |
Miami (13.4%) Anaheim, CA (13.4%) Detroit (13.3%) Warren, MI (12.1%) Chicago (11.3%) |
San Antonio, TX (-4.7%) Austin, TX (-3.7%) |
Declined in 2 metros |
| Pending sales | San Jose, CA (13.8%)
San Francisco, CA (6%) Anaheim, CA (4.5%) Riverside, CA (0.4%) Columbus, OH (0.2%) |
San Antonio, TX (-33.2%)
Portland, OR (-30.2%) Nashville, TN (-21.5%) New Brunswick, TN (-19.4%) Houston (-18.5%) |
Increased in 5 metros |
| New listings | Dallas, TX (27.1%)
Miami (26.9%) Jacksonville, FL (26.3%) Fort Lauderdale, FL (23.6%) San Diego, CA (22.1%) |
Chicago (-17.8%)
Atlanta (-16%) Milwaukee, WI (-14%) Portland, OR (-13.6%) Nashville, TN (-10.4%) |
Declined in 14 metros |
Refer to our metrics definition page for explanations of all the metrics used in this report.