
Housing supply fell to a new low in December, fueling a 3.6% month-over-month drop in home sales.
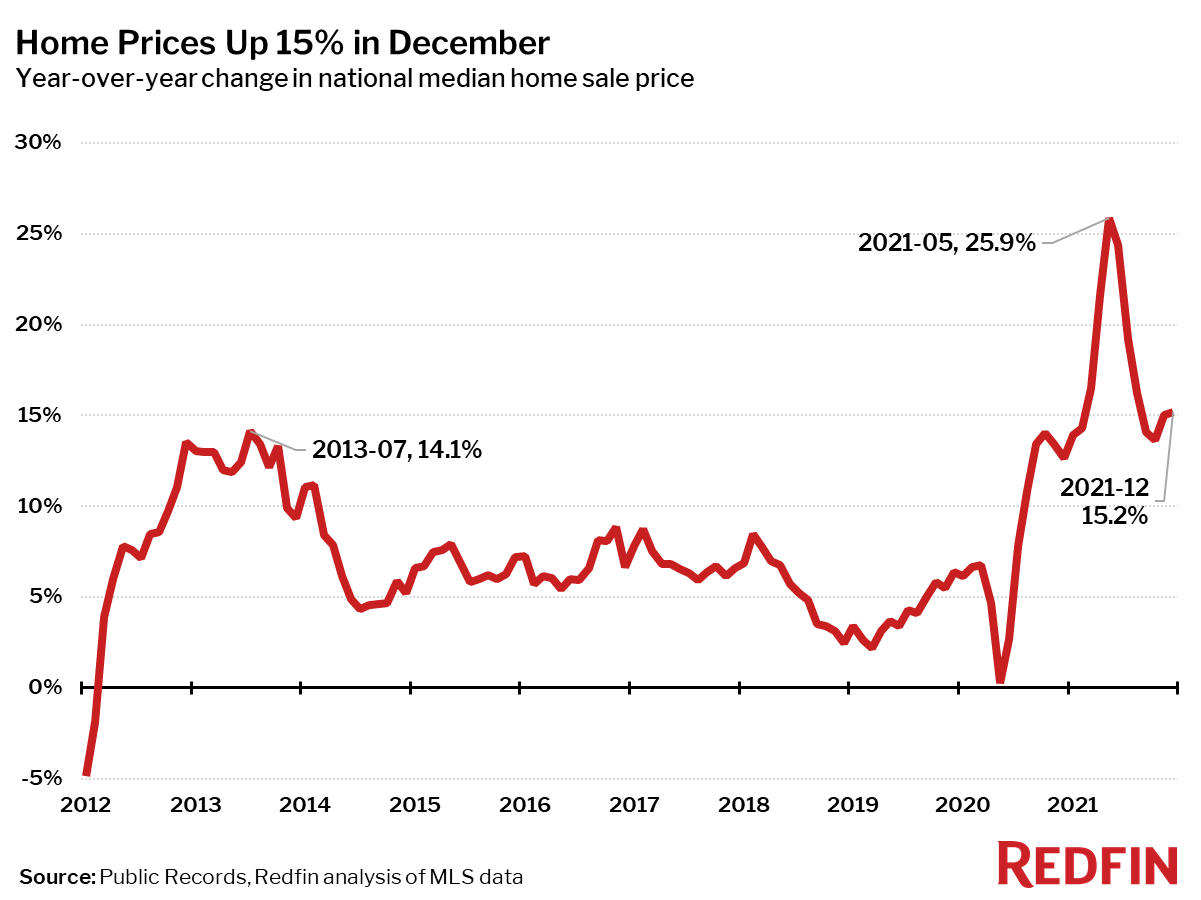
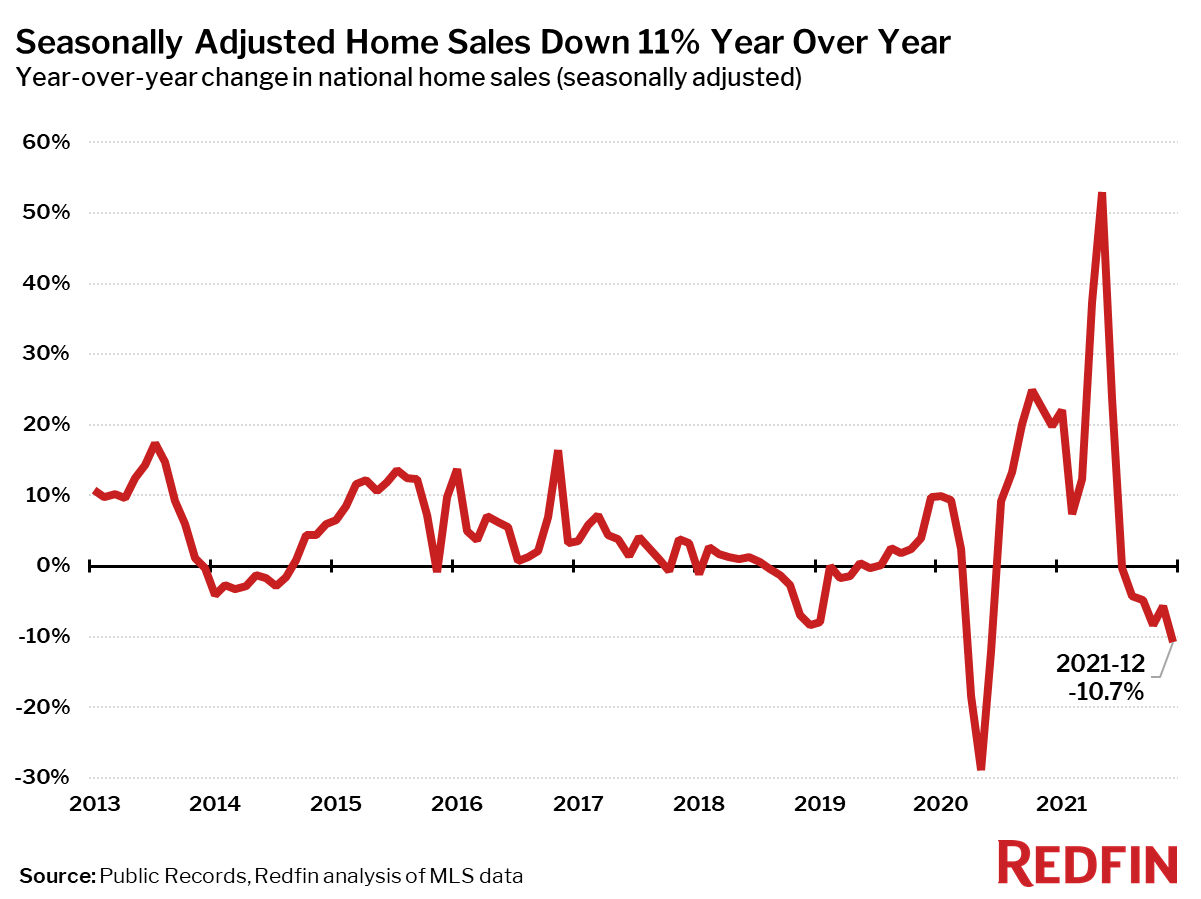
Fewer homes than ever were for sale in December, driving seasonally-adjusted home sales down 3.6%. That’s the largest month-over-month sales decline since May 2020. Home prices surged 15% from a year earlier in December, the 17th consecutive month of double-digit increases.
“Home sales are slumping, but not for lack of demand,” said Redfin Chief Economist Daryl Fairweather. “There are plenty of homebuyers on the hunt, but there is just nothing for sale. In many markets, shopping for a home feels like going to the grocery store only to find the shelves bare. In January, I expect to see more buyers and sellers in the market, but demand will increase more than supply– pushing prices higher at the start of this year.”
| Market Summary | December 2021 | Month-Over-Month | Year-Over-Year |
|---|---|---|---|
| Median sale price | $382,900 | -0.1% | 15.2% |
| Homes sold, seasonally-adjusted | 579,300 | -3.6% | -10.7% |
| Pending sales, seasonally-adjusted | 593,800 | -2.2% | -3.1% |
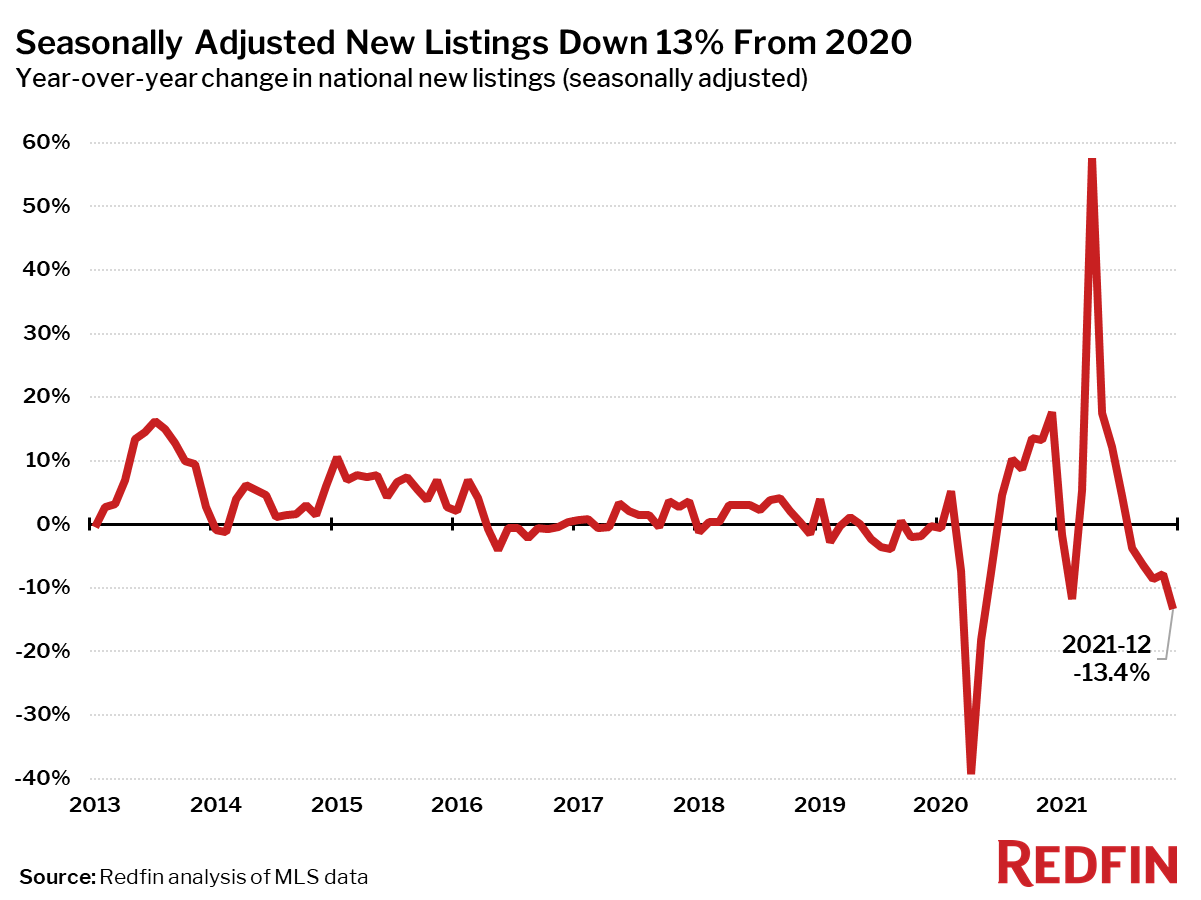
| New listings, seasonally-adjusted | 629,900 | -2.4% | -13.4% |
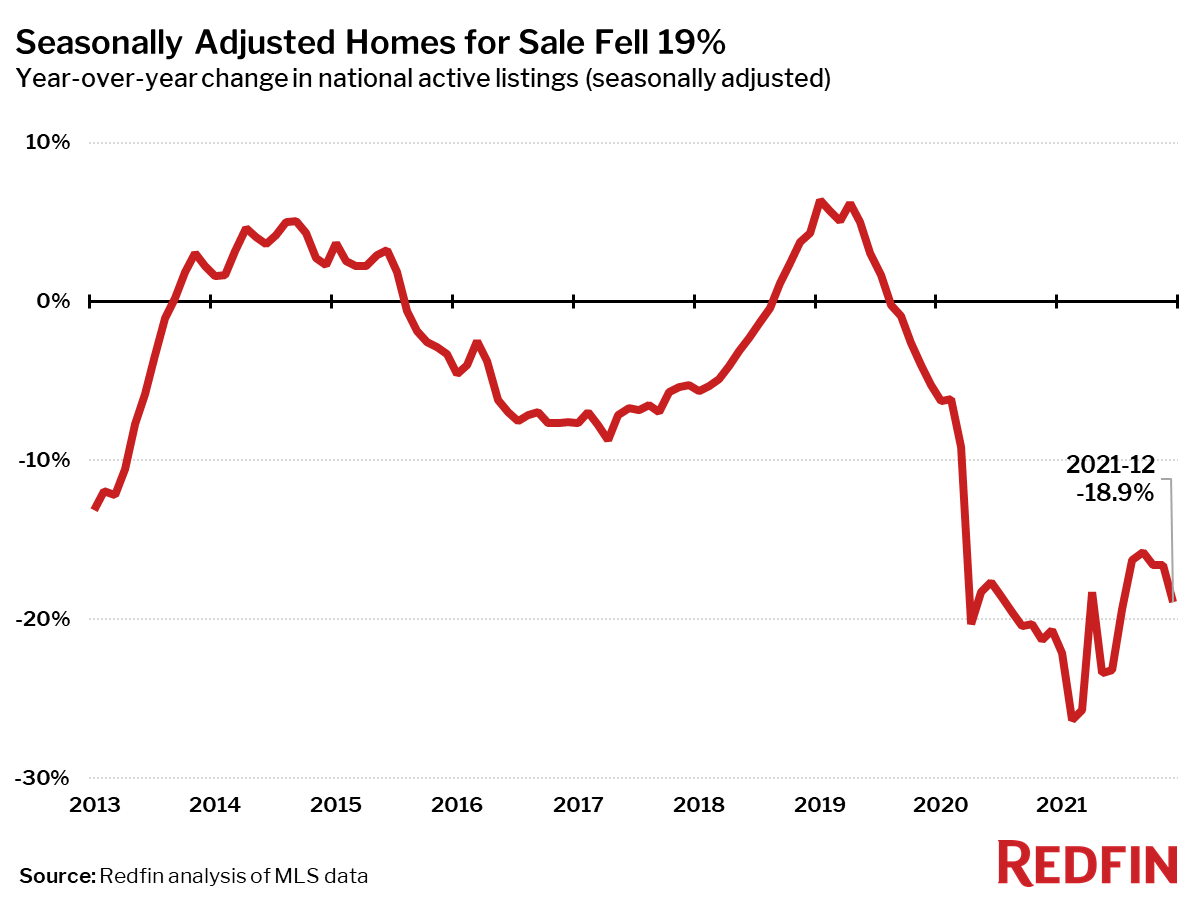
| All Homes for sale, seasonally-adjusted | 1,334,600 | -3.2% | -18.9% |
| Median days on market | 24 | 2 | -7 |
| Months of supply | 1 | -0.3 | -0.3 |
| Sold above list | 42.8% | -1.5 pts† | 9.2 pts† |
| Average Sale-to-list | 100.5% | -0.1 pts† | 1.1 pts† |
| Average 30-year fixed mortgage rate | 3.10% | +0.03 pts† | +0.42 pts† |
“The wild housing market did not take a break for the holidays,” said Brionna Chang, a Redfin real estate agent in the San Francisco area. “There was one two-bedroom home in Orinda that was listed just before Christmas and around 40 people immediately came to the open houses. It ended up getting multiple offers and going for $325,000 over the $1.2 million asking price.”
Median sale prices increased from a year earlier in all but one of the 88 largest metro areas Redfin tracks. The only metro area with a decrease was Bridgeport, CT, where home prices fell 0.4% from a year earlier following a 28% year-over-year increase in December 2020. The largest price increases were in Austin, TX (+30%), North Port, FL (+28%) and Phoenix, AZ (+28%).
Seasonally-adjusted home sales in December were down 3.6% from a month earlier and 11% from a year earlier, the largest annual decline since June 2020. Home sales fell from the prior year in 79 of the 88 largest metro areas Redfin tracks. The biggest sales declines were seen in Nassau County, NY (-22%), New Brunswick, NJ (-22%) and Albany, NY (-21%). The largest gains were in Greenville, SC (+9%), Greensboro, NC (+8%) and Baton Rouge, LA (+7%).
Seasonally adjusted active listings—the count of all homes that were for sale at any time during the month—fell 19% year over year to an all-time low in December.
Only one of the 88 largest metros tracked by Redfin posted a year-over-year increase in the number of seasonally adjusted active listings of homes for sale: Detroit, MI (+4%). The biggest year-over-year declines in active housing supply in December were in Baton Rouge, LA (-52%), San Jose, CA (-49%) and San Francisco, CA (-46%).
Seasonally adjusted new listings of homes for sale were down 13% in December from a year earlier, the largest decline since May 2020. New listings fell from a year ago in 82 of the 88 largest metro areas.
Despite rising home prices, homes that closed in December reflected a less competitive housing market in the prior months. Homes spent longer on the market and were less likely to sell above list price compared to mid-2021.
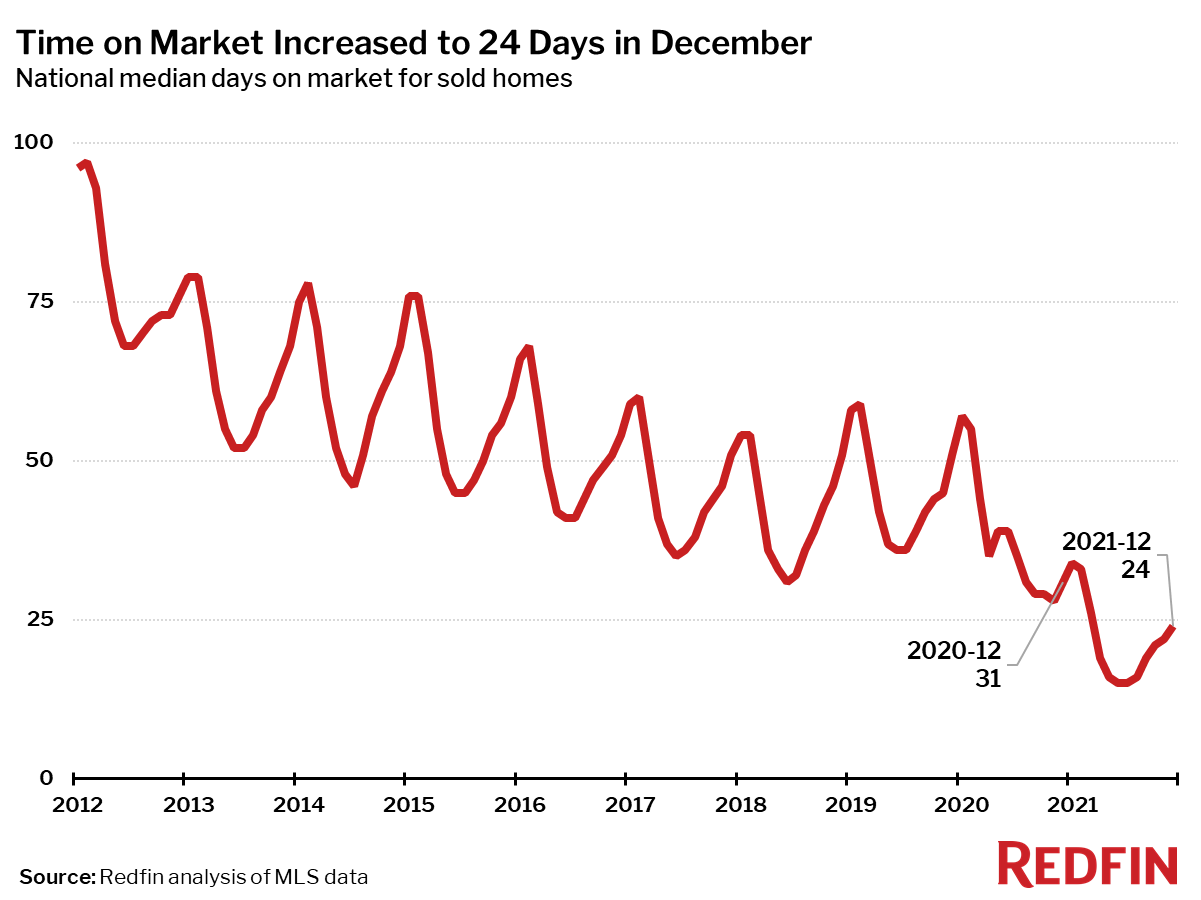
The typical home that sold in December went under contract in 24 days—a week faster than a year earlier, when homes sold in a median 31 days, and up nine days from the record low of 15 days in June.
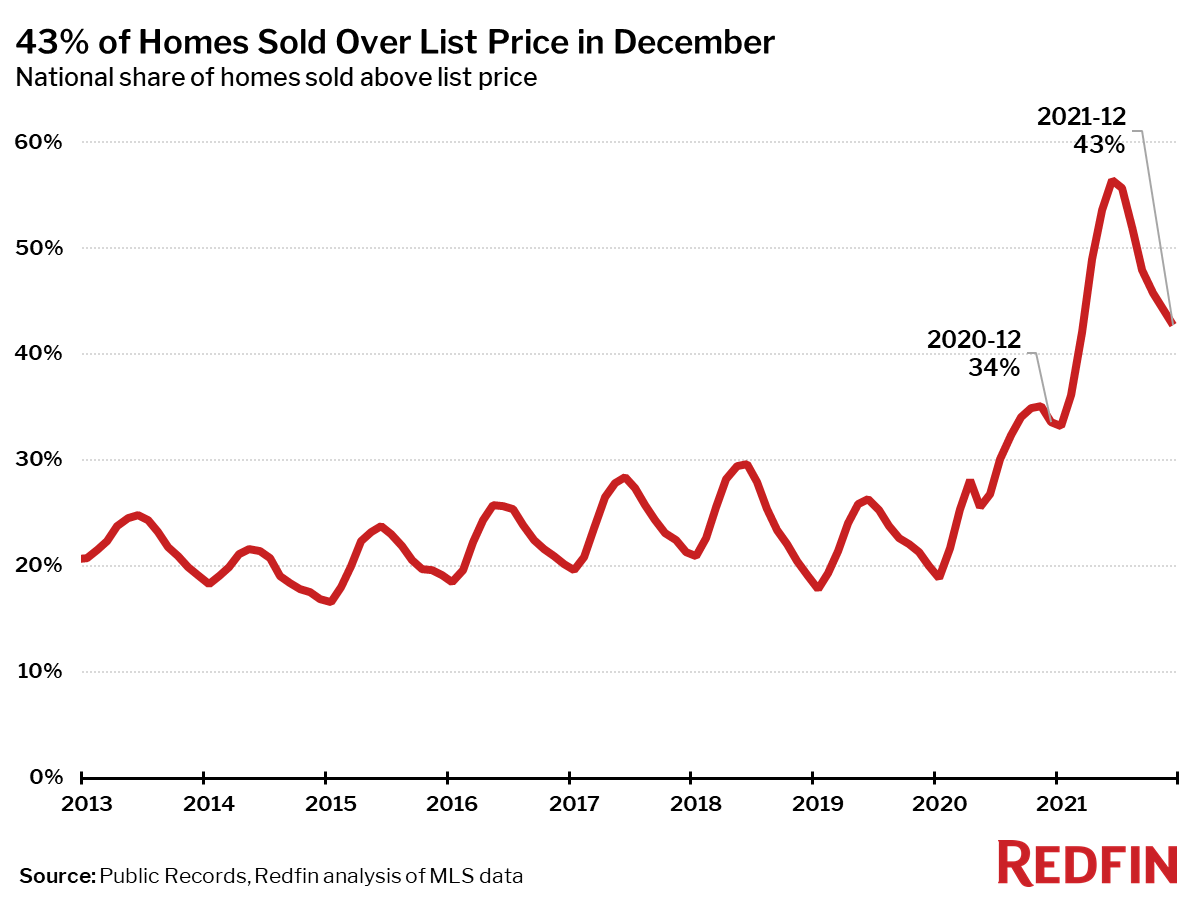
In December, 43% of homes sold above list price, down 14 percentage points from the record high in June, but up 9 percentage points from a year earlier.
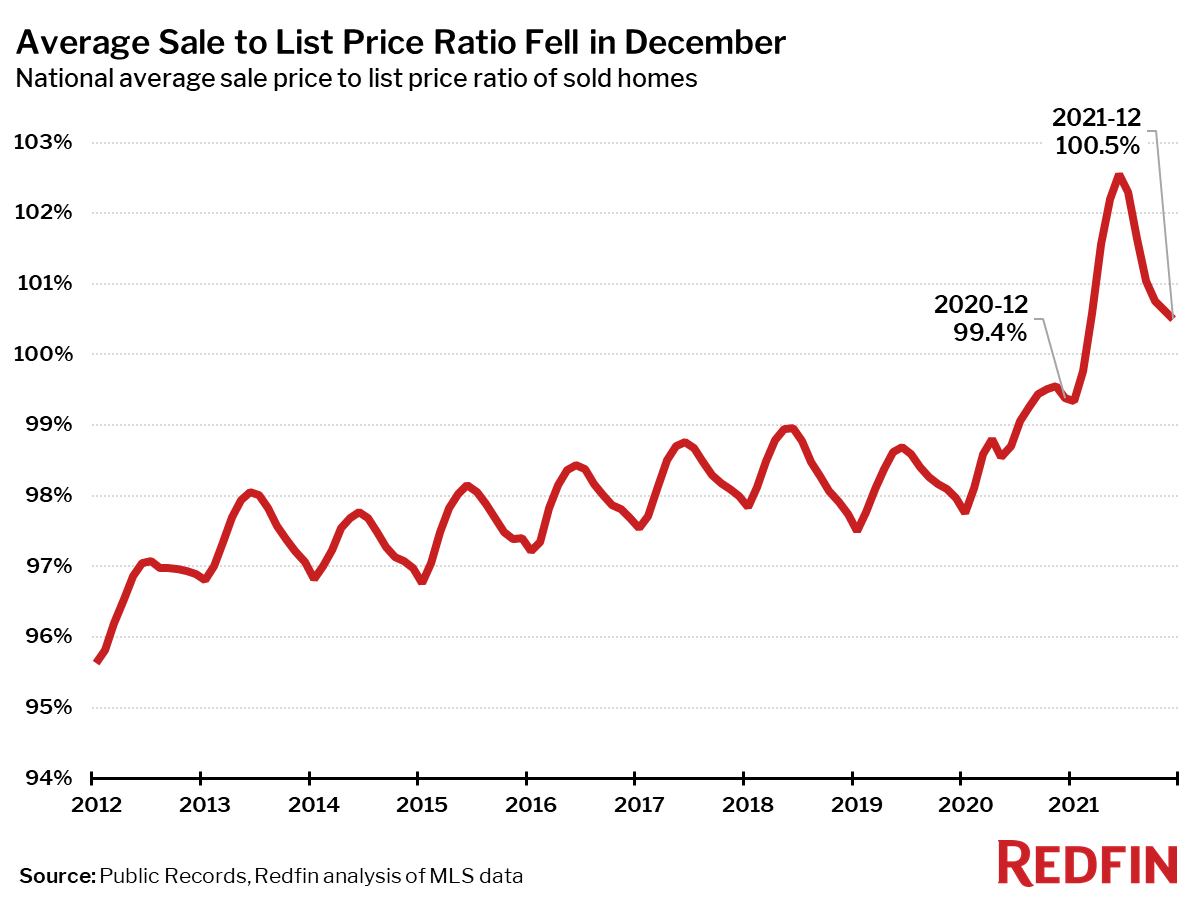
The average sale-to-list price ratio in December was 100.5%, down from a record high of 102.6% in June but up from 99.4% a year earlier.
Other December Highlights
Competition
- Seattle, Denver, Indianapolis and Grand Rapids, MI were the fastest markets, with half of all homes pending sale in just seven days.
- The most competitive market in December was San Jose, CA where 73.8% of homes sold above list price, followed by 73.8% in Oakland, CA, 63.7% in Rochester, NY, 63.7% in San Francisco, and 63.2% in Anaheim, CA.
Prices
- Austin, TX had the nation’s highest price growth, rising 30.3% since last year to $482,149. North Port, FL had the second highest growth at 28.4% year-over-year price growth, followed by Phoenix (28%), Tucson, AZ (25.6%), and Raleigh, NC (25.4%).
- One metro area saw price declines in December: Bridgeport, CT (-0.4%).
Sales
- Greenville, SC led the nation in year-over-year sales growth, up 9.4%, followed by Greensboro, NC, up 7.9%. Baton Rouge, LA rounded out the top three with sales up 7.0% from a year ago.
- Nassau County, NY saw the largest decline in sales since last year, falling 22.3%. Home sales in New Brunswick, NJ and Albany, NY declined by 21.6% and 20.8%, respectively.
Inventory
- Only Detroit had an increase in the number of homes for sale, up 3.9% year over year.
- Baton Rouge, LA had the largest decrease in overall active listings, falling 52% since last December. San Jose, CA (-48.7%), San Francisco (-46.1%), and Salt Lake City (-46.1%) also saw far fewer homes available on the market than a year ago.
Redfin Estimate
- Miami (84.6%) had the largest share of homes predicted to sell for below list price, according to Redfin Estimate data, followed by West Palm Beach, FL (79.7%) and Fort Lauderdale, FL (79.2%).
- Oakland, CA (91.9%) had the largest share of homes predicted to sell at or above list price, followed by San Jose, CA (90.8%) and San Francisco (87.0%).
Below are market-by-market breakdowns for prices, inventory, new listings and sales for markets with populations of 750,000 or more. For downloadable data on all of the markets Redfin tracks, visit the Redfin Data Center.
Refer to our metrics definition page for explanations of all the metrics used in this report.
Median Sale Price
| Redfin Metro | Median Sale Price | Month-Over-Month | Year-Over-Year |
|---|---|---|---|
| Albany, NY | $264,000 | -0.4% | 10.0% |
| Allentown, PA | $275,000 | 5.8% | 14.6% |
| Anaheim, CA | $940,000 | 1.4% | 17.5% |
| Atlanta, GA | $350,000 | 0.9% | 22.8% |
| Austin, TX | $482,100 | 1.0% | 30.3% |
| Bakersfield, CA | $340,000 | 4.6% | 19.7% |
| Baltimore, MD | $325,000 | -1.2% | 5.2% |
| Baton Rouge, LA | $243,900 | -0.6% | 8.8% |
| Birmingham, AL | $265,000 | 1.1% | 13.5% |
| Boston, MA | $619,000 | 1.5% | 12.5% |
| Bridgeport, CT | $495,000 | 3.1% | -0.4% |
| Buffalo, NY | $205,000 | -2.4% | 13.3% |
| Camden, NJ | $269,000 | 2.3% | 13.0% |
| Charleston, SC | $389,000 | 7.0% | 21.6% |
| Charlotte, NC | $357,000 | -1.4% | 20.4% |
| Chicago, IL | $288,000 | -0.7% | 8.3% |
| Cincinnati, OH | $236,000 | -2.5% | 9.0% |
| Cleveland, OH | $180,000 | -4.1% | 4.0% |
| Columbus, OH | $270,000 | -1.8% | 10.2% |
| Dallas, TX | $385,000 | 1.1% | 20.3% |
| Dayton, OH | $178,000 | -1.1% | 11.3% |
| Denver, CO | $540,000 | 0.3% | 19.5% |
| Detroit, MI | $174,900 | -2.8% | 12.8% |
| El Paso, TX | $217,900 | 4.3% | 17.8% |
| Elgin, IL | $265,000 | -6.6% | 7.3% |
| Fort Lauderdale, FL | $365,000 | 1.4% | 17.0% |
| Fort Worth, TX | $337,000 | 4.5% | 23.9% |
| Frederick, MD | $492,500 | 0.5% | 11.4% |
| Fresno, CA | $380,200 | 1.1% | 18.8% |
| Grand Rapids, MI | $260,000 | -3.3% | 13.0% |
| Greensboro, NC | $230,000 | 0.0% | 13.1% |
| Greenville, SC | $289,600 | 0.8% | 19.5% |
| Hartford, CT | $274,900 | 0.0% | 7.8% |
| Houston, TX | $319,000 | 1.9% | 17.3% |
| Indianapolis, IN | $250,000 | 0.0% | 13.6% |
| Jacksonville, FL | $320,000 | -1.5% | 18.7% |
| Kansas City, MO | $275,000 | 1.9% | 12.2% |
| Knoxville, TN | $305,000 | 1.7% | 23.5% |
| Lake County, IL | $275,000 | -3.3% | 6.4% |
| Las Vegas, NV | $399,400 | 1.6% | 24.8% |
| Los Angeles, CA | $835,000 | 2.5% | 14.4% |
| Louisville, KY | $237,800 | 0.7% | 10.6% |
| McAllen, TX | $205,500 | 3.3% | 20.9% |
| Memphis, TN | $278,000 | 4.9% | 20.9% |
| Miami, FL | $440,000 | 4.8% | 22.2% |
| Milwaukee, WI | $247,800 | -3.6% | 8.5% |
| Minneapolis, MN | $335,000 | -1.5% | 8.1% |
| Montgomery County, PA | $385,000 | -1.7% | 10.0% |
| Nashville, TN | $410,000 | 2.5% | 24.2% |
| Nassau County, NY | $575,000 | -0.9% | 7.5% |
| New Brunswick, NJ | $425,000 | -0.5% | 10.4% |
| New Haven, CT | $275,000 | -1.8% | 10.0% |
| New Orleans, LA | $274,000 | 1.4% | 9.6% |
| New York, NY | $640,000 | -1.4% | 8.5% |
| Newark, NJ | $460,000 | 2.2% | 8.2% |
| North Port, FL | $417,400 | 3.6% | 28.4% |
| Oakland, CA | $876,000 | -3.2% | 8.1% |
| Oklahoma City, OK | $226,000 | -1.7% | 10.2% |
| Omaha, NE | $247,000 | -1.2% | 8.3% |
| Orlando, FL | $356,000 | 1.7% | 22.8% |
| Oxnard, CA | $805,000 | 1.2% | 18.2% |
| Philadelphia, PA | $259,000 | -2.3% | 7.9% |
| Phoenix, AZ | $435,200 | 1.2% | 28.0% |
| Pittsburgh, PA | $202,200 | -3.7% | 5.2% |
| Portland, OR | $510,000 | -0.8% | 13.3% |
| Providence, RI | $380,000 | 0.0% | 14.1% |
| Raleigh, NC | $395,000 | -1.2% | 25.4% |
| Richmond, VA | $309,900 | -2.5% | 4.7% |
| Riverside, CA | $530,000 | 2.9% | 18.3% |
| Rochester, NY | $180,000 | -1.6% | 5.9% |
| Sacramento, CA | $548,300 | -0.3% | 15.4% |
| Salt Lake City, UT | $490,000 | 1.3% | 22.5% |
| San Antonio, TX | $308,600 | 1.2% | 18.7% |
| San Diego, CA | $774,500 | -0.1% | 17.3% |
| San Francisco, CA | $1,488,400 | -5.5% | 10.3% |
| San Jose, CA | $1,368,000 | -0.9% | 15.0% |
| Seattle, WA | $727,000 | 1.1% | 16.9% |
| St. Louis, MO | $222,000 | -0.9% | 7.8% |
| Tacoma, WA | $515,000 | 2.0% | 19.8% |
| Tampa, FL | $338,000 | 2.4% | 24.3% |
| Tucson, AZ | $329,000 | 2.0% | 25.6% |
| Tulsa, OK | $222,100 | -3.4% | 5.8% |
| Honolulu, HI | $710,000 | 3.6% | 9.2% |
| Virginia Beach, VA | $285,000 | 0.0% | 6.2% |
| Warren, MI | $257,000 | -1.7% | 7.1% |
| Washington, D.C. | $487,500 | -1.5% | 8.3% |
| West Palm Beach, FL | $390,000 | -2.5% | 14.0% |
| Worcester, MA | $358,500 | -1.8% | 12.0% |
| National | $382,900 | -0.1% | 15.2% |
Homes Sold
| Redfin Metro | Homes Sold | Month-Over-Month | Year-Over-Year |
|---|---|---|---|
| Albany, NY | 962 | -14.3% | -20.8% |
| Allentown, PA | 893 | -3.6% | -18.1% |
| Anaheim, CA | 2,482 | -4.9% | -19.8% |
| Atlanta, GA | 8,540 | -6.6% | -17.6% |
| Austin, TX | 3,303 | 9.2% | -10.4% |
| Bakersfield, CA | 813 | -7.4% | -16.0% |
| Baltimore, MD | 3,948 | -4.6% | -8.8% |
| Baton Rouge, LA | 1,130 | 11.9% | 7.0% |
| Birmingham, AL | 1,396 | -5.2% | -9.5% |
| Boston, MA | 4,661 | 0.3% | -10.1% |
| Bridgeport, CT | 1,319 | 5.4% | -17.9% |
| Buffalo, NY | 1,253 | 8.1% | -7.3% |
| Camden, NJ | 1,747 | -1.7% | -15.7% |
| Charleston, SC | 1,622 | 7.3% | -12.3% |
| Charlotte, NC | 4,272 | -0.8% | -4.9% |
| Chicago, IL | 8,385 | -0.4% | -3.0% |
| Cincinnati, OH | 2,764 | -1.4% | -4.6% |
| Cleveland, OH | 2,806 | -0.9% | -3.1% |
| Columbus, OH | 2,631 | -4.3% | -1.7% |
| Dallas, TX | 5,807 | 5.5% | -11.7% |
| Dayton, OH | 1,059 | -3.8% | -1.8% |
| Denver, CO | 4,625 | -12.7% | -7.7% |
| Detroit, MI | 1,897 | -2.4% | -6.4% |
| El Paso, TX | 920 | 11.9% | -4.5% |
| Elgin, IL | 1,030 | -2.6% | -3.1% |
| Fort Lauderdale, FL | 3,271 | 5.3% | -14.0% |
| Fort Worth, TX | 3,085 | 2.8% | -9.3% |
| Frederick, MD | 1,715 | -0.5% | -8.8% |
| Fresno, CA | 798 | 0.3% | -5.7% |
| Grand Rapids, MI | 1,203 | -13.1% | -11.3% |
| Greensboro, NC | 1,014 | 9.9% | 7.9% |
| Greenville, SC | 1,401 | 12.9% | 9.4% |
| Hartford, CT | 1,646 | 0.2% | -11.8% |
| Houston, TX | 9,444 | 10.5% | -5.2% |
| Indianapolis, IN | 3,258 | -1.0% | -3.2% |
| Jacksonville, FL | 3,072 | 4.4% | -2.7% |
| Kansas City, MO | 3,147 | -2.6% | -7.3% |
| Knoxville, TN | 1,267 | -4.2% | -9.2% |
| Lake County, IL | 1,121 | -12.6% | -4.5% |
| Las Vegas, NV | 3,896 | -3.3% | -5.8% |
| Los Angeles, CA | 6,799 | 4.8% | -4.6% |
| Louisville, KY | 1,780 | 1.3% | -3.3% |
| McAllen, TX | 394 | 15.5% | -5.5% |
| Memphis, TN | 1,407 | 1.9% | -11.8% |
| Miami, FL | 3,275 | 7.6% | -1.5% |
| Milwaukee, WI | 1,946 | -1.9% | 5.5% |
| Minneapolis, MN | 5,051 | -10.7% | -4.5% |
| Montgomery County, PA | 2,433 | -1.8% | -10.2% |
| Nashville, TN | 3,801 | 1.6% | -8.5% |
| Nassau County, NY | 2,965 | 14.7% | -22.3% |
| New Brunswick, NJ | 3,380 | 1.3% | -21.6% |
| New Haven, CT | 1,111 | 4.5% | -7.9% |
| New Orleans, LA | 1,390 | 6.8% | -7.3% |
| New York, NY | 7,232 | 11.4% | -3.6% |
| Newark, NJ | 2,421 | 6.3% | -18.0% |
| North Port, FL | 2,304 | 5.9% | -16.4% |
| Oakland, CA | 2,413 | -15.7% | -15.7% |
| Oklahoma City, OK | 2,098 | 1.7% | -1.8% |
| Omaha, NE | 1,224 | -7.6% | 0.4% |
| Orlando, FL | 4,440 | 3.4% | -2.3% |
| Oxnard, CA | 720 | -12.1% | -18.2% |
| Philadelphia, PA | 2,395 | 2.3% | 0.7% |
| Phoenix, AZ | 8,565 | 4.4% | -8.8% |
| Pittsburgh, PA | 2,516 | 1.2% | -2.6% |
| Portland, OR | 3,442 | -7.0% | -7.3% |
| Providence, RI | 2,104 | 2.5% | -9.7% |
| Raleigh, NC | 2,345 | -2.6% | -15.2% |
| Richmond, VA | 1,958 | 1.1% | -4.3% |
| Riverside, CA | 5,812 | 5.4% | -5.6% |
| Rochester, NY | 1,138 | 0.2% | -13.6% |
| Sacramento, CA | 2,586 | -6.8% | -15.5% |
| Salt Lake City, UT | 1,474 | -4.0% | -14.5% |
| San Antonio, TX | 3,008 | 9.7% | -11.9% |
| San Diego, CA | 3,118 | 0.1% | -12.8% |
| San Francisco, CA | 1,076 | -20.5% | -13.6% |
| San Jose, CA | 1,307 | -19.6% | -3.6% |
| Seattle, WA | 3,760 | -17.0% | -15.4% |
| St. Louis, MO | 3,801 | 0.6% | -3.0% |
| Tacoma, WA | 1,474 | -5.0% | -7.4% |
| Tampa, FL | 6,361 | 5.4% | 0.5% |
| Tucson, AZ | 1,600 | -1.4% | -10.0% |
| Tulsa, OK | 1,519 | 8.2% | 3.8% |
| Honolulu, HI | 940 | -0.3% | 3.8% |
| Virginia Beach, VA | 2,754 | 3.7% | -2.3% |
| Warren, MI | 3,460 | -8.1% | -13.6% |
| Washington, D.C. | 6,548 | -6.1% | -8.0% |
| West Palm Beach, FL | 2,996 | 3.0% | -20.7% |
| Worcester, MA | 1,198 | 2.3% | -6.0% |
| National | 579,300 | -3.6% | -10.7% |
New Listings
| Redfin Metro | New Listings | Month-Over-Month | Year-Over-Year |
|---|---|---|---|
| Albany, NY | 460 | -40.2% | -23.8% |
| Allentown, PA | 247 | -54.3% | -58.8% |
| Anaheim, CA | 1,360 | -31.3% | -28.0% |
| Atlanta, GA | 5,762 | -23.8% | -16.5% |
| Austin, TX | 1,986 | -28.4% | -14.3% |
| Bakersfield, CA | 586 | -20.6% | -12.1% |
| Baltimore, MD | 2,382 | -27.0% | -12.6% |
| Baton Rouge, LA | 338 | -48.2% | -58.2% |
| Birmingham, AL | 1,031 | -17.8% | 0.1% |
| Boston, MA | 1,796 | -46.3% | -17.7% |
| Bridgeport, CT | 592 | -33.1% | -27.7% |
| Buffalo, NY | 502 | -44.5% | -14.8% |
| Camden, NJ | 1,083 | -25.5% | -13.2% |
| Charleston, SC | 1,048 | -19.6% | -8.9% |
| Charlotte, NC | 2,124 | -32.8% | -26.4% |
| Chicago, IL | 4,152 | -34.5% | -15.5% |
| Cincinnati, OH | 1,634 | -28.5% | -14.0% |
| Cleveland, OH | 1,584 | -32.3% | -1.5% |
| Columbus, OH | 1,666 | -26.6% | -5.8% |
| Dallas, TX | 3,929 | -21.3% | -9.2% |
| Dayton, OH | 710 | -20.4% | 6.6% |
| Denver, CO | 2,363 | -33.0% | -16.9% |
| Detroit, MI | 1,353 | -34.1% | -4.7% |
| El Paso, TX | 649 | -12.9% | -13.1% |
| Elgin, IL | 530 | -33.9% | -14.7% |
| Fort Lauderdale, FL | 2,260 | -20.5% | -28.0% |
| Fort Worth, TX | 2,146 | -18.6% | -2.7% |
| Frederick, MD | 866 | -30.4% | -25.2% |
| Fresno, CA | 487 | -29.3% | -11.6% |
| Grand Rapids, MI | 686 | -32.6% | -15.6% |
| Greensboro, NC | 449 | -32.7% | -35.8% |
| Greenville, SC | 844 | -24.4% | -8.1% |
| Hartford, CT | 767 | -38.1% | -14.7% |
| Houston, TX | 6,747 | -18.2% | -4.1% |
| Indianapolis, IN | 2,039 | -29.7% | -2.0% |
| Jacksonville, FL | 2,219 | -14.3% | -1.5% |
| Kansas City, MO | 1,827 | -25.4% | -18.3% |
| Knoxville, TN | 627 | -35.8% | -22.0% |
| Lake County, IL | 590 | -31.3% | -12.9% |
| Las Vegas, NV | 2,603 | -20.8% | -11.9% |
| Los Angeles, CA | 3,478 | -34.5% | -26.2% |
| Louisville, KY | 1,100 | -28.8% | -11.7% |
| McAllen, TX | 426 | -14.3% | -2.5% |
| Memphis, TN | 1,119 | -19.0% | 6.1% |
| Miami, FL | 2,522 | -20.2% | -18.5% |
| Milwaukee, WI | 861 | -38.8% | -19.1% |
| Minneapolis, MN | 2,100 | -41.0% | -24.5% |
| Montgomery County, PA | 1,224 | -37.5% | -13.3% |
| Nashville, TN | 2,142 | -24.1% | -19.1% |
| Nassau County, NY | 1,507 | -31.9% | -21.3% |
| New Brunswick, NJ | 1,629 | -35.4% | -22.1% |
| New Haven, CT | 560 | -29.5% | -13.6% |
| New Orleans, LA | 980 | -17.4% | -10.7% |
| New York, NY | 4,190 | -33.7% | -9.3% |
| Newark, NJ | 1,118 | -34.5% | -21.0% |
| North Port, FL | 1,669 | -19.4% | -15.0% |
| Oakland, CA | 1,225 | -33.5% | -27.0% |
| Oklahoma City, OK | 1,565 | -16.5% | 2.4% |
| Omaha, NE | 569 | -35.0% | -26.1% |
| Orlando, FL | 3,208 | -13.4% | -8.2% |
| Oxnard, CA | 414 | -27.0% | -31.3% |
| Philadelphia, PA | 1,578 | -31.4% | -5.3% |
| Phoenix, AZ | 5,557 | -24.3% | -10.9% |
| Pittsburgh, PA | 1,351 | -34.7% | 7.3% |
| Portland, OR | 1,777 | -32.0% | -15.3% |
| Providence, RI | 1,049 | -36.7% | -18.5% |
| Raleigh, NC | 1,373 | -28.0% | -21.1% |
| Richmond, VA | 1,037 | -28.6% | -18.6% |
| Riverside, CA | 3,463 | -28.6% | -11.0% |
| Rochester, NY | 502 | -38.4% | -1.0% |
| Sacramento, CA | 1,454 | -25.7% | -17.7% |
| Salt Lake City, UT | 474 | -52.5% | -48.2% |
| San Antonio, TX | 2,290 | -17.5% | -3.0% |
| San Diego, CA | 1,691 | -32.3% | -24.8% |
| San Francisco, CA | 306 | -58.8% | -43.8% |
| San Jose, CA | 578 | -41.1% | -37.6% |
| Seattle, WA | 1,943 | -32.7% | -22.7% |
| St. Louis, MO | 1,485 | -43.6% | -36.5% |
| Tacoma, WA | 817 | -25.6% | -10.3% |
| Tampa, FL | 4,530 | -16.6% | -5.2% |
| Tucson, AZ | 1,173 | -12.2% | -0.4% |
| Tulsa, OK | 1,023 | -18.2% | 5.7% |
| Honolulu, HI | 584 | -29.3% | -14.7% |
| Virginia Beach, VA | 1,775 | -23.7% | -12.0% |
| Warren, MI | 2,041 | -31.7% | -5.9% |
| Washington, D.C. | 3,548 | -28.6% | -19.6% |
| West Palm Beach, FL | 2,510 | -14.1% | -17.9% |
| Worcester, MA | 554 | -39.3% | -11.5% |
| National | 629,900 | -2.4% | -13.4% |
All Homes for Sale
| Redfin Metro | All Homes for Sale | Month-Over-Month | Year-Over-Year |
|---|---|---|---|
| Albany, NY | 1,916 | -23.5% | -30.9% |
| Allentown, PA | 1,048 | -35.5% | -43.8% |
| Anaheim, CA | 4,015 | -25.5% | -44.9% |
| Atlanta, GA | 16,080 | -19.2% | -27.4% |
| Austin, TX | 6,538 | -21.5% | -6.5% |
| Bakersfield, CA | 1,649 | -17.7% | -15.9% |
| Baltimore, MD | 7,467 | -20.8% | -13.1% |
| Baton Rouge, LA | 1,526 | -26.8% | -52.0% |
| Birmingham, AL | 3,482 | -12.1% | -25.9% |
| Boston, MA | 6,512 | -34.1% | -29.9% |
| Bridgeport, CT | 3,188 | -23.1% | -37.1% |
| Buffalo, NY | 1,518 | -30.1% | -14.3% |
| Camden, NJ | 3,487 | -17.5% | -17.3% |
| Charleston, SC | 4,033 | -11.9% | -26.4% |
| Charlotte, NC | 7,646 | -19.7% | -31.4% |
| Chicago, IL | 18,254 | -22.3% | -21.1% |
| Cincinnati, OH | 6,654 | -16.8% | -10.7% |
| Cleveland, OH | 5,989 | -20.4% | -7.9% |
| Columbus, OH | 5,789 | -18.4% | -7.3% |
| Dallas, TX | 10,278 | -19.2% | -27.6% |
| Dayton, OH | 2,169 | -15.2% | -11.3% |
| Denver, CO | 4,745 | -34.3% | -26.8% |
| Detroit, MI | 4,902 | -16.2% | 3.9% |
| El Paso, TX | 1,915 | -14.5% | -31.1% |
| Elgin, IL | 1,570 | -24.2% | -16.8% |
| Fort Lauderdale, FL | 9,187 | -11.7% | -39.7% |
| Fort Worth, TX | 5,495 | -19.8% | -16.7% |
| Frederick, MD | 2,690 | -25.9% | -18.5% |
| Fresno, CA | 1,188 | -23.9% | -12.5% |
| Grand Rapids, MI | 1,606 | -27.5% | -23.0% |
| Greensboro, NC | 1,595 | -24.0% | -36.1% |
| Greenville, SC | 3,122 | -13.8% | -24.0% |
| Hartford, CT | 3,316 | -23.7% | -29.2% |
| Houston, TX | 21,035 | -13.7% | -16.5% |
| Indianapolis, IN | 4,733 | -21.7% | -15.3% |
| Jacksonville, FL | 6,003 | -14.7% | -18.9% |
| Kansas City, MO | 5,263 | -20.0% | -21.7% |
| Knoxville, TN | 2,853 | -19.0% | -29.2% |
| Lake County, IL | 2,211 | -23.6% | -25.6% |
| Las Vegas, NV | 7,852 | -16.8% | -27.7% |
| Los Angeles, CA | 13,721 | -23.0% | -32.0% |
| Louisville, KY | 3,247 | -18.6% | -20.3% |
| McAllen, TX | 1,666 | -4.0% | -16.8% |
| Memphis, TN | 3,078 | -10.5% | -20.2% |
| Miami, FL | 12,459 | -10.4% | -29.5% |
| Milwaukee, WI | 4,823 | -22.0% | -0.9% |
| Minneapolis, MN | 7,845 | -29.1% | -16.4% |
| Montgomery County, PA | 3,859 | -27.2% | -21.1% |
| Nashville, TN | 6,439 | -16.8% | -27.5% |
| Nassau County, NY | 6,671 | -19.0% | -31.4% |
| New Brunswick, NJ | 7,308 | -21.6% | -18.7% |
| New Haven, CT | 2,618 | -21.5% | -24.9% |
| New Orleans, LA | 3,045 | -12.6% | -26.0% |
| New York, NY | 29,124 | -13.7% | -28.6% |
| Newark, NJ | 5,425 | -17.9% | -25.2% |
| North Port, FL | 3,332 | -14.7% | -43.2% |
| Oakland, CA | 2,763 | -35.5% | -29.0% |
| Oklahoma City, OK | 4,047 | -11.3% | -8.6% |
| Omaha, NE | 1,442 | -27.6% | -23.1% |
| Orlando, FL | 7,085 | -16.2% | -36.9% |
| Oxnard, CA | 1,343 | -22.2% | -30.9% |
| Philadelphia, PA | 7,056 | -15.5% | -6.5% |
| Phoenix, AZ | 15,180 | -18.1% | -18.6% |
| Pittsburgh, PA | 7,955 | -16.1% | -5.5% |
| Portland, OR | 4,361 | -28.2% | -19.9% |
| Providence, RI | 3,692 | -25.0% | -21.0% |
| Raleigh, NC | 4,096 | -21.0% | -35.7% |
| Richmond, VA | 2,397 | -25.7% | -28.6% |
| Riverside, CA | 11,444 | -19.0% | -14.7% |
| Rochester, NY | 1,265 | -31.8% | -28.2% |
| Sacramento, CA | 3,509 | -28.8% | -18.6% |
| Salt Lake City, UT | 1,367 | -41.8% | -46.1% |
| San Antonio, TX | 6,718 | -14.4% | -17.8% |
| San Diego, CA | 3,720 | -29.0% | -35.1% |
| San Francisco, CA | 1,714 | -35.7% | -46.1% |
| San Jose, CA | 1,360 | -39.4% | -48.7% |
| Seattle, WA | 3,467 | -36.6% | -41.5% |
| St. Louis, MO | 5,808 | -26.3% | -30.3% |
| Tacoma, WA | 1,584 | -29.5% | -8.0% |
| Tampa, FL | 9,167 | -16.2% | -29.8% |
| Tucson, AZ | 3,881 | -12.0% | -8.5% |
| Tulsa, OK | 2,473 | -15.1% | -13.6% |
| Honolulu, HI | 2,787 | -12.7% | -22.2% |
| Virginia Beach, VA | 4,798 | -21.0% | -17.0% |
| Warren, MI | 6,434 | -21.7% | -9.9% |
| Washington, D.C. | 12,440 | -23.3% | -13.4% |
| West Palm Beach, FL | 8,290 | -8.9% | -41.2% |
| Worcester, MA | 1,718 | -29.7% | -16.3% |
| National | 1,334,600 | -3.2% | -18.9% |


