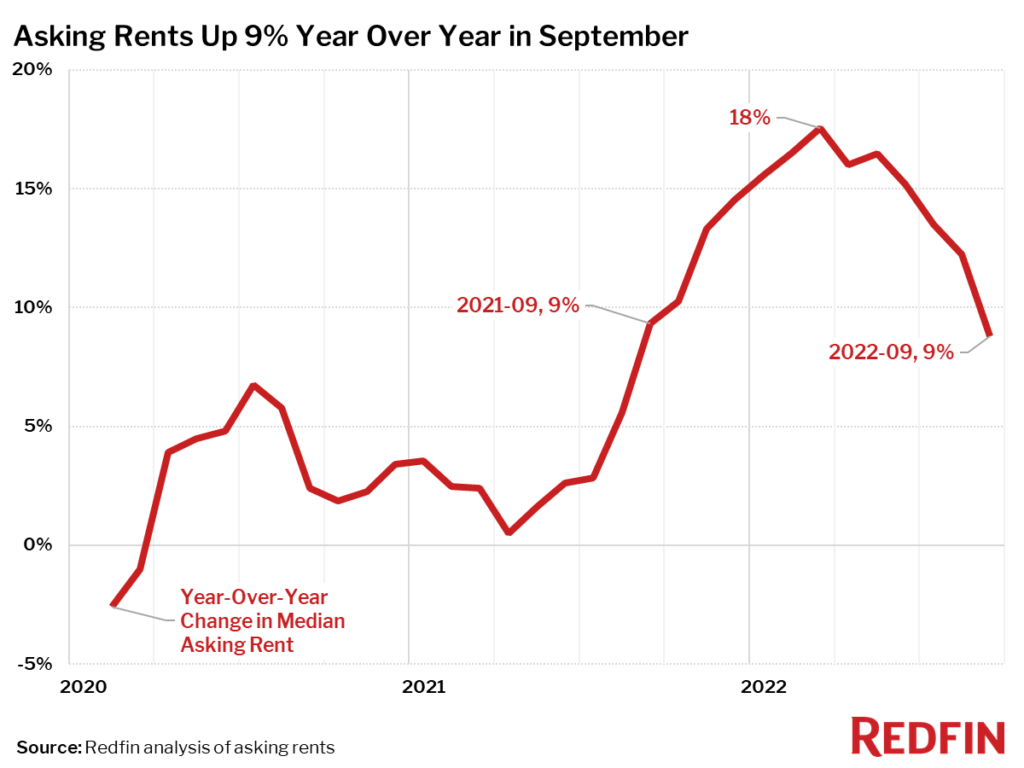
Rents rose 9% year over year in September—the first single-digit increase in a year and a marked slowdown from 18% growth in March. Inflation and economic uncertainty are prompting Americans to hold off on significant financial decisions like moving.
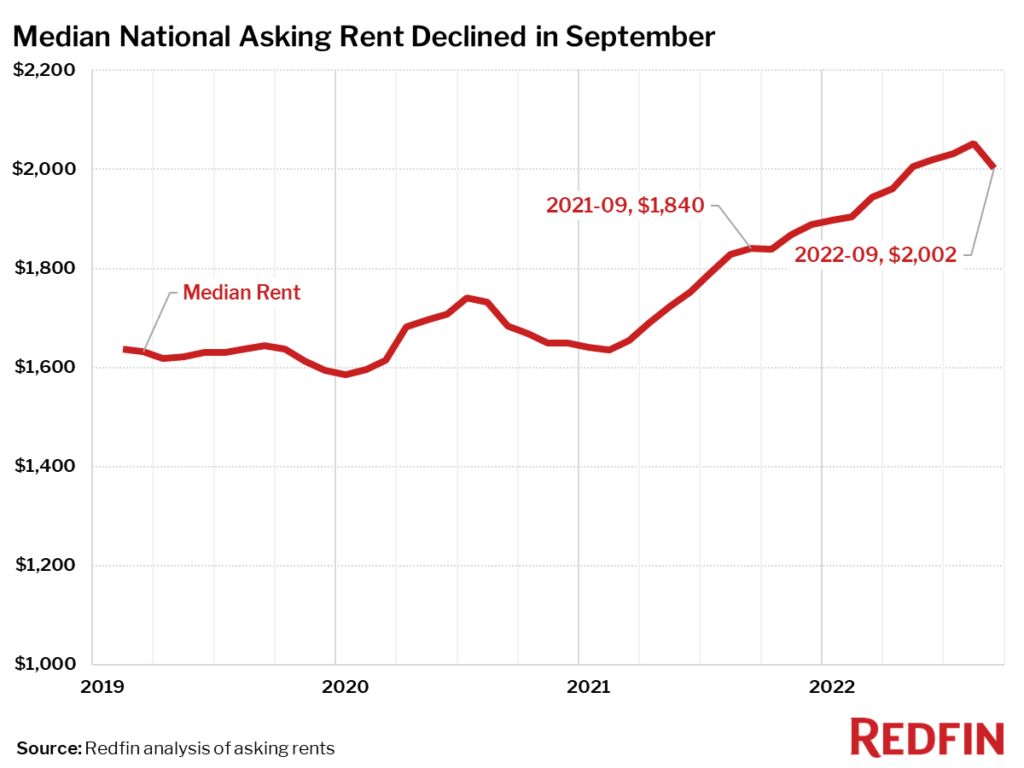
The median U.S. asking rent rose 9% year over year in September to $2,002, the slowest growth since August 2021 and the first single-digit increase in a year. September was the fourth-consecutive month in which annual rent growth decelerated, with rents climbing at half the pace they were six months earlier.
“The rental market is coming back down to earth because high rents and economic uncertainty have put an end to the pandemic moving frenzy of 2020 and 2021, when remote work fueled an enormous surge in housing demand that would’ve otherwise been spread out over the coming years,” said Redfin Deputy Chief Economist Taylor Marr. “Rising supply is also causing rent growth to slow. Scores of apartments that have been under construction are now coming on the market, and more homeowners are choosing to become landlords instead of selling in order to hold on to their record-low mortgage rates.”
Marr continued: “We expect rent growth to slow further into 2023 as Americans continue to hunker down and more new rentals hit the market.”
| Rental Market Summary | September 2022 | Month-Over-Month | Year-Over-Year |
|---|---|---|---|
| Median Monthly Rent | $2,002 | -2.5% | 8.8% |
Rents Rose 20% or More in Oklahoma City and Pittsburgh
In Oklahoma City, OK, asking rents increased 24.1% year over year in September, the largest jump among the 50 most populous U.S. metropolitan areas. Pittsburgh saw an increase of 20%. Next came Indianapolis, Louisville, KY, Nashville, Cincinnati, Raleigh, NC and New York, all with gains of more than 15%.
Top 10 Metro Areas With Fastest-Rising Rents Year Over Year
- Oklahoma City, OK (24.1%)
- Pittsburgh, PA (20%)
- Indianapolis, IN (17.9%)
- Louisville, KY (17.5%)
- Nashville, TN (17%)
- Cincinnati, OH (16.5%)
- Raleigh, NC (16.4%)
- New York, NY (15.4%)
- Portland, OR (14%)
- San Antonio, TX (12.5%)
Five of the 50 most populous metro areas saw rents fall in September from a year earlier. Rents declined 14.3% in Milwaukee, 8.8% in Minneapolis, 2.8% in Baltimore and less than 1% in Houston and Chicago.
Metro Areas Where Rents Declined Year Over Year
- Milwaukee, WI (-14.3%)
- Minneapolis, MN (-8.8%)
- Baltimore, MD (-2.8%)
- Houston, TX (-0.6%)
- Chicago, IL (-0.5%)
Median Asking Rents, September 2022
| U.S. Metro Area | Median Asking Rent | Year-Over-Year Change in Median Asking Rent |
|---|---|---|
| Atlanta, GA | $2,084 | 2.7% |
| Austin, TX | $2,395 | 8.9% |
| Baltimore, MD | $2,041 | -2.8% |
| Birmingham, AL | $1,490 | 4.8% |
| Boston, MA | $3,731 | 1.1% |
| Buffalo, NY | $1,504 | 11.1% |
| Charlotte, NC | $1,909 | 7.2% |
| Chicago, IL | $2,437 | -0.5% |
| Cincinnati, OH | $1,569 | 16.5% |
| Cleveland, OH | $1,500 | 6.8% |
| Columbus, OH | $1,558 | 3.2% |
| Dallas, TX | $2,157 | 8.8% |
| Denver, CO | $2,752 | 9.7% |
| Detroit, MI | $1,619 | 9.7% |
| Hartford, CT | $2,076 | 5.2% |
| Houston, TX | $1,751 | -0.6% |
| Indianapolis, IN | $1,490 | 17.9% |
| Jacksonville, FL | $1,649 | 0.2% |
| Kansas City, MO | $1,528 | 6.6% |
| Las Vegas, NV | $1,878 | 4.8% |
| Los Angeles, CA | $3,469 | 1.1% |
| Louisville, KY | $1,412 | 17.5% |
| Memphis, TN | $1,549 | 7.4% |
| Miami, FL | $3,080 | 7.3% |
| Milwaukee, WI | $1,633 | -14.3% |
| Minneapolis, MN | $1,735 | -8.8% |
| Nashville, TN | $2,127 | 17.0% |
| New Orleans, LA | $1,847 | 11.0% |
| New York, NY | $4,176 | 15.4% |
| Oklahoma City, OK | $1,260 | 24.1% |
| Orlando, FL | $2,121 | 4.2% |
| Philadelphia, PA | $2,334 | 4.4% |
| Phoenix, AZ | $2,043 | 1.8% |
| Pittsburgh, PA | $1,923 | 20.0% |
| Portland, OR | $2,602 | 14.0% |
| Providence, RI | $2,524 | 7.3% |
| Raleigh, NC | $2,030 | 16.4% |
| Richmond, VA | $1,798 | 10.4% |
| Riverside, CA | $2,724 | 2.9% |
| Sacramento, CA | $2,774 | 5.3% |
| Salt Lake City, UT | $1,921 | 8.9% |
| San Antonio, TX | $1,418 | 12.5% |
| San Diego, CA | $3,441 | 9.5% |
| San Francisco, CA | $3,807 | 9.9% |
| San Jose, CA | $3,611 | 6.2% |
| Seattle, WA | $2,972 | 3.0% |
| St. Louis, MO | $1,570 | 4.1% |
| Tampa, FL | $2,173 | 4.1% |
| Virginia Beach, VA | $1,703 | 3.9% |
| Washington, D.C. | $2,706 | 6.7% |
| National | $2,002 | 8.8% |
Methodology
Redfin analyzed rent prices from Rent. across the 50 largest U.S. metro areas. This analysis uses data from more than 20,000 apartment buildings across the country.
It is important to note that the prices in this report reflect the current costs of new leases during each time period. In other words, the amount shown as the median rent is not the median of what all renters are paying, but the median cost of apartments that were available for new renters during the report month. Currently, Redfin’s data from Rent. includes only median rent at the metro level. Future reports will compare median rent prices at a more granular geographic level.