
Some Americans are hesitant to sell their homes as mortgage rates soar because they have a low interest rate locked in. That’s contributing to a nearly-20% slump in new listings.
Roughly six of every seven (85%) U.S. homeowners with mortgages have a mortgage interest rate far below today’s level of 6%. With rates now at the highest since the 2008 financial crisis, some of those homeowners are discouraged from moving because selling their home and buying another could mean giving up their low mortgage rate and taking on a larger monthly housing bill.
That’s according to a Redfin analysis of Federal Housing Finance Agency (FHFA) data. We define a mortgage rate far below today’s level as one under 5%.
The high share of homeowners who feel locked into their low mortgage rate is contributing to a steep decline in the number of homes hitting the market. New listings slumped 19% year over year during the four weeks ending Sept. 11, the largest drop since May 2020.
This “lock-in” effect is manifesting in markets across the country. For example, Redfin found that in Atlanta, Chicago, Los Angeles and Washington, D.C., homeowners with a mortgage rate below 3.5% were 7.6% less likely to put their homes up for sale in August than homeowners with a rate above 3.5%.
Listings are also on the decline because many homeowners are hesitant to put their house up for sale at a time when the market is slowing and home prices are starting to fall in some areas. Some homeowners are opting to rent their properties out instead of selling to cash in on rising rents.
“The plunge in new listings is hindering growth in housing supply, which is keeping home prices relatively high even though the market is slowing down,” said Redfin Deputy Chief Economist Taylor Marr. “Housing supply fell 1% in August from the month before; normally, it would rise during a downturn.”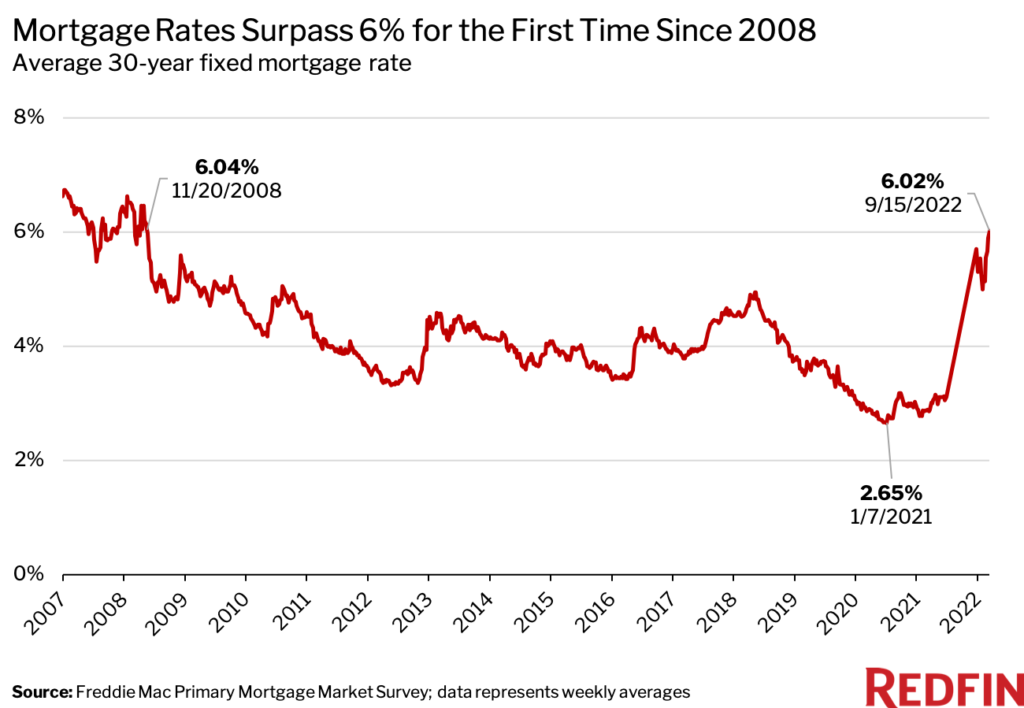
Mortgage rates last week eclipsed 6% for the first time since November 2008— when the country was in a deep recession—as the Federal Reserve seeks to quell inflation. Rising rates have pushed the typical homebuyer’s monthly mortgage payment up 42% from a year ago, fueling a broad slowdown in the housing market.
“The good news is that people who already own homes have locked in relatively low mortgage payments,” Marr said. “The bad news is that homeownership is moving further out of reach for other folks as rising rates, elevated home prices and the persisting housing shortage make buying a house more expensive.”
It’s worth noting that not everyone with a mortgage rate far below today’s level is deterred from selling. Many homeowners have built hundreds of thousands of dollars worth of home equity during the pandemic thanks to skyrocketing housing prices. For some, that means moving and taking on a higher interest rate isn’t a huge deal—especially when moving to a more affordable place. That said, the prospect of cashing out big on that home equity is starting to wane as price-growth slows and homebuyer demand dries up.
Utah, Colorado and Idaho Have Highest Share of Homeowners With Rates Below 5%
In Utah, 93% of homeowners with mortgages have a mortgage rate below 5%—a higher share than any other state. Next comes Colorado (92%), Idaho (92%), Oregon (91%) and Montana (91%). Many parts of these states, including Salt Lake City and Boise, saw large increases in net domestic migration during the pandemic, when mortgage rates hit a record low. That may explain the relatively high share of homeowners with low rates.
Meanwhile, just 77% of homeowners with mortgages in West Virginia have a mortgage rate below 5%—the lowest share in the country. Rounding out the bottom five are Mississippi (78%), Louisiana (80%), New York (80%) and Oklahoma (82%).
State-Level Summary: First Quarter 2022
Please note that data below only includes homeowners who have mortgages.
| State | Share of of properties with a mortgage rate below 5% | Share of properties with a mortgage |
| Alabama | 82.8% | 55.7% |
| Alaska | 88.2% | 61.9% |
| Arizona | 88.8% | 63.3% |
| Arkansas | 83.3% | 54.2% |
| California | 88.2% | 69.5% |
| Colorado | 91.8% | 70.8% |
| Connecticut | 84.1% | 67.4% |
| Delaware | 85.0% | 64.7% |
| Florida | 82.6% | 56.7% |
| Georgia | 83.9% | 64.5% |
| Hawaii | 85.9% | 64.4% |
| Idaho | 91.7% | 64.1% |
| Illinois | 84.5% | 62.8% |
| Indiana | 84.7% | 65.2% |
| Iowa | 87.6% | 60.4% |
| Kansas | 85.8% | 58.6% |
| Kentucky | 83.7% | 57.2% |
| Louisiana | 80.3% | 52.0% |
| Maine | 83.4% | 60.7% |
| Maryland | 85.1% | 72.5% |
| Massachusetts | 87.7% | 68.5% |
| Michigan | 85.2% | 59.6% |
| Minnesota | 90.3% | 66.0% |
| Mississippi | 78.4% | 50.0% |
| Missouri | 86.0% | 61.2% |
| Montana | 90.7% | 56.0% |
| Nebraska | 89.2% | 59.4% |
| Nevada | 87.6% | 67.5% |
| New Hampshire | 86.4% | 65.0% |
| New Jersey | 84.4% | 66.0% |
| New Mexico | 82.2% | 53.4% |
| New York | 80.4% | 59.9% |
| North Carolina | 84.4% | 62.5% |
| North Dakota | 90.6% | 53.2% |
| Ohio | 82.6% | 62.4% |
| Oklahoma | 82.0% | 54.5% |
| Oregon | 90.8% | 66.1% |
| Pennsylvania | 82.5% | 59.9% |
| Rhode Island | 86.0% | 67.9% |
| South Carolina | 83.6% | 57.7% |
| South Dakota | 90.0% | 55.0% |
| Tennessee | 85.2% | 59.0% |
| Texas | 82.5% | 56.8% |
| Utah | 93.2% | 70.1% |
| Vermont | 82.7% | 62.4% |
| Virginia | 87.3% | 68.2% |
| Washington | 90.6% | 68.2% |
| Washington, D.C. | 87.0% | 75.6% |
| West Virginia | 76.7% | 46.7% |
| Wisconsin | 88.8% | 63.3% |
| Wyoming | 90.0% | 58.1% |
| National—U.S.A | 85.3% | 62.1% |
Methodology
This report is based on a Redfin analysis of first quarter 2022 data from the FHFA’s National Mortgage Database, which is a nationally representative 5% sample of residential mortgages in the U.S. The first quarter is the most recent period for which data on outstanding mortgages is available. Homebuyer mortgage rates don’t typically change significantly from quarter to quarter, as most homebuyers take out 30-year mortgages.
Redfin applied FHFA’s data to the roughly 80 million owner-occupied households we estimate existed in the U.S. in 2022 based on Census data. We refer to these households as “homeowners” throughout this analysis, and define a rate “substantially below” today’s level as one below 5%. Roughly two-thirds (62%) of households have an outstanding mortgage.
For the analysis on Atlanta, Chicago, Los Angeles and Washington, D.C. in paragraph four, Redfin used property-level county records to identify homeowner mortgage rates on more than 5.3 million properties in four geographically diverse U.S. housing markets. This analysis controlled for home values, location and property type, and is statistically significant at 95% confidence level.


